HYDROLOGIC CONDITIONS IN MASSACHUSETTS - january
←
→
Page content transcription
If your browser does not render page correctly, please read the page content below
M A S S A C H U S E T T S WAT E R R E S O U R C E S C O M M I S S I O N
J A N U A RY          HYDROLOGIC CONDITION                                                      S
2021                    IN MASSACHUSETTS

                                                       The Commonwealth of Massachusetts
                                                                   Charles D. Baker, Governor
     Kathleen A. Theoharides, Secretary, Executive Office of Energy and Environmental Affairs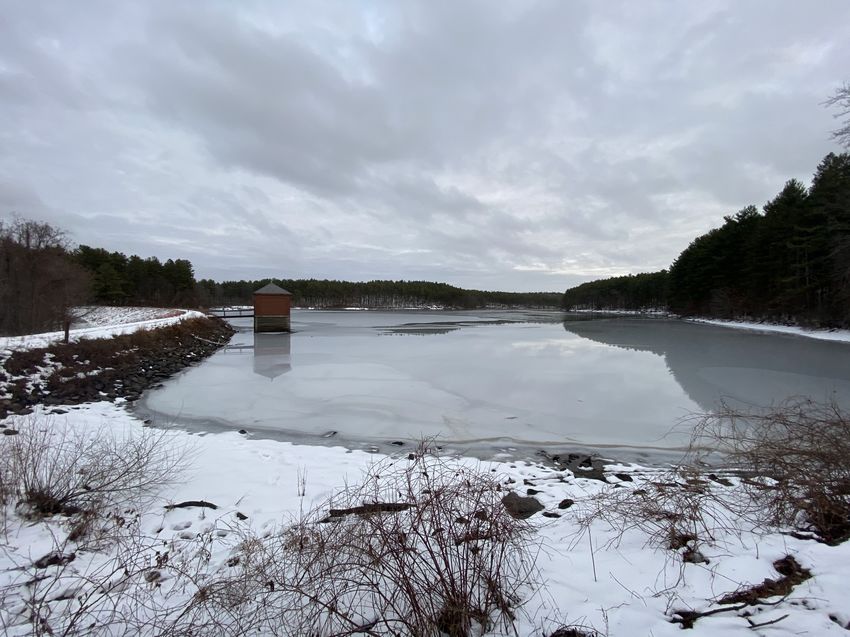
J A N U A RY 2 0 2 1 H Y D R O L O G I C C O N D I T I O N S
         S U M M A RY O F C O N D I T I O N S

     •   Monthly average temperatures were above to well above normal.
     •   Precipitation was below normal. Due to above normal temperatures, month-end snowpack only re-
         mained in the Berkshires.
     •   Monthly median streamflows were normal to above normal.
     •   Groundwater was mostly in the normal range.
     •   Lakes & Impoundments levels were in the normal range.
     •   NOAA’s February outlook projects equal chances for below-normal, normal, or above-normal tempera-
         ture and above-normal precipitation.
     •   NOAA’s 3-month outlook projects above-normal temperatures and equal chances for below-normal, nor-
         mal, or above-normal precipitation.
     •   Appendices I and II provide additional precipitation data and information on the Massachusetts Drought
         Management Plan (DMP), respectively.

2   January 2021 │ Water Resources Commission Hydrologic Conditions in Massachusetts
P R E C I P I TAT I O N
January was relatively dry for most of the state and especially in the Southeast, Cape Cod, and Islands drought re-
gions. For those regions, the 1-month Standardized Precipitation Index is at Index Severity Level 2 . Longer look-back
periods are still showing some deficits in some regions from the 2020 drought. Appendix I provides additional details
for precipitation data.

Monthly Precipitation Totals as Percentiles over Period of Record

                       NUMBER OF           ACTUAL              DEPARTURE
                                                                                    DMP SPI *             DMP SPI             DMP SPI
     REGION          SITES REPORT-        MONTHLY                FROM
                                                                                    1-MONTH              3-MONTH             6-MONTH
                      ING FOR JAN.       AVERAGE (IN)        HISTORICAL (IN)

    WESTERN                  6                 1.92               -1.13                -0.50               -0.26               -0.55
CT RIVER VALLEY             11                 2.32               -0.93                -0.36                0.44                0.16
    CENTRAL                 14                 2.56                 -1                 -0.42                0.81                0.21
   NORTHEAST                16                 2.78               -0.76                -0.51                0.28               -0.28
   SOUTHEAST                24                 2.27               -1.68                -0.95                0.34               -0.30
    CAPE COD                 6                 2.50               -1.51                -0.96               -0.24               -1.08

     ISLANDS                 4                 1.88                -1.8                -1.08                0.03               -0.86

*The Standardized Precipitation Index (SPI) values represent the variation, in standard deviations, from long-term precipitation averages.
              Index Severity Levels
     1            2           3            4

                                                      January 2021 │ Water Resources Commission Hydrologic Conditions in Massachusetts       3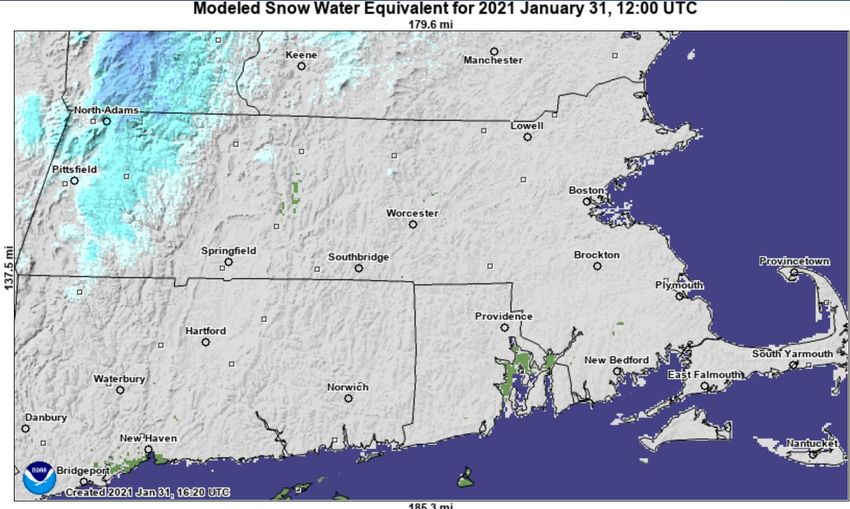
STREAMFLOW                                        Median Monthly Streamflow Percentiles
                                                      Compared to Historical Values
All but three gages were
above the 30th percentile,
indicating Level 0 for
Drought Index Severity level.
Three streams with smaller
watersheds in the Southeast
region were below the 30th
percentile. This area coin-
cides with some of the low-
est January precipitation
showing effects on the
smaller streams.

                                                                                                           MEDIAN OF
                     TOTAL
                                                                                                           INDIVIDUAL
                     GAGES    ≥0 TO ≤2   >2 TO ≤10 >10 TO ≤20 >20 to ≤30                      >90 PER-                DMP INDEX
    REGION                                                                                                    GAGE
                   REPORTING PERCENTILE PERCENTILE PERCENTILE PERCENTILE                      CENTILE                  SEVERITY
                                                                                                             PERCEN-
                    FOR JAN
                                                                                                              TILES

   WESTERN              8             0              0             0             0               0              50           0
CT RIVER VALLEY        14             0              0             0             0               0              76           0
   CENTRAL             11             0              0             0             0               1              81           0
  NORTHEAST            13             0              0             0             0               0              73           0
  SOUTHEAST            12             0              0             1             2               0              57           0
Note: Not all gages report in all months due to ice, beaver dams or other                            Index Severity Levels
conditions. Streamflow index is not applicable to Cape Cod and the Islands.               1              2           3        4

Time Series of the Percent of Gages at
Their Respective Percentile Flows for
Average Daily Streamflows Compared to
Historical Values

 Streamflow is monitored by the Commonwealth
 of Massachusetts and United States Geological
 Survey cooperative stream gaging program.
 https://waterdata.usgs.gov/nwis/sw

                                                   January 2021 │ Water Resources Commission Hydrologic Conditions in Massachusetts   4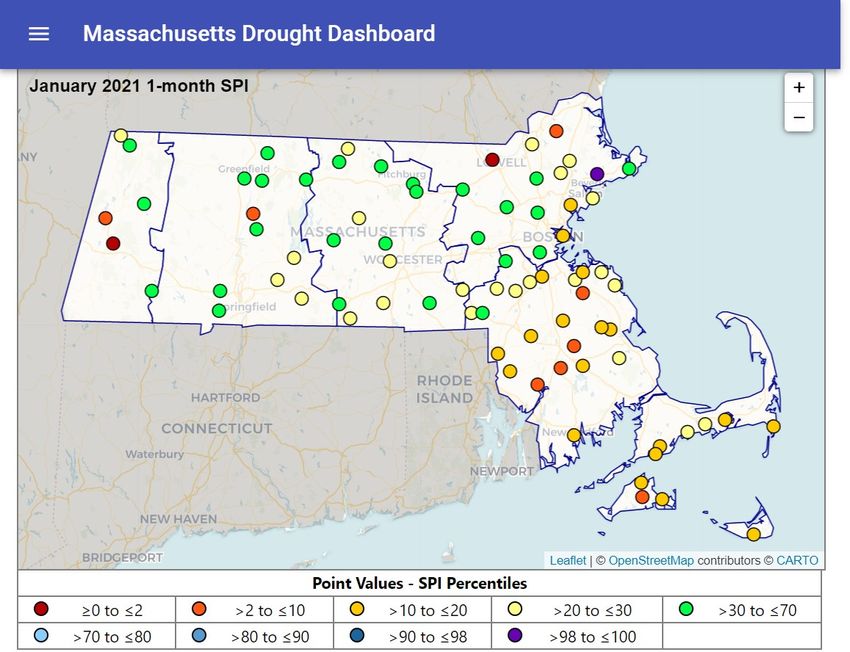
G R O U N D WAT E R
    All regional medians are above the 30th percentile. Regional percentiles have improved or nearly stayed the same
    since last month; a few individual wells are still lower than the 30th percentile. The figure below only shows automated
    wells due to a USGS database system upgrade. However, the table reflects analysis using all wells in the Climate Re-
    sponse Network that are monitored per the state’s Drought Management Plan and that reported for January.

    End of Month Groundwater Compared to Historical
    in the Climate Response Network’s Automated Wells

                                                                                          MEDIAN OF
                           TOTAL
                                                                    >20 TO ≤30            INDIVIDUAL
                           WELLS    ≥0 TO ≤2   >2 TO ≤10 >10 TO ≤20               >90                DMP INDEX
          REGION                                                     PERCEN-                 WELL
                         REPORTING PERCENTILE PERCENTILE PERCENTILE            PERCENTILE             SEVERITY
                                                                       TILE                 PERCEN-
                          FOR JAN.
                                                                                             TILES

         WESTERN               5              0             0              0           0    0            45           0
     CT RIVER VALLEY          11              0             0              0           0    0            66           0
         CENTRAL               9              0             0              0           0    2            82           0
       NORTHEAST              14              0             0              0           0    1            74           0
        SOUTHEAST             11              0             1              0           2    0            46           0
        CAPE COD              10              0             0              1           1    0            48           0
         ISLANDS               2              0             0              0           0    0            55           0

                Index Severity Levels
         1          2          3             4

5   January 2021 │ Water Resources Commission Hydrologic Conditions in Massachusetts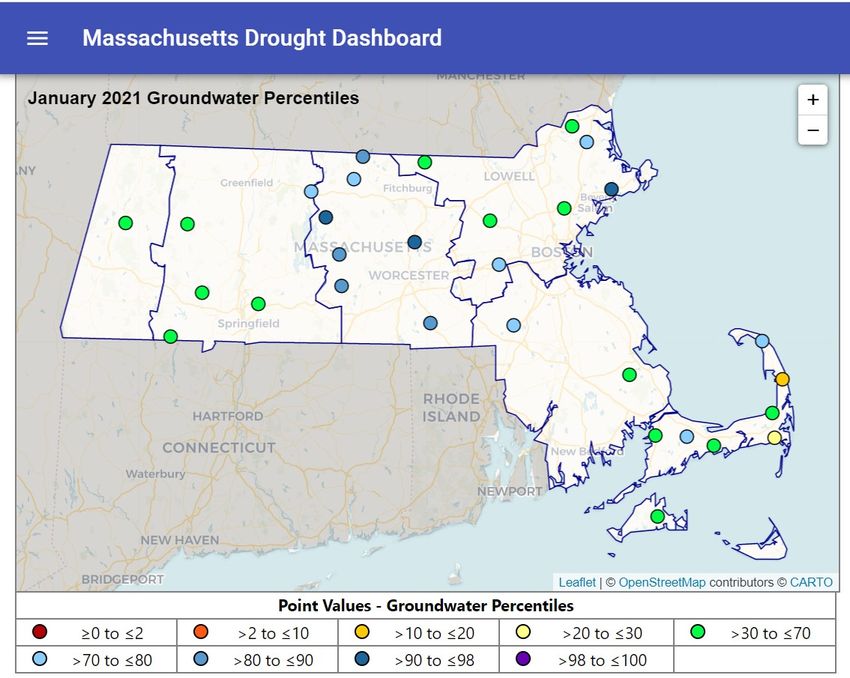
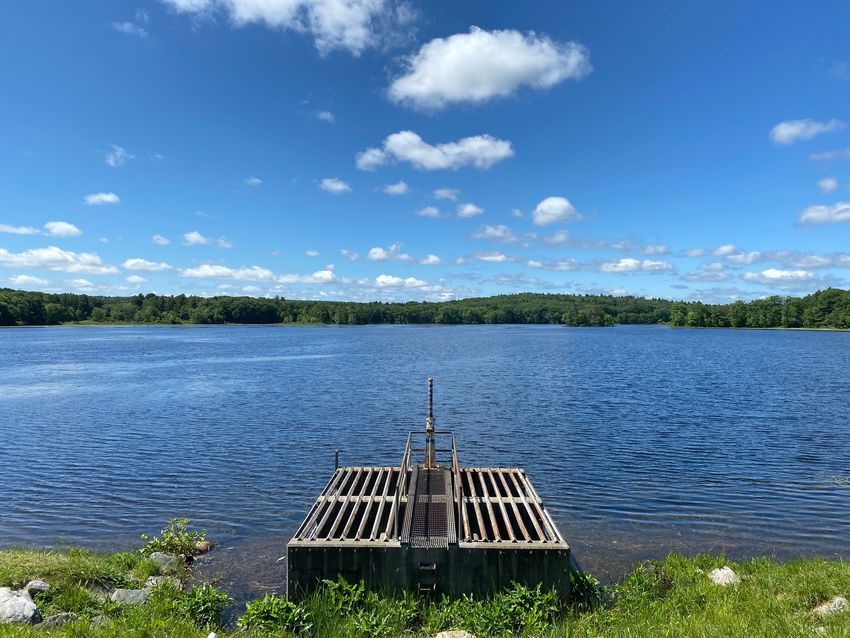
LAKES AND IMPOUNDMENTS
                                                 MEDIAN OF
                     TOTAL REPORTING                                 DMP INDEX         At the end of January, most lakes and
    REGION                                       INDIVIDUAL
                       FOR JANUARY                                    SEVERITY         impoundments were greater than
                                                 PERCENTILES
                                                                                       their 30th percentile value for this
   WESTERN                     2                     N/A*                  0           time of the year.
CT RIVER VALLEY                2                      52                   0
    CENTRAL                    3                      75                   0
  NORTHEAST                    5                      45                   0
  SOUTHEAST                    2                      42                   0
   CAPE COD                    1                      31                   0
    ISLANDS                  N/A                     N/A                 N/A
  *Median calculation not applicable: individual system levels 100% and 94.4% full.
   DMP Index Severity Levels do not necessarily reflect water supply status.

KEETCH BYRAM DROUGHT INDEX (KBDI)
KBDI is provided seasonally.

CROP MOISTURE INDEX (CMI)
CMI is provided seasonally.

SNOWFALL
                                                                      This month’s snowfall was below to
                                                                      well below average. Season-to-date
                                                                      snowfall totals are also mostly be-
                                                                      low average across the state.
                                                                      http://www.nrcc.cornell.edu/

Modeled Snow Water Equivalent at the
End of the Month in Inches
https://www.nohrsc.noaa.gov/technology/                                                                                        S

                                      January 2021 │ Water Resources Commission Hydrologic Conditions in Massachusetts   6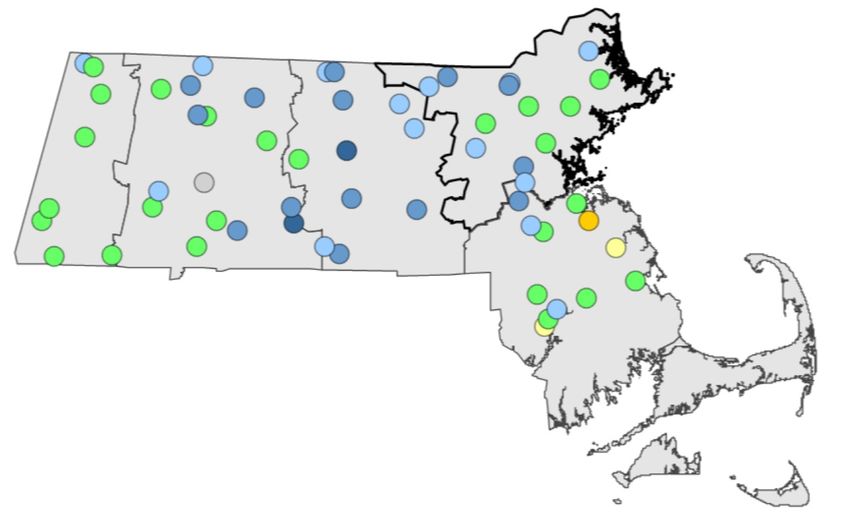
T E M P E R AT U R E
     Monthly average temperatures were above to well
     above normal.
     http://www.nrcc.cornell.edu/regional/monthly/
     monthly.html
     Daily average temperature departures from histori-
     cal averages ranged from +15.9 to –16.7 ° F.
     https://w2.weather.gov/climate/xmacis.php?wfo=box

     DROUGHT CONDITIONS AND FORECASTS
    U.S. Drought Monitor (USDM)                             Data through Jan. 26, 2021; released Jan. 28, 2021
    Throughout the month of January, and as of
    January 26th, there were no drought condi-
    tions shown on the USDM.
    USDM maps are produced by the National
    Drought Mitigation Center (NDMC). For meth-
    ods and weekly updates see: https://
    droughtmonitor.unl.edu

    NOAA Climate Prediction Center
    Temperature and Precipitation Outlook
    February: The outlook released 1/31 shows equal chances of below-normal, normal, or above-normal temperatures
    and 33-40% probability of above-normal precipitation.
    February through April: The outlook released 1/21 projects a 40-50% chance of above-normal temperatures, and
    equal chances of below-normal, normal, or above-normal precipitation. https://www.cpc.ncep.noaa.gov/

    Monthly and Seasonal Drought Outlook
    The monthly outlook for February released on 1/31 shows no drought development. The seasonal outlook released on
    1/21 and valid through April shows no drought development.

    This report was prepared by the Massachusetts Department of Conservation and Recreation. Data may be preliminary. Additional infor-
    mation, previous reports, and drought management information can be found at: https://www.mass.gov/water-data-tracking
    DCR Precipitation Reports are available at https://www.mass.gov/service-details/precipitation-composite-estimates-1 and https://
    www.mass.gov/service-details/standardized-precipitation-index-spi-0

7   January 2021 │ Water Resources Commission Hydrologic Conditions in Massachusetts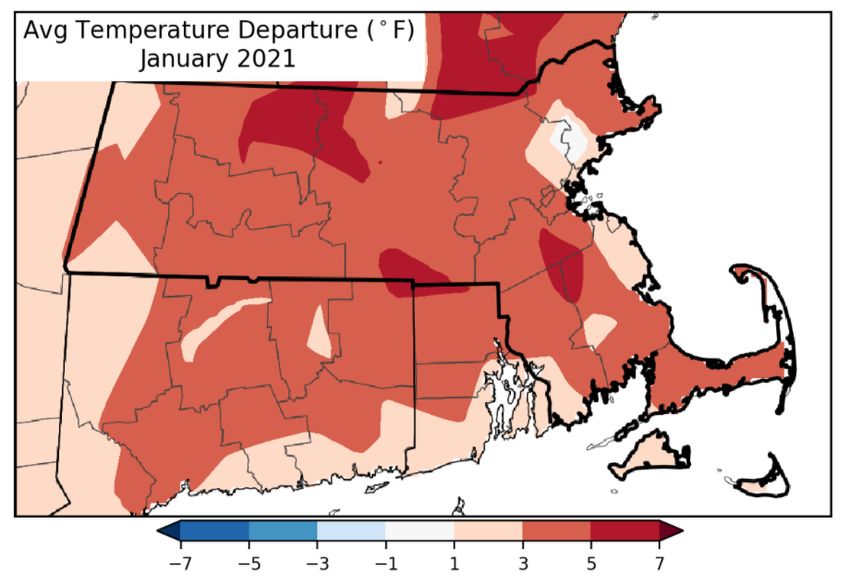
A P P E N D I X I — A D D I T I O N A L P R E C I P I TAT I O N D ATA
Standardized Precipitation Index January 2021
                     NUMBER
     REGION                        SPI1       SPI2    SPI3    SPI6     SPI9    SPI12     SPI24   SPI36
                     OF SITES

    WESTERN              5        -0.50       -0.37   -0.26   -0.55   -1.23    -0.79     -1.05   0.28
                                                                                                                Key to Index
 CT RIVER VALLEY         9        -0.36       0.29    0.44    0.16    -0.65    -0.46     -0.27   1.14          Severity Levels
                                                                                                                     0
     CENTRAL            13        -0.42       0.93    0.81    0.21    -0.40    -0.08     0.27    1.38
                                                                                                                     1
   NORTHEAST            13        -0.51       0.31    0.28    -0.28 -0.70      -0.47     0.07    0.79                2
   SOUTHEAST            24                                                                       1.23                3
                                  -0.95       0.51    0.34    -0.30 -0.72      -0.42     0.22
                                                                                                                     4
    CAPE COD             5        -0.96       0.57    -0.24   -1.08 -2.01      -1.52     -0.14   0.60

     ISLANDS             3        -1.08       0.28    0.03    -0.86 -1.25      -0.90     0.03    1.02

Percent of Average Historical Precipitation
                                                                             DEPARTURE
                     NUMBER OF         HISTORICAL        JANUARY AV-                              PERCENT OF
     REGION                                                               FROM HISTORICAL
                       SITES          AVERAGE (IN)        ERAGE (IN)                              HISTORICAL
                                                                            AVERAGE (IN)

    WESTERN                  6             3.05               1.92               -1.13                  63%

 CT RIVER VALLEY          11               3.25               2.32               -0.93                  71%

     CENTRAL              14               3.56               2.56                -1                    72%

   NORTHEAST              16               3.54               2.78               -0.76                  79%

   SOUTHEAST              24               3.95               2.27               -1.68                  57%

    CAPE COD                 6             4.01               2.50               -1.51                  62%

     ISLANDS                 4             3.68               1.88               -1.8                   51%

     January 2021 │ Water Resources Commission Hydrologic Conditions in Massachusetts     8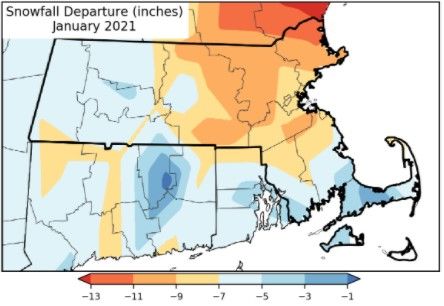
A P P E N D I X I I — D R O U G H T M A N A G E M E N T P L A N I N F O R M AT I O N

    The Massachusetts Drought Management Plan (DMP) can be                       Drought Levels (Section 3.1 of the DMP)
    found at https://www.mass.gov/doc/massachusetts-drought-
    management-plan/download. The document provides details                      Level 0 Normal
    on the Drought Indices, how Drought Levels are determined,                   Level 1 Mild Drought
    and actions associated with each drought level.
                                                                                 Level 2 Significant Drought
                                                                                 Level 3 Critical Drought
                                                                                 Level 4 Emergency Drought

    Index Severity Levels (Section 3.4 of the DMP)

                      STANDARDIZED                                                                  KEETCH-BRYAM
       SEVERITY                                                LAKES AND                                                   CROP MOISTURE
                      PRECIPITATION       STREAMFLOW                              GROUNDWATER         DROUGHT
         LEVEL                                               IMPOUNDMENTS                                                      INDEX
                        INDEX (SPI)                                                                  INDEX (KBDI)

           0                                       > 30th percentile                                        < 200               > -1.0

           1                                         ≤ 30 and > 20                                      200-400            ≤ -1.0 and > -2.0

           2                                         ≤ 20 and > 10                                      400-600            ≤ -2.0 and > -3.0

           3                                          ≤ 10 and > 2                                      600-700            ≤ -3.0 and > -4.0

           4                                               ≤2                                           700-800                 ≤ -4.0

9   January 2021 │ Water Resources Commission Hydrologic Conditions in Massachusetts
You can also read