Heathrow and Stansted BAA's London airports group - Investor update January 2012

Page created by Francisco Bauer
 
CONTINUE READING
Heathrow and Stansted BAA's London airports group - Investor update January 2012
Heathrow and Stansted
BAA’s London airports group
Investor update
January 2012
Heathrow and Stansted BAA's London airports group - Investor update January 2012
Agenda

1. Introduction

2. Recent significant business developments

3. Financial performance

4. Financing structure

5. Investment highlights

                                              2
Heathrow and Stansted BAA's London airports group - Investor update January 2012
Introduction
Heathrow and Stansted BAA's London airports group - Investor update January 2012
Introduction to BAA’s London airports group
                                                                          Split of RAB between Heathrow and Stansted
                                                                                    (as at 30 September 2011)

                                                                                     10.0%
• BAA’s shareholders
   – Alinda (5.88%), CDPQ (26.48%), Ferrovial
     (49.99%) and GIC (17.65%)
• BAA owns six UK airports
   – Heathrow, Stansted, Edinburgh, Glasgow,
     Aberdeen and Southampton
                                                                                                    90.0%

• London airports (Heathrow and                                                       Heathrow    Stansted
  Stansted) form bond issuing group                                Split of Adjusted EBITDA between Heathrow and Stansted
                                                                               (for year ended 30 September 2011)
   – Heathrow dominates the group                                                     8.1%

   – nationally critical infrastructure
   – independent regulation mitigates revenue
     and cost risks
   – ring-fenced from rest of BAA and
     separately financed
   – strong security package for creditors
                                                                                                 91.9%

                                                                                     Heathrow    Stansted
                              See pages 27-28 for sources, notes and defined terms                                     4
Heathrow and Stansted BAA's London airports group - Investor update January 2012
Heathrow – critical infrastructure for global aviation industry

• London is the world’s leading financial
  and commercial centre                                                                    Top 10 busiest global airports (year to June 2011)

                                                                                                                                                                 90.8
                                                                                         100.0
                                                                                          90.0

                                                                                                                                                          76.7
                                                                                                                                                   68.5
                                                                                          80.0

                                                                                                                                            67.0
                                                              (millions of passengers)
• Europe’s busiest airport and busiest

                                                                                                                                     64.5
                                                                                                                              60.6
                                                                                                                       59.9
                                                                                          70.0

                                                                                                                57.2
                                                                                                        55.3
  airport globally for international traffic

                                                                                                 52.5
                                                                                          60.0
                                                                                          50.0
                                                                                          40.0
                                                                                          30.0
• Heathrow has 8 of the global top 10                                                     20.0
  intercontinental long haul routes                                                       10.0
                                                                                           0.0
                                                                                                 DEN FRA DFW CDG LAX HND ORD LHR PEK ATL

• 75% of UK scheduled long haul traffic                                                                        USA
                                                                                                               Asian
                                                                                                                                       European
                                                                                                                                       Heathrow

                           See pages 27-28 for sources, notes and defined terms                                                                                  5
Heathrow and Stansted BAA's London airports group - Investor update January 2012
Heathrow’s resilience and diversity
                                                                            Heathrow passenger traffic by origin/destination
                                                                                   in year ended 31 December 2011

                                                                                                         6.8%

• Unique traffic resilience                                                      29.4%

   – operating close to full capacity
   – strength in high growth long haul
                                                                                                                         41.1%
   – countercyclical transfer traffic
• Dominant pricing power                                                               22.8%

   – Heathrow has charged to its full price cap
     through the recession                                               Domestic      European     North Atlantic     Other long haul

                                                                                 Proportion of long haul traffic (2010)
• Passenger and airline diversity                                   60.0%
                                                                                                                                 52.3%
   – balance of business and leisure traffic                        50.0%
                                                                                                                     44.0%
                                                                                                      41.0%
   – >50% non-UK resident passengers                                40.0%
                                                                                           34.0%
   – oneworld accounts for 49% of traffic                           30.0%
                                                                               22.7%
       • Frankfurt: 75% Star Alliance
                                                                    20.0%
       • Zurich: 69% Star Alliance
                                                                    10.0%
       • Schiphol: 61% SkyTeam
       • Aéroports de Paris: 56% SkyTeam                             0.0%
                                                                              Zurich     Schiphol   Frankfurt Charles de Heathrow
                                                                                                               Gaulle
                               See pages 27-28 for sources, notes and defined terms                                                  6
Heathrow and Stansted BAA's London airports group - Investor update January 2012
Exceptional traffic resilience in recent downturn

                      Change in annual passenger traffic in recent downturn between
                           previous peak traffic and subsequent trough traffic
 0.0%

 -2.0%
         -2.0%

 -4.0%            -3.4%

 -6.0%
                             -5.3%       -5.3%

                                                     -6.7%
                                                               -7.1%
 -8.0%

-10.0%                                                                    -9.5%      -9.7%       -9.7%
                                                                                                          -10.1%
                                                                                                                    -10.4%     -10.5%

-12.0%
         Zurich   Heathrow   New York   Charles de   Munich   Frankfurt   London     Schiphol    Vienna   Madrid   Los Angeles Copenhagen
                               JFK       Gaulle                           Gatwick

                                          See pages 27-28 for sources, notes and defined terms                                      7
Heathrow and Stansted BAA's London airports group - Investor update January 2012
Stable regulatory framework provides cash flow predictability
and mitigates market risk
• Tariffs allow recovery of cost of capital,
  operating costs and capital investment
   – tariffs increasing at RPI + 7.5% at Heathrow            ‘Single till’ price control building blocks
     and RPI + 1.63% at Stansted
   – current regulatory periods run to March 2014
                                                                                                Profiling
                                                                                               Adjustment
• Tariffs reset usually every five years
                                                                                                               Retail
                                                                                   Operating                  income
   – protects against revenue and cost volatility                                   costs                   and other
                                                                                                             revenue

   – consistent methodology for setting tariffs                      Regulatory
                                                                    Depreciation
     since 1987                                                                                                         Aeronautical
                                                                                                                          income
                                                        Return on                                                       requirement

• Independent regulator (Civil Aviation                   RAB

  Authority) with role defined by UK law              Aeronautical income requirement divided by forecast passengers
                                                      to produce maximum allowable yield per passenger
   – new legislation expected to further strengthen   Maximum allowable yield then adjusted using an RPI+/-X%
     creditor protections                             formula for the remaining years of the regulatory period

• ‘Single till’ price regulation similar to
  other UK regulated utilities

                                                                                                                           8
Heathrow and Stansted BAA's London airports group - Investor update January 2012
Resulting in stable rapidly improving financial performance
even in downturn

(figures in £m)                                   Forecast                    Actual Variance

2009 Adjusted EBITDA                                       895                  885    -1%

                                                                               +9.2%

2010 Adjusted EBITDA                                       965                  967    0%

                                                                              +16.7%

2011 Adjusted EBITDA                                   1,120                  1,128    1%

                       See pages 27-28 for sources, notes and defined terms                     9
Heathrow and Stansted BAA's London airports group - Investor update January 2012
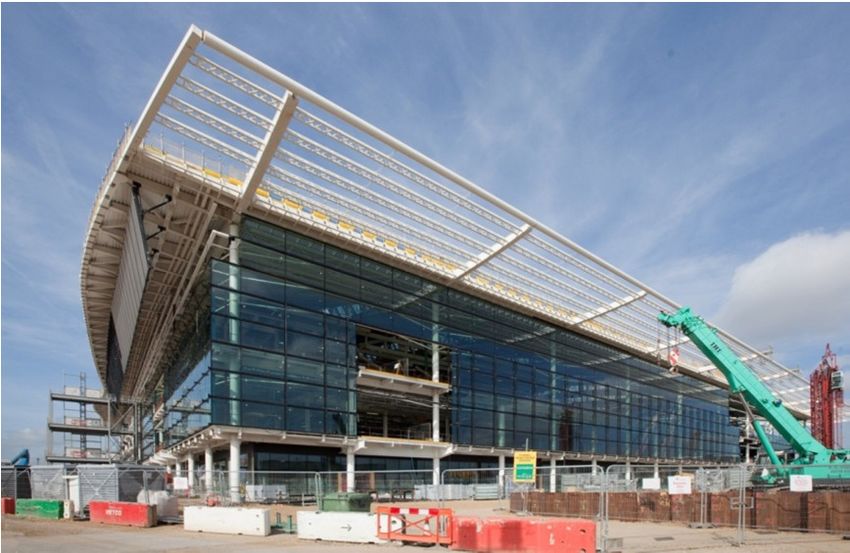
Strategy is to consolidate and develop Heathrow’s leading
position in UK, European and global aviation market

• Focused on developing Heathrow’s position as
   – world’s busiest international airport
   – Europe’s hub airport of choice
   – the UK’s gateway to the world

• Support and develop Heathrow’s role as a global hub by
   – investing in further capacity
   – lowering airline operating costs
   – improving passenger experience and service standards
   – upgrading rail links
   – enhancing operational flexibility and resilience

                                                            10
Recent significant business developments
Focus on service improvements has driven passenger
satisfaction towards top of European peer group
                             Overall passenger satisfaction for top 5 European airports
                   Q3 2008                                                                Q3 2009

                                                                                                    3.82
             4.0                                                            4.0

                                    3.69
             3.8                                                            3.8
 ASQ score

                                                                ASQ score
             3.6                                                            3.6

             3.4                                                            3.4

             3.2                                                            3.2

             3.0                                                            3.0
                                    LHR

                                                                                                    LHR
                   Q3 2010                                                                Q3 2011

                                                                                                    3.88
                                    3.84

             4.0                                                            4.0

             3.8                                                            3.8
 ASQ score

                                                                ASQ score
             3.6                                                            3.6

             3.4                                                            3.4

             3.2                                                            3.2

             3.0                                                            3.0
                                    LHR

                                                                                                    LHR
                                  See pages 27-28 for sources, notes and defined terms                     12
Transforming infrastructure to enhance competitive position

• Investing about £1 billion per annum
   – agreed in advance with airlines and regulator
   – capital expenditure added to RAB which then
     earns regulated revenues for BAA
• Terminal 5
   – opened in 2008
   – worldwide hub of British Airways                       Terminal 5 – 2011

   – up to 35 million passengers per annum
• Terminal 4 significantly refurbished
• New Terminal 2 under construction
   – >£2.2 billion cost and due to open in 2014
   – co-location of Star Alliance airlines
   – 20 million passengers per annum initially
• Major integrated baggage investment
                                                     Terminal 2 site – September 2011
                                                                                        13
Award winning retail operations outperforming the market

• Retail is second biggest income stream
• Amongst world’s most productive airport
  retail space
                                                                           Change in retail income per passenger versus prior year
• Main retail income source is concession

                                                                                                                                                                  14.4%
  fees based on percentage of sales                                16.0%

                                                                   12.0%

                                                                                                                                             9.1%
• Structural shift in retail income

                                                                                                                                                                          7.7%
                                                                                                                              6.9%

                                                                                                                                                           6.7%
                                                                    8.0%       Schiphol

                                                                                                                          4.2%
   – net retail income per passenger up 19%

                                                                                                                        3.0%

                                                                                                                                      2.5%

                                                                                                                                                    2.1%
                                                                                         1.7%
                                                                    4.0%

                                                                                        1.3%
     across 2 airports between 2008 and 2010
                                                                                                 Zurich
   – new leading edge retail facilities; more intra-                0.0%

                                                                                                        -0.2%
                                                                                                                        Frankfurt    Aeroport              Heathrow
     terminal transfer passengers                                  -4.0%                                                             de Paris

                                                                                                -5.3%
                                                                                -6.2%
• Part of regulatory single till with

                                                                                                                -6.7%
                                                                   -8.0%

  opportunities for outperformance
                                                                              2009 v 2008                          2010 v 2009           H1 2011 v H1 2010
• Long term success lowers tariffs,
  enhancing airport’s competitive position
• Regular winner of major global awards
                               See pages 27-28 for sources, notes and defined terms                                                                          14
Financial performance
Turnover and cost structure
                                                                            BAA London airports’ total revenue – 2010

                                                                                             5.4%
                                                                                   5.0%
                                                                                5.2%
• Turnover
                                                                          7.7%
   – aeronautical income charged to airlines
       • Heathrow tariff increasing by RPI + 7.5%                                                                             53.8%

   – retail income primarily from concessions                              23.0%
   – operational facilities and utilities charged
     to airlines and other airport users
                                                                 Aeronautical    Retail   Facilities/utilities   Property rental       Rail    Other

   – rail income from Heathrow Express                             BAA London airports’ total adjusted operating costs – 2010

• Operating costs                                                                      10.4%

                                                                                                                        28.5%
                                                                            10.6%
   – stable cost structure
       • up only 3.5% between 2008 and 2010
                                                                         12.2%
   – costs of increased security imposed by
     government can be passed onto airlines
                                                                                                                     21.1%
                                                                                   17.2%

                                                                   Employment costs         General expenses           Intra-group/other costs
                                                                   Maintenance costs        Rents and rates            Utility costs
                             See pages 27-28 for sources, notes and defined terms                                                             16
Record 2011 Heathrow traffic

• Record Heathrow traffic of 69.4m                                       Passenger traffic
  (previous record of 67.9m in 2007)
                                                                                 Year ended 31 December
• Reported performance partly reflects                                         2010 (m) 2011 (m) Change
  reversal of 2010 disruptions                           By airport
• Underlying performance                                 Heathrow                 65.7    69.4     5.5%
                                                         Stansted                 18.6    18.0    -2.8%
   – total: +0.4%
                                                         Total                   84.3    87.4     3.7%
   – Heathrow: +1.9%
   – Stansted: -5.0%                                     By market served

• Heathrow strength particularly in                      UK                        6.6     6.2    -6.3%
  European scheduled and North                           Europe                   42.8    44.5     4.0%
                                                         Long haul                35.0    36.8     5.2%
  Atlantic traffic
                                                         Total                   84.3    87.4     3.7%
• Record Stansted load factors
  suggest gradually more positive
  demand dynamics

                        See pages 27-28 for sources, notes and defined terms                       17
Strong financial performance through 2011

                                                Sep YTD                Sep YTD
(figures in £m)                                    2010                    2011        Change

Turnover                                          1,545.5                    1,703.3   +10.1%
                                                                                        10.2%

Adjusted operating costs                              826.5                   861.1     +4.2%
                                                                                         4.2%

Adjusted EBITDA                                       719.0                   842.2    +17.1%
                                                                                        17.1%

Consolidated senior net debt                      8,793.2                    9,326.0    +6.1%
                                                                                         6.1%

RAB (Regulatory Asset Base)                     12,776.0               13,633.4         +6.7%
                                                                                         6.7%

                      See pages 27-28 for sources, notes and defined terms                      18
Expected 2011 outturn and outlook for 2012

(figures in £m unless otherwise stated)                        2011                 2012   Change

Passengers (m)                                                 87.6                 88.1    +0.6%
                                                                                             0.6%

Turnover                                                    2,293                  2,516    +9.7%
                                                                                             9.7%

Adjusted EBITDA                                             1,128                  1,283   +13.7%
                                                                                            13.7%

Consolidated senior net debt                                9,368                  9,994    +6.7%
                                                                                             6.7%

Consolidated total net debt                               10,393                  11,619   +11.8%
                                                                                            11.8%

RAB (Regulatory Asset Base)                               13,783                  14,718    +6.8%
                                                                                             6.8%

                           See pages 27-28 for sources, notes and defined terms                     19
Financing structure
Overview of London airports’ debt financing

• Financing structure similar to other                         • Debt split into multiple tranches
  major regulated UK businesses in                                    – senior (Class A) – rated A-/A-
  the utilities sectors                                               – junior (Class B) – rated BBB/BBB
• Established debt capital markets          – subordinated (holding company) –
  financing platform across multiple          rated BB+/Ba3
  formats, rating levels and currencies • Bonds reclassified as ‘Corporate’
                                          from end 2011 by iBoxx/Markit
             BAA's London airports
             Consolidated net debt analysis at 30 September 2011

                                                                                           Holding
             (figures in £m)                               Class A       Class B                      Total
                                                                                          company
             Bonds                                        7,402.7         400.0            325.0     8,127.7

             Loan facilities                              1,704.5         625.0            175.0     2,504.5

             Inflation-linked derivative accretion         286.1           0.0              0.0       286.1

             Cash                                          (67.3)          0.0              (0.5)     (67.8)

             Total net debt                               9,326.0        1,025.0           499.5     10,850.5

                                   See pages 27-28 for sources, notes and defined terms                         21
Strong protections for senior bondholders
                                                                         BAA Limited
                                                 Ownership
                                                 structure of
• First ranking security                          the Group              Intermediate
                                                                          companies

   – mortgage over the airports and all their                             BAA (DSH)
     fixed assets                                                          Limited

   – share pledge over Group companies
                                                   Holdco debt           BAA (SH) plc
   – charge over receivables
• Operational and financial maintenance           Class A & B              BAA (SP)
                                                                            Limited
  covenants and distribution lock-ups                debt

   – leverage and interest cover                                BAA (AH)           BAA Funding
                                                                 Limited             Limited
   – maintenance of minimum BBB+ rating
   – restrictions on business activities,            Stansted(1)          Heathrow(2)

     acquisitions and disposals
• Regular information flow                                                 Heathrow
                                                                           Express(3)

• Significant liquidity enhancements            Notes
                                                (1) Stansted: Stansted Airport Limited
                                                (2) Heathrow: Heathrow Airport Limited
• Minimum hedging requirement                   (3) Heathrow Express: Heathrow Express Operating Company Limited

                                                                                                         22
Strong liquidity position

• Support from wide range of                                                BAA London airports’ term debt maturity profile
                                                                                            (2011-2021)
  credit investors                                                1,200

   – nearly £5 billion in fresh debt
                                                                  1,000
     financing raised since late 2009
• Liquidity forecast to allow group                                   800

  to meet all its obligations until early

                                                               (£m)
  2013 even without new financing                                     600

• Overall liquidity includes                                          400

   – operating cash flow
                                                                      200
   – £1.4 billion in cash and undrawn
     facilities                                                        -

                                                                              2011

                                                                                     2012

                                                                                            2013

                                                                                                   2014

                                                                                                          2015

                                                                                                                 2016

                                                                                                                        2017

                                                                                                                               2018

                                                                                                                                      2019

                                                                                                                                             2020

                                                                                                                                                    2021
   – £524 million liquidity facilities
                                                                            EIB loans                              Bonds (Class A)
                                                                            Bonds (Class B)                        Term loan facility (Class B)
                                                                            Subordinated loan facilities           Subordinated bonds

                             See pages 27-28 for sources, notes and defined terms                                                                      23
Stable financial ratios support capital investment programme
• Strong operating results and prudent financial policies supporting credit
  profile through Heathrow’s capital programme
   – financial ratios comfortably within covenanted trigger levels
   – balanced debt maturity profile – 45% of BAA (SP)’s debt matures after 2020
   – consistent A-/A- ratings since 2008
                                                FY 2009             FY 2010              FY 2011   FY 2012
    Interest cover
    Cash flow (£m)                                 737.7              671.9                777       929
    Senior interest paid (£m)                      455.5              322.6                295       342
    Senior Interest Cover Ratio                   1.62x               2.08x               2.63x     2.71x
    Ratio trigger level                            1.40x              1.40x               1.40x     1.40x
    Leverage
    Senior net debt (£m)                         7,919.6             8,793.2              9,368     9,994
    Regulatory Asset Base (£m)                   11,730.5           12,776.0             13,783    14,718
    Senior Regulatory Asset Ratio                 67.5%               68.8%              68.0%     67.9%
    Ratio trigger level                           70.0%               70.0%               70.0%     70.0%
    Senior debt headroom (£m)                     691.8               550.0                680       709
    Senior + junior debt headroom (£m)           1,391.9              938.4               1,323      891

                                  See pages 27-28 for sources, notes and defined terms                       24
Investment highlights

• Stability and resilience of world’s leading international hub airport
   – 8 of top 10 intercontinental long haul routes
   – number 1 airport globally for international passengers
• Resilient and growing cash flow post debt service underpinned
  by stable independent regulatory environment
   – regular tariff resets protect against revenue and cost volatility
• Strong security package available to senior creditors
• Continued improvement in operational performance
   – top ranked European hub on 23 out of 33 measures
• Capital investment to enhance competitive position

                                                                         26
Notes, sources and defined terms (1)

•   Page 4
       –     RAB: Regulatory Asset Base
       –     Adjusted EBITDA: earnings before interest, tax, depreciation and amortisation and exceptional items
•   Page 5
       –     Sources: relevant airport websites other than Haneda; data for Haneda from Airports Council International
       –     Annual traffic data for Haneda is for year ended 28 February 2011
       –     Number of top 10 intercontinental routes involving Heathrow sourced from OAG based on available seats on non stop flights over 2,800 nautical miles for week commencing 20 June 2011
       –     Proportion of UK scheduled long haul traffic derived from CAA data for year ended 31 December 2010
•   Page 6
       –     Proportion of passenger traffic from main airline alliance is for 2010 and at Heathrow is based on data from BAA, for Frankfurt is taken from page 75 of its ‘Air Traffic Statistics 2010’
             document, for Schiphol is taken from page 23 of its ‘Traffic Review 2010’ document, for Charles de Gaulle is taken from page 32 of Aéroports de Paris’ ‘2010 Registration Document’ and
             for Zurich is taken from page 46 of its ‘Analysts’ Presentation – 2010 Financial Results’ document
       –     Proportion of long haul traffic data taken or derived from data on relevant airport websites
•   Page 7
       –     Figures derived from traffic statistics taken from relevant airport websites
       –     For European airports decline is in respect of the period up to the disruption from volcanic ash in April 2010 by which time these airports had started growing traffic again
•   Page 9
       –     Forecast Adjusted EBITDA figures taken from Investor Reports issued in December 2008, 2009 and 2010
       –     Actual Adjusted EBITDA figure for 2011 is a forecast contained in Investor Report issued on 19 December 2011
       –     Adjusted EBITDA: earnings before interest, tax, depreciation and amortisation and exceptional items
       –     Figures for 2009 are in respect of continuing operations only (i.e. exclude Gatwick)
•   Page 12
       –     Source: Quarterly Airport Service Quality (‘ASQ’) surveys by Airports Council International. Peer group is Heathrow and next four largest European airports by passenger traffic volumes
•   Page 14
       –     Retail income includes income from in-terminal retail activities (including catering, bureaux de change, car rental and advertising) and car parking. Sources: BAA, derived from other
             airports’ press releases
•   Page 16
       –     Adjusted operating costs exclude depreciation, amortisation and exceptional items

                                                                                                                                                                                                27
Notes, sources and defined terms (2)

•   Page 17
       –   Totals and percentage change calculated using un-rounded passenger numbers
       –   European traffic includes North African charter traffic
•   Page 18 and 19
       –   Adjusted operating costs exclude depreciation, amortisation and exceptional items
       –   Adjusted EBITDA: earnings before interest, tax, depreciation and amortisation and exceptional items
       –   Consolidated net debt is calculated on a nominal basis excluding intra-BAA group loans and including inflation-linked accretion
       –   On page 18, percentage changes are relative to same period of 2010 except for net debt and RAB which are relative to 31 December 2010
       –   On page 19, figures taken from Investor Report issued on 19 December 2011
•   Page 21
       –   Net debt is calculated on a nominal basis excluding intra-BAA group loans and including inflation-linked accretion
•   Page 23
       –   Debt maturity profile is as at 30 September 2011 but adjusted for £50 million BAA (SH) plc loan completed in December 2011 and CHF400 million bond completed in January 2012.
           Excludes revolving capital expenditure facility
•   Page 24
       –   Interest cover ratio is the ratio of net cash flow to interest paid
       –   Net cash flow is cash flow from operations (excluding items of a one-off, non-recurring, extraordinary or exceptional nature) less 2% of the closing Regulatory Asset Base for the period less
           any tax paid to HMRC
       –   Gearing ratio is the ratio of nominal net debt (including inflation-linked accretion) to RAB
       –   Senior debt headroom takes into account ability to utilise undrawn £400 million junior tranche of capital expenditure facility
       –   Figures for FY 2011 and FY 2012 are forecasts taken from Investor Report issued on 19 December 2011

                                                                                                                                                                                              28
Disclaimer

 •This material contains certain tables and other statistical analyses (the “Statistical Information”) which have been prepared in
 reliance on publicly available information and may be subject to rounding. Numerous assumptions were used in preparing the
 Statistical Information, which may or may not be reflected herein. Actual events may differ from those assumed and changes to
 any assumptions may have a material impact on the position or results shown by the Statistical Information. As such, no
 assurance can be given as to the Statistical Information’s accuracy, appropriateness or completeness in any particular context;
 nor as to whether the Statistical Information and/or the assumptions upon which it is based reflect present market conditions or
 future market performance. The Statistical Information should not be construed as either projections or predictions nor should
 any information herein be relied upon as legal, tax, financial or accounting advice. BAA does not make any representation or
 warranty as to the accuracy or completeness of the Statistical Information.
 •These materials contain statements that are not purely historical in nature, but are “forward-looking statements”. These include,
 among other things, projections, forecasts, estimates of income, yield and return, and future performance targets. These
 forward-looking statements are based upon certain assumptions, not all of which are stated. Future events are difficult to predict
 and are beyond BAA’s control. Actual future events may differ from those assumed. All forward-looking statements are based on
 information available on the date hereof and neither BAA nor any of its affiliates or advisers assumes any duty to update any
 forward-looking statements. Accordingly, there can be no assurance that estimated returns or projections will be realised, that
 forward-looking statements will materialise or that actual returns or results will not be materially lower that those presented.
 •This material should not be construed as an offer or solicitation to buy or sell any securities, or any interest in any securities,
 and nothing herein should be construed as a recommendation or advice to invest in any securities.
 •This document may have been sent to you in electronic form. You are reminded that documents transmitted via this medium
 may be altered or changed during the process of electronic transmission and consequently neither BAA nor any person who
 controls it (nor any director, officer, employee not agent of it or affiliate or adviser of such person) accepts any liability or
 responsibility whatsoever in respect of the difference between the document sent to you in electronic format and the hard copy
 version available to you upon request from BAA.
 •Any reference to “BAA” will include any of its affiliated associated companies and their respective directors, representatives or
 employees and/or any persons connected with them.
You can also read