Second Quarter 2021 Earnings Presentation - August 5, 2021

Page created by Jon Carr
 
CONTINUE READING
Second Quarter 2021 Earnings Presentation - August 5, 2021
Second Quarter 2021
Earnings
Presentation

August 5, 2021

                      © 2021 Laureate Education, Inc.   1
Second Quarter 2021 Earnings Presentation - August 5, 2021
Forward Looking Statements
This presentation includes statements that express Laureate’s opinions, expectations, beliefs, plans, objectives, assumptions or projections regarding future events or
future results and therefore are, or may be deemed to be, ‘‘forward-looking statements’’ within the meaning of the federal securities laws, which involve risks and
uncertainties. Laureate’s actual results may vary significantly from the results anticipated in these forward-looking statements. You can identify forward-looking
statements because they contain words such as ‘‘believes,’’ ‘‘expects,’’ ‘‘may,’’ ‘‘will,’’ ‘‘should,’’ ‘‘seeks,’’ ‘‘approximately,’’ ‘‘intends,’’ ‘‘plans,’’ ‘‘estimates’’ or
‘‘anticipates’’ or similar expressions that concern our strategy, plans or intentions. All statements we make relating to (i) guidance (including, but not limited to, total
enrollments, revenues and Adjusted EBITDA), (ii) our planned divestitures, the expected proceeds generated therefrom and the expected reduction in revenue
resulting therefrom, (iii) our exploration of strategic alternatives and potential future plans, strategies or transactions that may be identified, explored or implemented as
a result of such review process and any resulting litigation or dispute therewith, (iv) anticipated share purchases and (v) the potential impact of the COVID-19
pandemic on our business or the global economy as a whole are forward-looking statements. In addition, we, through our senior management, from time to time make
forward-looking public statements concerning our expected future operations and performance and other developments. All of these forward-looking statements are
subject to risks and uncertainties that may change at any time, including, with respect to our exploration of strategic alternatives, risks and uncertainties as to the
terms, timing, structure, benefits and costs of any divestiture or separation transaction and whether one will be consummated at all, and the impact of any divestiture or
separation transaction on our remaining businesses. Accordingly, our actual results may differ materially from those we expected. We derive most of our forward-
looking statements from our operating budgets and forecasts, which are based upon many detailed assumptions. While we believe that our assumptions are
reasonable, we caution that it is very difficult to predict the impact of known factors, and, of course, it is impossible for us to anticipate all factors that could affect our
actual results. Important factors that could cause actual results to differ materially from our expectations are disclosed in our Annual Report on Form 10-K filed with the
U.S. Securities and Exchange Commission (the “SEC”) on February 25, 2021, our Quarterly Reports on Form 10-Q filed and to be filed with the SEC and other filings
made with the SEC. These forward-looking statements speak only as of the time of this release and we do not undertake to publicly update or revise them, whether as
a result of new information, future events or otherwise, except as required by law.

In addition, this presentation contains various operating data, including market share and market position, that are based on internal company data and management
estimates. While management believes that our internal company research is reliable and the definitions of our markets which are used herein are appropriate, neither
such research nor these definitions have been verified by an independent source and there are inherent challenges and limitations involved in compiling data across
various geographies and from various sources, including those discussed under “Industry and Market Data” in Laureate’s filings with the SEC.

                                                                                                                                                     © 2021 Laureate Education, Inc.   2
Second Quarter 2021 Earnings Presentation - August 5, 2021
Presentation of Non-GAAP Measures
In addition to the results provided in accordance with U.S. generally accepted accounting principles (GAAP) throughout this presentation, Laureate provides the non-
GAAP measurements of Adjusted EBITDA, Adjusted EBITDA margin, total cash, net of debt (or net cash), and Free Cash Flow. We have included these non-GAAP
measurements because they are key measures used by our management and board of directors to understand and evaluate our core operating performance and
trends, to prepare and approve our annual budget and to develop short- and long-term operational plans.

Adjusted EBITDA consists of income (loss) from continuing operations, adjusted for the items included in the accompanying reconciliation. The exclusion of certain
expenses in calculating Adjusted EBITDA can provide a useful measure for period-to-period comparisons of our core business. Additionally, Adjusted EBITDA is a key
input into the formula used by the compensation committee of our board of directors and our Chief Executive Officer in connection with the payment of incentive
compensation to our executive officers and other members of our management team. Accordingly, we believe that Adjusted EBITDA and Adjusted EBITDA margin,
which is calculated by dividing Adjusted EBITDA by revenues, provide useful information to investors and others in understanding and evaluating our operating results
in the same manner as our management and board of directors.

Total cash, net of debt (or net cash) consists of total gross debt, including seller notes, for Continuing Operations and Discontinued Operations, less total cash and
cash equivalents for Continuing Operations and Discontinued Operations. Net debt provides a useful indicator about Laureate’s leverage and liquidity.

Free Cash Flow consists of operating cash flow minus capital expenditures. Free Cash Flow provides a useful indicator about Laureate’s ability to fund its operations
and repay its debts.

Laureate’s calculations of Adjusted EBITDA, Adjusted EBITDA margin, total debt, net of cash (or net debt), and Free Cash Flow are not necessarily comparable to
calculations performed by other companies and reported as similarly titled measures. These non-GAAP measures should be considered in addition to results prepared
in accordance with GAAP, but should not be considered a substitute for or superior to GAAP results. Adjusted EBITDA is reconciled from the GAAP measure in the
attached table “Non-GAAP Reconciliation.”

We evaluate our results of operations on both an as reported and an organic constant currency basis. The organic constant currency presentation, which is a non-
GAAP measure, excludes the impact of fluctuations in foreign currency exchange rates, acquisitions and divestitures, and other items. We believe that providing
organic constant currency information provides valuable supplemental information regarding our results of operations, consistent with how we evaluate our
performance. We calculate organic constant currency amounts using the change from prior-period average foreign exchange rates to current-period average foreign
exchange rates, as applied to local-currency operating results for the current period, and then exclude the impact of acquisitions and divestitures and other items
described in the accompanying presentation.

                                                                                                                                        © 2021 Laureate Education, Inc.   3
Second Quarter 2021 Earnings Presentation - August 5, 2021
SUMMARY
OVERVIEW

Note: Throughout this presentation amounts may not sum to totals due to rounding
      Amounts presented for enrollments, Revenue, Adjusted EBITDA and Adjusted EBITDA margin are for continuing operations only   © 2021 Laureate Education, Inc.   4
Second Quarter 2021 Earnings Presentation - August 5, 2021
Executive Summary

 Continued strong operating trends …. despite COVID-19 headwinds

 Enrollment volume above pre-pandemic levels1

 Adjusted EBITDA ahead of expectations for the second quarter

 Increasing full-year 2021 guidance on strength of first half results

 Net Loss of $29M in Q2 driven by one-time charges on debt repayment

 Brazil sale closed in May and 8.25% Bonds fully repaid…… Net Cash position of $354M as of June 30th

 Additional $1.3 billion of net proceeds from signed asset sales expected during Q3 20212

                 Continued Strong Execution Against all Operating & Strategic Priorities

 (1)   Total enrollment as of June 30, 2021 as compared to total enrollment as of June 30, 2019.
 (2)   Based on anticipated net proceeds for sale of Walden and net of fees, taxes and other costs associated with Walden and prior asset sales. Includes assumed debt
       and anticipated release of restricted cash (collateral for letter of credit and bonds at Walden); assumes Walden sale transaction closes on announced terms.
                                                                                                                                                                         © 2021 Laureate Education, Inc.   5
Second Quarter 2021 Earnings Presentation - August 5, 2021
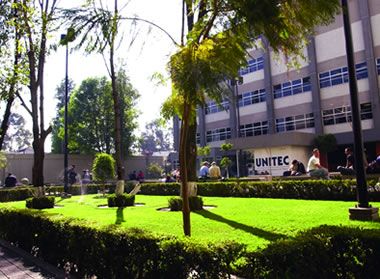
Laureate Portfolio Overview

                   Operations -- Remaining                                                                                  Operations -- Pending Asset Sales
                                                                                                                                                         (as of June 30, 2021)

                         Mexico                                                                                                                Walden
                              2 Universities
                              35+ campuses
                              170K students

                          Peru
                              2 Universities / 1 Tech-Voc
                              15+ campuses
                              180K students

        $1.1 billion                                $280 million
                   Revenue1                              Adjusted EBITDA1                                                                    $1.3 billion
                                                                                                                                                   of Net Proceeds
                                                                                                                                                      Expected2

(1)   Based on 2022 outlook previously provided. An outlook for 2022 net income and reconciliation of the forward-looking 2022 Adjusted EBITDA outlook to projected net
      income is not being provided as the company does not currently have sufficient data to accurately estimate the variables and individual adjustments for such outlook
      and reconciliation. Due to this uncertainty, the company cannot reconcile Adjusted EBITDA to projected net income without unreasonable effort.
(2)   Based on anticipated net proceeds for sale of Walden and net of fees, taxes and other costs associated with Walden and prior asset sales. Includes assumed debt        © 2021 Laureate Education, Inc.   6
      and anticipated release of restricted cash (collateral for letter of credit and bonds at Walden); assumes Walden sale transaction closes on announced terms.
Second Quarter 2021 Earnings Presentation - August 5, 2021
Mexico & Peru Higher Education Market Overview

                                                                                 Mexico                                            Peru                                     Combined

  Population (M)                                                                 127M                                             33M                                          160M

  Higher Education Students
                                                                                 4,562                                          1,896                                          6,458
  (000s)

  Higher Education
                                                                                   30%                                            47%                                            34%
  Participation Rate1

  Market Share for
                                                                                   44%                                            72%                                            56%
  Private Institution2

 Sources: UNESCO, World Bank, SEP database

 (1)   Defined as total enrollments as compared to 18-24 year old population
 (2)   Private institution market share in higher education; for Mexico and Combined includes all states in which UVM or UNITEC have operations (total private market share for all of Mexico is 35%); for Peru based on total country

                       Attractive Markets with Significant Growth Opportunities
                 Participation Rates Growing and Still Well Below Developed Markets
                                                                                                                                                                                    © 2021 Laureate Education, Inc.               7
Leading University Portfolio in Mexico & Peru

                                                                                                     QS Stars™
                                                                                                      Overall
                                                                                                     University
                                              Institution                           Market Segment    Rating       Ratings/Ranking
                                                                                                                  • Ranked #7 university in Mexico
                                Universidad del Valle de                             Premium/                     • One of only three 4-Star rated
 Mexico                                                                                                             universities in Mexico by QS
                                     México (UVM)                                    Traditional
                                                                                                                    Stars™

                                                                                                                  • Largest private university in
                                                                                                                    Mexico
                            Universidad Tecnológica de                                 Value/
 Mexico                                                                                                           • 5-Stars rated by QS Stars™ in
                                 México (UNITEC)                                      Teaching                      categories of Teaching &
                                                                                                                    Employability

                                                                                                                  • Ranked #3 university in Peru
                               Universidad Peruana de                                Premium/
 Peru                                                                                                             • Only 4-Star rated university in
                              Ciencias Aplicadas (UPC)                               Traditional                    Peru by QS Stars™

                                                                                                                  • 2nd largest private university in
                                                                                       Value/                       Peru
                                Universidad Privada del
 Peru                                                                                 Teaching                    • 5-Stars rated by QS Stars™ in
                                     Norte (UPN)                                                                    categories of Teaching &
                                                                                                                    Employability

                                                                                                                  • 2nd largest private tech/voc
 Peru                                       CIBERTEC                                  Tech/Voc         N/A          institute in Peru

Sources: QS Stars™, Guía Universitaria (UVM), Scimago Institutions Rankings (UPC)

                    Operating Leading Brands in Multiple Attractive Market Segments
                                                                                                                       © 2021 Laureate Education, Inc.   8
Q2 & YTD 2021
PERFORMANCE RESULTS
CONTINUING OPERATIONS ONLY (I.E. MEXICO, PERU AND CORPORATE SEGMENTS)

                                                       © 2021 Laureate Education, Inc.   9
2021 Second Quarter – Financial Summary

                                                         Q2 ’21                               Variance Vs. Q2 ‘20                                             Notes
($ in millions)
(Enrollments in thousands)                             Results                       As Reported Organic/CC1

New Enrollment                                               20K                                n.m.                            n.m.

Total Enrollment                                           349K                                  9%                               9%                       • Improved retention rates

                                                                                                                                                           • Driven by enrollment volume and
Revenue                                                    $328                                  8%                               9%                         improved retention in Peru

Adj. EBITDA                                                $107                                 14%                              25%                       • Y-o-Y improvement driven by Peru

Adj. EBITDA margin                                        32.7%                            173 bps                          463 bps

                               Strong Operating Performance During the Second Quarter

(1)   Organic Constant Currency (CC) Operations excludes the period-over-period impact from currency fluctuations (if applicable), acquisitions and divestitures, and other
      items. Other items include the impact of acquisition-related contingent liabilities for taxes other-than-income tax, net of changes in recorded indemnification assets.
                                                                                                                                                                                © 2021 Laureate Education, Inc.   10
2021 Q2 YTD – Financial Summary

                                                      Q2 YTD ’21                           Variance Vs. Q2 YTD ‘20                                               Notes
   ($ in millions)
   (Enrollments in thousands)                             Results                       As Reported Organic/CC1

  New Enrollment                                                94K                                13%                              13%                       • Strong cycle one intake for Peru

                                                                                                                                                              • Improved retention rates, +10pts
  Total Enrollment                                            349K                                  9%                               9%                         versus PY (which was impacted by
                                                                                                                                                                COVID-19)

                                                                                                                                                              • Driven by enrollment volume and
                                                                                                                                                                improved retention in Peru, partially
  Revenue                                                     $522                                  5%                               7%                         offset by higher discounts in Mexico
                                                                                                                                                              • +4% timing adjusted

                                                                                                                                                              • Y-o-Y improvement driven by Peru
  Adj. EBITDA                                                 $117                                 81%                            107%                          and corporate G&A efficiencies
                                                                                                                                                              • +83% timing adjusted

  Adj. EBITDA margin                                         22.4%                            932 bps                         1194 bps

Note: Timing adjusted impacts noted are pro-forma for UPN-Peru semester start, which, in 2020, was moved to April 6th due to COVID, and 1-week earlier start of classes at Cibertec

                   Strong Operating Performance in Peru and Corporate G&A Efficiency
                                     Driving Increased Profitability
   (1)   Organic Constant Currency (CC) Operations excludes the period-over-period impact from currency fluctuations (if applicable), acquisitions and divestitures, and other
         items. Other items include the impact of acquisition-related contingent liabilities for taxes other-than-income tax, net of changes in recorded indemnification assets.
                                                                                                                                                                                      © 2021 Laureate Education, Inc.   11
SEGMENT RESULTS
CONTINUING OPERATIONS ONLY (I.E. MEXICO, PERU AND CORPORATE SEGMENTS)

                                                       © 2021 Laureate Education, Inc.   12
Mexico Segment Results

                                                         Q2 Results                                             Q2 YTD Results                                            Notes
  ($ in millions)                                                   Organic/CC                           Q2 YTD                  Organic/CC
  (Enrollments in thousands)                      Q2 ’21
                                                                    Vs. Q2 ’20 (1)                         ’21                 Vs. Q2 YTD ’20 (1)

                                                                                                                                                                        • +11% NE through June,
 New Enrollment                                     18K                    47%                              45K                            11%                            large intake occurs in Sept.

                                                                                                                                                                        • Driven by COVID-related
 Total Enrollment                                  170K                      1%                           170K                              1%                            decline in 2020 intakes

                                                                                                                                                                        • Impacted by higher discounts
 Revenue                                           $124                    (7%)                            $260                            (9%)                           and mix shift

 Adj. EBITDA                                        $17                   (21%)                             $35                           (11%)                         • Impacted by higher discounts

 Adj. EBITDA
                                                 13.8%               (258 bps)                           13.3%                         (6 bps)
 margin

                           Higher Enrollment Trends Offset by Discounts & Mix Shift
                               Mexico’s Primary Intake Will Occur in September
(1)   Organic Constant Currency (CC) Operations excludes the period-over-period impact from currency fluctuations (if applicable), acquisitions and divestitures, and other
      items. Other items include the impact of acquisition-related contingent liabilities for taxes other-than-income tax, net of changes in recorded indemnification assets.
                                                                                                                                                                                  © 2021 Laureate Education, Inc.   13
Peru Segment Results

                                                         Q2 Results                                             Q2 YTD Results                                            Notes
  ($ in millions)                                                   Organic/CC                           Q2 YTD                  Organic/CC
  (Enrollments in thousands)                      Q2 ’21
                                                                    Vs. Q2 ’20 (1)                         ’21                 Vs. Q2 YTD ’20 (1)

 New Enrollment                                       2K                   n.m.                             49K                            14%                          • Strong cycle one intake

                                                                                                                                                                        • Driven by higher NE volumes
 Total Enrollment                                  180K                    18%                            180K                             18%                            and improved retention rates

                                                                                                                                                                        • Volume growth and positive
 Revenue                                           $202                    19%                             $259                            27%                            mix impact
                                                                                                                                                                        • YTD +19% timing adjusted

                                                                                                                                                                        • Revenue growth and cost
 Adj. EBITDA                                       $114                    27%                             $125                            91%                            efficiencies
                                                                                                                                                                        • YTD +69% timing adjusted

 Adj. EBITDA
                                                 56.3%                351 bps                            48.3%                       1591 bps
 margin

          Strong Primary Intake & Improved Retention Driving Favorable Results

(1)   Organic Constant Currency (CC) Operations excludes the period-over-period impact from currency fluctuations (if applicable), acquisitions and divestitures, and other
      items. Other items include the impact of acquisition-related contingent liabilities for taxes other-than-income tax, net of changes in recorded indemnification assets.
                                                                                                                                                                                  © 2021 Laureate Education, Inc.   14
Q2 Capitalization – Adjusted for Pending Asset Sales

‒ $1.65Bn net cash position expected despite $316M of share repurchases1 (out of $500M
      program authorization)

 ($ in millions)                                                                                          Amount                               Comments

Net Cash Position @ 6/30/21                                                                                $354                              See Appendix

Net Proceeds – Pending Asset Sales2                                                                      $1,300                              Including assumed debt

                                                                                                                                             Post receipt of anticipated net
Adjusted Net Cash Position @ 6/30/21                                                                     $1,654
                                                                                                                                             cash proceeds & assumed debt

                                         Pro-Forma Net Cash Position of $1.65Bn
                                 Total of 188 Million Shares Outstanding as of June 30th

(1)   As of June 30, 2021
(2)   Based on anticipated net proceeds for sale of Walden and net of fees, taxes and other costs associated with Walden and prior asset sales. Includes assumed debt
      and anticipated release of restricted cash (collateral for letter of credit and bonds at Walden); assumes Walden sale transaction closes on announced terms.
                                                                                                                                                                        © 2021 Laureate Education, Inc.   15
OUTLOOK

          © 2021 Laureate Education, Inc.   16
FY 2021 Guidance Update

                            ($ in millions)                                                               Previous                                                        Current
                            (Enrollments in thousands)
                                                                                                          Guidance                                                       Outlook (1)

                      Total Enrollment                                                                         337K                                                           350K

                      Revenue                                                                      $1,000 - $1,040                                                 $1,025 - $1,065

                      Adjusted EBITDA                                                                  $180 - $190                                                     $205 - $215

                      (1)   Based on actual FX rates for January through July 2021, and current spot FX rates (local currency per US dollar) of MXN 19.89 & PEN 3.96
                            for August through December 2021. FX impact may change based on fluctuations in currency rates in future periods.

                            Increasing Full Year 2021 on Strength of First Half Performance

Note: An outlook for 2021 net income and reconciliation of the forward-looking 2021 Adjusted EBITDA outlook to projected net income is not being provided as the company
does not currently have sufficient data to accurately estimate the variables and individual adjustments for such outlook and reconciliation. Due to this uncertainty, the company    © 2021 Laureate Education, Inc.   17
cannot reconcile Adjusted EBITDA to projected net income without unreasonable effort.
Q3 2021 Guidance Details

  (USD millions)                                                                                                                    Revenues                                        Adj. EBITDA

  2020 Q3 Results                                                                                                                         $244                                          $50

  Organic Growth                                                                                                                      ($4) – $16                                     ($15) – ($5)

               Growth %                                                                                                                (2%) - 7%                                    (30%) – (10%)

  2021 Q3 Guidance (Constant Currency)                                                                                           $240 – $260                                         $35 – $45

  FX Impact (spot FX) (1)                                                                                                                  ($5)                                          ($5)

  2021 Q3 Guidance (@ spot FX) (1)                                                                                               $235 – $255                                         $30 – $40

                                                                                                                                     Unfavorably impacted by timing of academic
                                                                                                                                     calendar; favorable offset was already
                                                                                                                                     captured in 1H Results

                                         Third Quarter Impacted by Timing of Academic Calendar
(1)   Based on actual FX rates for July 2021, and current spot FX rates (local currency per US dollar) of MXN 19.89 & PEN 3.96 for August through September 2021.
      FX impact may change based on fluctuations in currency rates in future periods.
Note: An outlook for 2021 net income and reconciliation of the forward-looking 2021 Adjusted EBITDA outlook to projected net income is not being provided as the company
does not currently have sufficient data to accurately estimate the variables and individual adjustments for such outlook and reconciliation. Due to this uncertainty, the company     © 2021 Laureate Education, Inc.   18
cannot reconcile Adjusted EBITDA to projected net income without unreasonable effort.
APPENDIX

           © 2021 Laureate Education, Inc.   19
Academic Calendar Timing Impacts - Peru

• $18M in revenue timing shift from Q1 to 2H due to delayed class start in 2020
    – Majority of benefit recognized in Q1 2021; offset in Q3/Q4

                                                      Week Of

                  2/22        3/1        3/8        3/15      3/22      3/29          4/5            4/12

   UPC

                                                                                            Delayed start in
   UPN                                                                                      2020 due to COVID

   Cibertec

                         2021 semester start date          2020 semester start date

  COVID-Related Changes in Academic Calendar in Peru Impacting YoY Comparability
   Classes Started Late in 2020 Due to COVID -- Back to Normal Cycle Timing in 2021

                                                                                      © 2021 Laureate Education, Inc.   20
2021 Second Quarter – Net Income Reconciliation
                           Q2 ’21    B / (W) Vs. Q2 ’20    Notes
 ($ in millions)          Reported     $          %

Adjusted EBITDA             107       13         14%      • Strong performance in Peru

                                                          • Primarily related to amortization of
Depreciation & Amort.       (27)      (9)        (49%)      tradename (moved to finite life asset)

Interest Expense, net       (13)      12         49%

Impairments                 (7)       17         n.m.

                                                          • Call premium and deferred financing cost on
Other                      (163)     (133)       n.m.       repayment of Bonds & Loss on Derivatives

Income Tax                  (13)      (5)        n.m.

Income/(Loss) From
                           (116)     (104)       n.m.
Continuing Operations
Discontinued
                            87        387        n.m.
Operations (Net of Tax)

Net Income / (Loss)         (29)      282        n.m.

    Income from Continuing Operations Impacted by Loss on Extinguishment of Debt
                      Related to Repayment of the 8.25% Bonds
                                                                             © 2021 Laureate Education, Inc.   21
2021 Q2 YTD – Net Income Reconciliation
                          Q2 YTD ’21   B / (W) Vs. Q2 YTD ’20    Notes
 ($ in millions)          Reported         $          %

Adjusted EBITDA              117           52        81%        • Strong performance in Peru

                                                                • Primarily related to amortization of
Depreciation & Amort.        (50)         (12)      (31%)         tradename (moved to finite life asset)

Interest Expense, net        (36)          14        28%

                                                                • Impairment of Laureate tradename due to
Impairments                  (64)         (36)       n.m.         deemphasis of Laureate Network
                                                                • Call premium and deferred financing cost on
Other                       (122)        (146)       n.m.         repayment of Bonds & Loss on Derivatives
                                                                • YoY variance largely due to discrete tax
Income Tax                  (126)        (347)       n.m.         items in 2020
Income/(Loss) From
                            (280)        (475)       n.m.
Continuing Operations
Discontinued
                             86           494        n.m.
Operations (Net of Tax)

Net Income / (Loss)         (194)          19        n.m.

    Income from Continuing Operations Impacted by Loss on Extinguishment of Debt
                      Related to Repayment of the 8.25% Bonds
                                                                                   © 2021 Laureate Education, Inc.   22
Capitalization at 6/30/21

     ($ in millions)
                                         Continuing   Discontinued     Total
                                         Operations    Operations    Company

    Revolver                                $-           $-           $-

    Sr. Notes                                -            -            -

    Local Debt / Seller Notes              $179           -          $179

    Gross Debt                             $179           -          $179

    Cash                                  ($427)        ($105)       ($532)

    Net Debt / (Cash)                     ($248)        ($105)       ($354)

                        Net Cash Position of $354M as of June 30th

                                                                      © 2021 Laureate Education, Inc.   23
2021 Full Year Guidance Details

                 (USD millions, except enrollments in thousands)                                       Total Enrollment                                     Revenues                         Adj. EBITDA

  2020 Results                                                                                                     337K                                         $1,025                             $206

  Organic Growth                                                                                                     13K                                      $25 – $65                         $27 – $37

               Growth %                                                                                               4%                                         2% - 6%                         13% – 18%

  FAS 5 Expense/Indemnification Asset (non-cash)                                                                        -                                              -                            ($8)

  2021 Guidance (Constant Currency)                                                                                350K                               $1,050 – $1,090                        $225 – $235

  FX Impact (spot FX) (1)                                                                                               -                                         ($25)                             ($20)

  2021 Guidance (@ spot FX) (1)                                                                                    350K                               $1,025 – $1,065                        $205 – $215

               Growth %                                                                                               4%                                        0% – 4%                           0% – 4%

                                   Strong Operating Trends Partially Offset by Weaker FX Rates

(1)   Based on actual FX rates for January through July 2021, and current spot FX rates (local currency per US dollar) of MXN 19.89 & PEN 3.96 for August through December 2021.
      FX impact may change based on fluctuations in currency rates in future periods.

Note: An outlook for 2021 net income and reconciliation of the forward-looking 2021 Adjusted EBITDA outlook to projected net income is not being provided as the company
does not currently have sufficient data to accurately estimate the variables and individual adjustments for such outlook and reconciliation. Due to this uncertainty, the company   © 2021 Laureate Education, Inc.   24
cannot reconcile Adjusted EBITDA to projected net income without unreasonable effort.
Intra-Year Seasonality Trends
• Large intake cycles at end of Q1 (Peru) and end of Q3 (Mexico) drive seasonality of earnings
• Q2 and Q4 are typically Laureate’s strongest earnings quarters

                    Revenue Seasonality                                             Adjusted EBITDA Seasonality

                   30% 31% 30%
                                                     28% 29% 28%                        56%
                                                                                                                              61%
                                                                                              47% 46%                               49%
                                       24% 23% 24%                                                                                        44%

   18% 17% 19%                                                                                                        24%
                                                                                                                15%
                                                                                                          8%

                                                                            Q1                Q2                 Q3                  Q4
                                                                            -11% -14%
                                                                    -24%
       Q1                 Q2               Q3             Q4

                   2018        2019     2020                                             2018      2019        2020

               New Enrollments Seasonality                                          Factors Affecting Seasonality

                                                                       Main intake cycles:
                                       50% 51% 48%

   39% 39%                                                              –    Q1 - Peru

             28%                                                        –    Q3 - Mexico
                               22%

                   10%
                                                                       Academic calendar
                          9%
                                                     1%   1%   2%
                                                                       FX trends
       Q1                 Q2               Q3             Q4

                    2018        2019     2020
                                                                                                               © 2021 Laureate Education, Inc.   25
Financial Results
    & Tables

                    © 2021 Laureate Education, Inc.   26
Financial Tables
     Consolidated Statements of Operations

                                                                                          For the three months ended June 30,               For the six months ended June 30,
    IN MILLIONS                                                                            2021               2020         Change           2021              2020          Change
    Revenues                                                                          $       327.6       $      303.9   $     23.7     $      522.3    $        496.2    $     26.1
    Costs and expenses:
      Direct costs                                                                              213.3           207.8            5.5          395.2              428.4             (33.2)
      General and administrative expenses                                                        49.4            43.1            6.3           92.0               88.2               3.8
      Loss on impairment of assets                                                                7.2            23.8          (16.6)          63.9               27.5              36.4
    Operating income (loss)                                                                      57.7            29.1           28.6          (28.7)             (47.9)             19.2
    Interest income                                                                               0.5             0.3            0.2            1.2                0.9               0.3
    Interest expense                                                                            (13.5)          (25.7)          12.2          (37.1)             (51.0)             13.9
    Loss on debt extinguishment                                                                 (77.9)             —           (77.9)         (77.9)                —              (77.9)
    Loss on derivatives                                                                         (53.8)           (1.4)         (52.4)         (24.5)              (0.6)            (23.9)
    Other expense, net                                                                           (0.1)           (0.4)           0.3             —                (0.5)              0.5
    Foreign currency exchange (loss) gain, net                                                  (15.5)           (4.7)         (10.8)          12.7               74.0             (61.3)
    Loss on disposal of subsidiaries, net                                                          —               —              —              —                (1.8)              1.8
    Loss from continuing operations before income taxes and
    equity in net income of affiliates                                                          (102.7)           (2.8)        (99.9)         (154.4)            (27.0)           (127.4)
    Income tax (expense) benefit                                                                 (13.2)           (8.7)         (4.5)         (126.0)            221.3            (347.3)
    Equity in net income of affiliates, net of tax                                                  —               —             —               —                0.2              (0.2)
    (Loss) income from continuing operations                                                    (115.9)          (11.6)       (104.3)         (280.4)            194.5            (474.9)
    Income (loss) from discontinued operations, net of tax                                        86.7          (300.1)        386.8            86.2            (407.8)            494.0
    Net loss                                                                                     (29.2)         (311.6)        282.4          (194.2)           (213.3)             19.1
    Net loss attributable to noncontrolling interests                                              0.2             3.8          (3.6)            0.2               5.1              (4.9)
    Net loss attributable to Laureate Education, Inc.                                 $          (29.0) $       (307.8) $      278.8 $        (193.9) $         (208.2) $           14.3
    Accretion of redeemable noncontrolling interests and equity                                   (0.1)            0.2          (0.3)           (0.1)               0.2             (0.3)
    Net loss available to common stockholders                                         $          (29.1) $       (307.6) $     278.5     $     (194.0) $         (208.1) $           14.1
   Basic and diluted earnings (loss) per share:
   Basic weighted average shares outstanding                                                    192.0           209.9         (17.9)           196.1             209.9            (13.8)
   Diluted weighted average shares outstanding                                                  192.0           209.9         (17.9)           196.1             210.1            (14.0)
   Basic and diluted loss per share                                                  $          (0.15) $        (1.46) $       1.31     $      (0.99) $          (0.99) $            —
Note: Dollars in millions, except per share amounts, and may not sum to total due to rounding                                                               © 2021 Laureate Education, Inc.   27
Financial Tables
       Revenue and Adjusted EBITDA by segment: Quarter

  IN MILLIONS
                                                                                            % Change                             $ Variance Components
                                                                                                  Organic                      Organic
  For the three months ended                                                                      Constant                     Constant
  June 30,                                          2021              2020         Reported      Currency(1)       Total       Currency       Other      Acq/Div.        FX
  Revenues
  Mexico                                       $       124.3      $     114.9        8%             (7)%       $      9.4 $         (8.0) $      — $             — $      17.4
  Peru                                                 201.7            187.6        8%             19%              14.1           35.6         —               —       (21.5)
  Corporate & Eliminations                                 1.6               1.4     14%            14%               0.2            0.2         —               —          —
  Total Revenues                               $       327.6      $     303.9        8%                9%      $     23.7 $         27.8 $       — $             — $       (4.1)

  Adjusted EBITDA
  Mexico                                       $         17.2     $      19.7       (13)%          (21)%       $     (2.5) $        (4.2) $     (0.7) $          — $        2.4
  Peru                                                 113.6             99.2        15%            27%              14.4           26.7         —               —       (12.3)
  Corporate & Eliminations                              (23.7)          (24.8)       4%                4%             1.1            1.1         —               —          —
  Total Adjusted EBITDA                        $       107.1      $      94.1        14%            25%        $     13.0 $         23.6 $      (0.7) $          — $       (9.9)

 (1)    Organic Constant Currency results exclude the period-over-period impact from currency fluctuations, acquisitions and divestitures, and other items.
       Other items include the impact of acquisition-related contingent liabilities for taxes other-than-income tax, net of changes in recorded indemnification
       assets. Organic Constant Currency is calculated using the change from prior-period average foreign exchange rates to current-period average foreign
       exchange rates, as applied to local-currency operating results for the current period. The “Organic Constant Currency” % changes are calculated by
       dividing the Organic Constant Currency amounts by the 2020 Revenues and Adjusted EBITDA amounts, excluding the impact of the divestitures.

Note: Dollars in millions, and may not sum to total due to rounding                                                                                   © 2021 Laureate Education, Inc.   28
Financial Tables
      Revenue and Adjusted EBITDA by segment: Year-to-Date

   IN MILLIONS
                                                                                         % Change                              $ Variance Components
                                                                                               Organic                      Organic
   For the six months ended                                                                    Constant                     Constant
   June 30,                                       2021                2020         Reported   Currency(2)       Total       Currency       Other   Acq/Div.         FX
   Revenues
   Mexico                                    $       259.7      $       269.1        (3)%         (9)%      $     (9.4) $       (24.3) $      — $         — $          14.9
   Peru                                              259.2              224.1        16%          27%             35.1           60.6         —           —           (25.5)
   Corporate & Eliminations                              3.4                 3.0     13%          13%              0.4            0.4         —           —              —
   Total Revenues                            $       522.3      $       496.2        5%           7%        $     26.1 $         36.7 $       — $         — $         (10.6)

   Adjusted EBITDA
   Mexico                                    $         34.5     $        43.0       (20)%        (11)%      $     (8.5) $        (4.6) $     (7.5) $      — $            3.6
   Peru                                              125.2               72.5        73%          91%             52.7           65.7         —           —           (13.0)
   Corporate & Eliminations                          (42.9)             (50.8)       16%          16%              7.9            7.9         —           —              —
   Total Adjusted EBITDA                     $       116.8      $        64.7        81%         107%       $     52.1 $         69.0 $      (7.5) $      — $          (9.4)

     (2)   Organic Constant Currency results exclude the period-over-period impact from currency fluctuations, acquisitions and divestitures, and other items.
           Other items include the impact of acquisition-related contingent liabilities for taxes other-than-income tax, net of changes in recorded indemnification
           assets. Organic Constant Currency is calculated using the change from prior-period average foreign exchange rates to current-period average foreign
           exchange rates, as applied to local-currency operating results for the current period. The “Organic Constant Currency” % changes are calculated by
           dividing the Organic Constant Currency amounts by the 2020 Revenues and Adjusted EBITDA amounts, excluding the impact of the divestitures.

Note: Dollars in millions, and may not sum to total due to rounding                                                                                © 2021 Laureate Education, Inc.   29
Financial Tables
      Consolidated Balance Sheets

    IN MILLIONS                                                           June 30, 2021               December 31, 2020             Change
    Assets
      Cash and cash equivalents                                       $                   427.1   $                 750.1      $         (323.0)
      Receivables (current), net                                                          123.5                     111.9                   11.6
      Other current assets                                                                144.3                     146.8                   (2.5)
      Current assets held for sale                                                        202.1                     435.0                (232.9)
      Property and equipment, net                                                         518.3                     578.5                  (60.2)
      Operating lease right-of-use assets, net                                            426.9                     462.8                  (35.9)
      Goodwill and other intangible assets                                                728.0                     800.4                  (72.4)
      Deferred income taxes                                                               102.0                     130.6                  (28.6)
      Other long-term assets                                                               53.4                      72.4                  (19.0)
      Long-term assets held for sale                                                      920.0                   1,482.5                (562.5)
    Total assets                                                      $              3,645.7      $               4,970.9      $       (1,325.2)

    Liabilities and stockholders' equity
      Accounts payable and accrued expenses                           $                   181.5   $                 200.9      $           (19.4)
      Deferred revenue and student deposits                                                48.6                      47.2                    1.4
      Total operating leases, including current portion                                   479.6                     519.1                  (39.5)
      Total long-term debt, including current portion                                     174.4                     995.7                (821.3)
      Other liabilities                                                                   301.0                     240.0                   61.0
      Current and long-term liabilities held for sale                                     186.3                     702.3                (516.0)
    Total liabilities                                                                1,371.4                      2,705.2              (1,333.8)
      Redeemable noncontrolling interests and equity                                        1.8                       1.7                    0.1
    Total stockholders' equity                                                       2,272.4                      2,263.9                    8.5
    Total liabilities and stockholders' equity                        $              3,645.7      $               4,970.9      $       (1,325.2)

Note: Dollars in millions, and may not sum to total due to rounding                                                       © 2021 Laureate Education, Inc.   30
Financial Tables
     Consolidated Statements of Cash Flows
                                                                                                          For the six months ended June 30,
  IN MILLIONS                                                                                           2021                2020                Change
  Cash flows from operating activities
     Net loss                                                                                       $      (194.2)      $      (213.3)      $        19.1
     Depreciation and amortization                                                                             49.7                84.3             (34.6)
     Loss on impairment of assets                                                                              65.1            448.9               (383.8)
     (Gain) loss on sales and disposal of subsidiaries and property and equipment, net                         (13.5)              36.0             (49.5)
     Loss on derivative instruments                                                                            24.5                  0.6            23.9
     Loss on debt extinguishment                                                                               78.0                  —              78.0
     Deferred income taxes                                                                                     67.0            (226.8)             293.8
     Unrealized foreign currency exchange gain                                                                 (13.5)              (25.6)           12.1
     Income tax receivable/payable, net                                                                        (17.9)              (46.3)           28.4
     Working capital, excluding tax accounts                                                                   (94.3)          (131.0)              36.7
     Other non-cash adjustments                                                                                66.9            134.6                (67.7)
  Net cash provided by operating activities                                                                    17.9                61.4             (43.5)
  Cash flows from investing activities
     Purchase of property and equipment                                                                        (20.6)              (49.2)           28.6
     Expenditures for deferred costs                                                                            (4.4)               (8.3)             3.9
     Receipts from sales of discontinued operations, net of cash sold, and property and equipment          725.3                   22.5            702.8
     Payments on derivatives related to sale of discontinued operations                                        (50.3)                —              (50.3)
  Net cash provided by (used in) investing activities                                                      650.0                   (35.0)          685.0
  Cash flows from financing activities
     (Decrease) increase in long-term debt, net                                                            (877.5)             268.9             (1,146.4)
     Proceeds from exercise of stock options                                                                     0.4               26.7             (26.3)
     Payments to repurchase common stock                                                                   (251.4)                 (29.2)          (222.2)
     Payments of call premiums and debt issuance costs                                                         (33.0)                —              (33.0)
     Financing other, net                                                                                       (1.2)               (3.0)             1.8
  Net cash (used in) provided by financing activities                                                    (1,162.7)             263.4             (1,426.1)
  Effects of exchange rate changes on Cash and cash equivalents and Restricted cash                             (3.4)               (3.9)             0.5
  Change in cash included in current assets held for sale                                                  164.9                   (66.5)          231.4
  Net change in Cash and cash equivalents and Restricted cash                                              (333.4)             219.3               (552.7)
  Cash and cash equivalents and Restricted cash at beginning of period                                     867.3                   97.8            769.5
  Cash and cash equivalents and Restricted cash at end of period                                    $      533.9        $      317.1        $      216.8
                                                                                                                                   © 2021 Laureate Education, Inc.   31
Note: Dollars in millions, and may not sum to total due to rounding
Financial Tables
         Non-GAAP Reconciliation (1 of 2)
    The following table reconciles (Loss) income from continuing operations to Adjusted EBITDA and Adjusted EBITDA margin:
                                                                                 For the three months ended June 30,                                     For the six months ended June 30,
    IN MILLIONS                                                                 2021            2020          Change                                    2021           2020          Change
    (Loss) income from continuing operations            $                        (115.9)    $     (11.6)    $      (104.3)                        $     (280.4)     $    194.5     $      (474.9)
    Plus:
    Equity in net income of affiliates, net of tax                                   —                       —                         —                     —                    (0.2)                     0.2
    Income tax expense (benefit)                                                   13.2                     8.7                       4.5                 126.0                 (221.3)                   347.3
    Loss from continuing operations before income taxes
    and equity in net income of affiliates                                       (102.7)                   (2.8)                   (99.9)                (154.4)                  (27.0)                 (127.4)
    Plus:
    Loss on disposal of subsidiaries, net                                            —                      —                         —                       —                     1.8                    (1.8)
    Foreign currency exchange loss (gain), net                                     15.5                    4.7                      10.8                   (12.7)                 (74.0)                   61.3
    Other expense, net                                                              0.1                    0.4                      (0.3)                     —                     0.5                    (0.5)
    Loss on derivatives                                                            53.8                    1.4                      52.4                    24.5                    0.6                    23.9
    Loss on debt extinguishment                                                    77.9                     —                       77.9                    77.9                     —                     77.9
    Interest expense                                                               13.5                   25.7                     (12.2)                   37.1                   51.0                   (13.9)
    Interest income                                                                (0.5)                  (0.3)                     (0.2)                   (1.2)                  (0.9)                   (0.3)
    Operating income (loss)                                                        57.7                   29.1                      28.6                   (28.7)                 (47.9)                   19.2
    Plus:
    Depreciation and amortization                                                  27.0                   18.1                       8.9                    49.7                   37.8                     11.9
    EBITDA                                                                         84.7                   47.2                      37.5                    21.0                  (10.1)                    31.1
    Plus:
    Share-based compensation expense (3)                                            2.6                    3.7                     (1.1)                    4.0                    5.3                    (1.3)
    Loss on impairment of assets (4)                                                7.2                   23.8                    (16.6)                   63.9                   27.5                    36.4
    EiP implementation expenses (5)                                                12.6                   19.3                     (6.7)                   27.9                   42.1                   (14.2)
    Adjusted EBITDA                                     $                         107.1   $               94.1   $                 13.0           $       116.8   $               64.7   $                52.1
    Revenues                                            $                         327.6   $              303.9   $                 23.7           $       522.3   $              496.2   $                26.1
    (Loss) income from continuing operations margin                               (35.4)%                 (3.8)%             -3,157 bps                   (53.7)%                 39.2 %            -9,290 bps
    Adjusted EBITDA margin                                                         32.7 %                 31.0 %                173 bps                    22.4 %                 13.0 %               932 bps
   (3) Represents non-cash, share-based compensation expense pursuant to the provisions of ASC Topic 718.
   (4) Represents non-cash charges related to impairments of long-lived assets.
   (5) Excellence-in-Process (EiP) implementation expenses are related to our enterprise-wide initiative to optimize and standardize Laureate’s processes, creating vertical integration of procurement,

       information technology, finance, accounting and human resources. It included the establishment of regional shared services organizations (SSOs), as well as improvements to the Company's system
       of internal controls over financial reporting. The EiP initiative also includes other back- and mid-office areas, as well as certain student-facing activities, expenses associated with streamlining the
       organizational structure, an enterprise-wide program aimed at revenue growth, and certain non-recurring costs incurred in connection with the planned and completed dispositions.
Note: Dollars in millions, and may not sum to total due to rounding                                                                                                        © 2021 Laureate Education, Inc.         32
Financial Tables
      Non-GAAP Reconciliation (2 of 2)

   The following table reconciles operating cash flow to Free Cash Flow for the six months ended June 30, 2021 and 2020:
    IN MILLIONS                                                                              2021                2020                   Change
    Net cash provided by operating activities                                          $            17.9     $          61.4       $           (43.5)

    Capital expenditures:
       Purchase of property and equipment                                                           (20.6)              (49.2)                  28.6
       Expenditures for deferred costs                                                               (4.4)               (8.3)                   3.9
    Free Cash Flow                                                                     $             (7.1) $              3.9      $           (11.0)

Note: Dollars in millions, and may not sum to total due to rounding                                                              © 2021 Laureate Education, Inc.   33
© 2021 Laureate Education, Inc.   34
You can also read