Hanley, Brian, Merlino, Stéphane and Bissas, Athanassios ORCID: 0000-0002-7858-9623 (2022) Biomechanics of World-Class 800 m Women at the 2017 ...
←
→
Page content transcription
If your browser does not render page correctly, please read the page content below
This is a peer-reviewed, final published version of the following document and is licensed under
Creative Commons: Attribution 4.0 license:

           Hanley, Brian, Merlino, Stéphane and Bissas, Athanassios
           ORCID: 0000-0002-7858-9623 (2022) Biomechanics of World-
           Class 800 m Women at the 2017 IAAF World Championships.
           Frontiers in Sports and Active Living, 4. Art 834813.
           doi:10.3389/fspor.2022.834813

Official URL: http://doi.org/10.3389/fspor.2022.834813
DOI: http://dx.doi.org/10.3389/fspor.2022.834813
EPrint URI: https://eprints.glos.ac.uk/id/eprint/11052

Disclaimer
The University of Gloucestershire has obtained warranties from all depositors as to their title in
the material deposited and as to their right to deposit such material.
The University of Gloucestershire makes no representation or warranties of commercial utility,
title, or fitness for a particular purpose or any other warranty, express or implied in respect of
any material deposited.
The University of Gloucestershire makes no representation that the use of the materials will not
infringe any patent, copyright, trademark or other property or proprietary rights.
The University of Gloucestershire accepts no liability for any infringement of intellectual
property rights in any material deposited but will remove such material from public view
pending investigation in the event of an allegation of any such infringement.

PLEASE SCROLL DOWN FOR TEXT.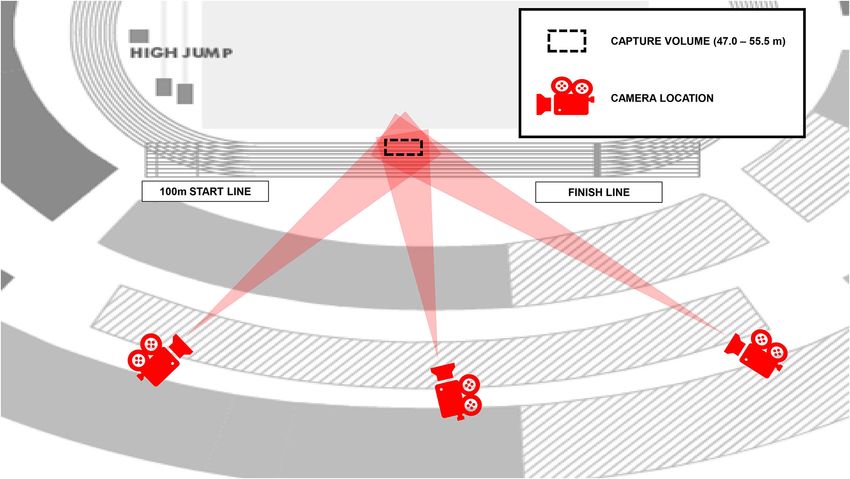
BRIEF RESEARCH REPORT
                                                                                                                                             published: 14 April 2022
                                                                                                                                     doi: 10.3389/fspor.2022.834813

                                             Biomechanics of World-Class 800 m
                                             Women at the 2017 IAAF World
                                             Championships
                                             Brian Hanley 1*, Stéphane Merlino 2 and Athanassios Bissas 1,3,4
                                             1
                                               Carnegie School of Sport, Leeds Beckett University, Leeds, United Kingdom, 2 International Relations and Development
                                             Department, World Athletics, Monte Carlo, Monaco, 3 Athletics Biomechanics, Leeds, United Kingdom, 4 School of Sport and
                                             Exercise, University of Gloucestershire, Gloucester, United Kingdom

                                             The 800 m race challenges the aerobic and anaerobic energy systems, and athletes
                                             adopt a technique that allows for running efficiency as well as sprinting speeds. The aim
                                             of this novel study was to compare important kinematic variables between the two laps of
                                             the 2017 IAAF World Championships women’s final. Video data (150 Hz) were collected
                                             of all eight finalists on both laps at a distance approximately 50 m from the finish line along
                              Edited by:     the home straight. Running speed, step length, cadence, temporal variables, sagittal
                     Jill L. McNitt-Gray,
                                             plane joint angles, and shank angle at initial contact were measured. Running speed was
      University of Southern California,
                            United States    faster on lap 2 (p = 0.008) because of large increases in cadence (p = 0.012). These
                         Reviewed by:        higher cadences resulted in large decreases in contact times (p = 0.031) and in flight
                        Johnny Padulo,       times (p = 0.016) on lap 2. Greater knee flexion and ankle plantarflexion (p ≤ 0.039) at
               University of Milan, Italy
                         Bergita Ganse,
                                             initial contact on lap 2 seemed partly responsible for shorter swing times (p = 0.016), and
        Saarland University, Germany         which accompanied a decrease in shank angle at initial contact from lap 1 (7◦ ) to a more
                     Max R. Paquette,
                                             vertical position on lap 2 (4◦ ) (p = 0.008). Coaches should note that the need for higher
 University of Memphis, United States
                           Joao R. Vaz,      cadence, horizontal impulse production during shorter contact times, and the adoption
         University of Lisbon, Portugal      of forefoot striking require strength and neural system training to allow for athletes to
                 *Correspondence:            increase cadence during the sprint finish. Increasing cadence (and not step length) was
                        Brian Hanley
         b.hanley@leedsbeckett.ac.uk
                                             the driving factor for faster finishing speeds in the women’s 800 m.
                                             Keywords: coaching, elite-standard athletes, kinematics, speed, track and field
                    Specialty section:
          This article was submitted to
 Biomechanics and Control of Human
                                             INTRODUCTION
                            Movement,
                a section of the journal
                                             The 800 m race is the shortest middle-distance track race held in major events such as the Olympic
  Frontiers in Sports and Active Living
                                             Games and World Athletics Championships, with outdoor competitions held over two 400-m
       Received: 13 December 2021            laps. Racing over 800 m elicits both aerobic metabolism to its maximum power and anaerobic
          Accepted: 21 March 2022
                                             metabolism to its maximum capacity (Billat et al., 2009). Elite 800 m runners tend to adopt
           Published: 14 April 2022
                                             seahorse-shaped pacing (Casado et al., 2021), whereby a very fast start is followed by the slowest
                              Citation:
                                             part of the race (between 200 and 400 m) and then a gradual increase in speed until the last 100 m.
     Hanley B, Merlino S and Bissas A
 (2022) Biomechanics of World-Class
                                             One interesting aspect of 800 m racing is thus that the athletes try to run their fastest speeds during
      800 m Women at the 2017 IAAF           the endspurt, when they are likely to be tiring and fatigue resistance is crucial (Haugen et al., 2021).
                World Championships.         The manner in which the 800 m is raced means that, in physiological terms, the two laps are quite
   Front. Sports Act. Living 4:834813.       different (Gamboa et al., 1996), and an appreciation of what mechanical changes occur between the
      doi: 10.3389/fspor.2022.834813         first and second laps would therefore be valuable for athletes and coaches.

Frontiers in Sports and Active Living | www.frontiersin.org                       1                                             April 2022 | Volume 4 | Article 834813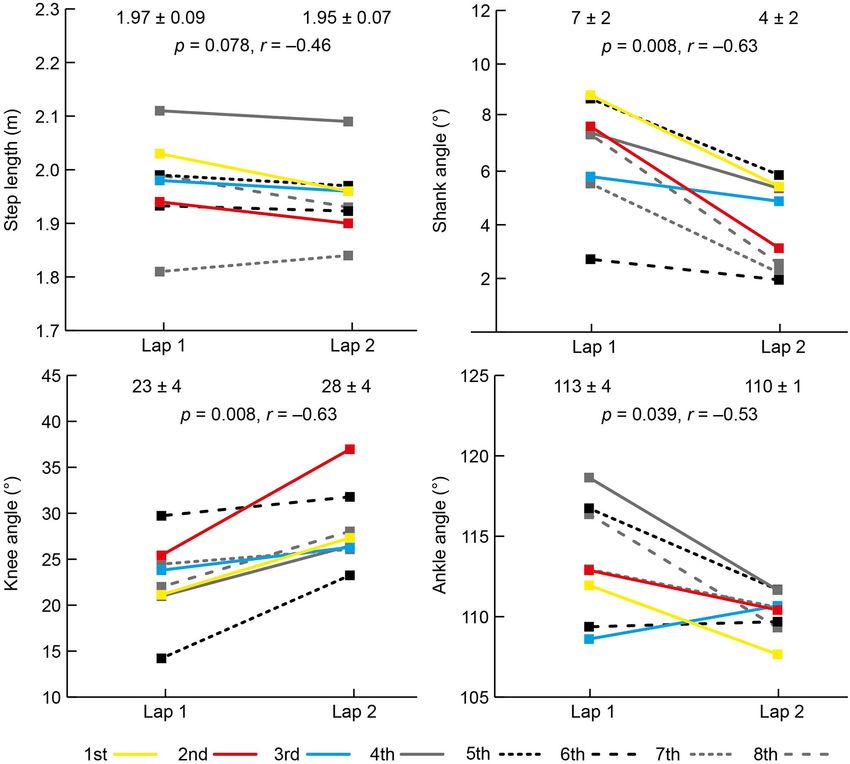
Hanley et al.                                                                                              Biomechanics of World-Class 800 m Women

    The two main factors in running speed are step length and                ecologically valid setting of a world-class competition. Indeed,
cadence (also known as step rate or frequency); it follows that an           many of these studies used set speeds that are not indicative
athlete can only run faster if one or both of these spatiotemporal           of what occurs when athletes are racing to achieve the best
elements is increased. Cadence has been suggested to be a greater            possible finishing position. From a biomechanical viewpoint, an
differentiator of running speed when accelerating to maximal                 understanding of how world-class athletes alter their gait between
speeds, not least because of how step length is limited by leg               slower and faster race paces is required to satisfactorily identify
length (Hunter et al., 2004), itself affected by overall body height.        key biomechanical variables for athletes and coaches to develop
Because higher cadences require the recruitment of a greater                 in training. The aim of this observational study was to analyze
proportion of less efficient fast-twitch type II muscle fibers               changes in spatiotemporal and joint kinematic factors in world-
(Brisswalter et al., 2000), it follows that increasing cadence is            class women’s 800 m running between the end of the first and
a mechanical tactic best left to near the end of the race, when              second laps. Based on previous research, it was hypothesized that
running economy can be sacrificed for speed (Bushnell and                    athletes would run faster in the second lap because of greater
Hunter, 2007). Changes in cadence can lead to reduced contact                step lengths and cadences, with corresponding changes to related
time, although this could affect the magnitude of forward impulse            spatiotemporal and joint kinematic variables.
required to achieve fast running speeds (Weyand et al., 2010),
or to a reduction of flight time, which in turn could affect the             MATERIALS AND METHODS
distance achieved during flight and thereby reduce step length.
A shorter contact time is associated with faster running because             Research Approval
it results in a smaller duty factor (the proportion of a leg’s               Data were collected as part of the London 2017 IAAF World
cycle time spent in contact) (Forrester and Townend, 2015),                  Championships Biomechanics Project. The use of those data
which manifests as a “bouncy” running style where high vertical              for this study was approved by the IAAF (since renamed
stiffness aids performance (Burns et al., 2021; van Oeveren et al.,          World Athletics), who own and control the data, and locally
2021). Maintaining short contact times is a key determinant of               the study was reviewed and approved by Carnegie School of
maintaining performance during runs to exhaustion (Hayes and                 Sport Research Ethics Committee. The participants provided
Caplan, 2014), and highlights the value of analyzing temporal                their written informed consent to participate in this study. The
variables as athletes sprint to the finish in 800 m racing. However,         study was conducted in accordance with the recognized ethical
no previous research has been conducted on world-class female                standards of the Declaration of Helsinki.
800 m runners in competition to see what changes are adopted
in practice.                                                                 Participants
    Changes in cadence result in changes in joint kinematics, with           Eight athletes (age: 26 ± 3 years; stature: 1.73 ± 0.06 m; mass:
the knee most involved through an increase in flexion at initial             61 ± 6 kg) were analyzed approximately halfway along the home
contact, with an accompanying increase in ankle plantarflexion               straight on the first and second laps of the women’s 800 m
(Heiderscheit et al., 2011) and a decrease in shank angle at initial         final (∼350 and 750 m of total race distance). The temperature
contact (Preece et al., 2019). These joint positions are associated          at the start of the race was 22◦ C and the relative humidity
with forefoot or midfoot striking, which is the predominant                  was 35% (Hanley et al., 2018). Athletes’ personal best (PB)
footstrike pattern amongst middle-distance runners (Hayes and                and finishing times were obtained from the open-access World
Caplan, 2012), and is similarly found amongst the world’s best               Athletics website (World Athletics, 2021a). Participants’ dates of
male 10,000 m runners (Hanley et al., 2021b), possibly because               birth were obtained from World Athletics (2021b), whereas their
of a potential association with better running economy (Santos-              body heights and masses were obtained from Matthews (2017)
Concejero et al., 2014). Better long-distance runners were found             and online sources (en.wikipedia.com/wiki).
to have smaller shank angles at initial contact (Folland et al., 2017;
Preece et al., 2019); however, the participants in these studies             Data Collection
were not elite athletes running at speeds found in championship              Three stationary Sony PXW-FS7 digital cameras (Sony, Tokyo,
racing. Given that middle-distance runners are predominantly                 Japan) recording at 150 Hz (shutter speed: 1/1,250 s; ISO: 1600;
forefoot or midfoot strikers (Hayes and Caplan, 2012), it could be           FHD: 1920 × 1080 px) were used to record the athletes as they
assumed that their shank angles at initial contact would be close            ran through the calibrated middle section of the home straight
to vertical (ankle directly below or even behind the knee), but              (47.0–55.5 m from the start line used for the 100 m event). The
whether changes occur in joint or shank angles with increases                cameras were placed in three locations on a broadcasting balcony
(or decreases) in speed amongst elite middle-distance running                along the home straight, and angled at approximately 45◦ , 100◦ ,
has not been established. Such information could be useful to                and 135◦ to the plane of motion, respectively (Figure 1). A rigid
coaches with regard to developing a technical model of running               cuboid calibration frame (length: 3.044 m, width: 3.044 m, height:
for their athletes.                                                          3.044 m) was positioned twice over discrete predefined areas in
    Much of what we know about running mechanics stems                       the first two lanes on the running track to ensure an accurate
from research on longer distances, non-elite athletes, male                  definition of a volume within which all athletes ran. Markings
runners only, or treadmill and other laboratory-based studies                on the frame produced 24 non-coplanar control points per
(Cunningham et al., 2013; Hanley et al., 2021b; Trowell et al.,              individual calibrated volume (48 points in total) and facilitated
2021), which might not reflect what occurs in the highly                     the construction of a global coordinate system.

Frontiers in Sports and Active Living | www.frontiersin.org              2                                       April 2022 | Volume 4 | Article 834813
Hanley et al. Biomechanics of World-Class 800 m Women
FIGURE 1 | Camera positions for recording the women’s 800 m final (laps 1 and 2) at the 2017 IAAF World Championships. The position on the track where the
athletes were recorded is shown by the dashed lines.
Data Analysis heel and midfoot contacted the ground together) or forefoot (the
The collected video files were imported into SIMI Motion forefoot/front half of the sole contacted the ground first with
(version 9.2.2, Simi Reality Motion Systems GmbH, a clear absence of heel contact) (Hasegawa et al., 2007). Two
Germany) for analysis. An event synchronization technique successive steps per athlete per lap were analyzed.
(synchronization of four critical instants: right foot initial
contact, right foot toe-off, left foot initial contact and left Statistics
foot toe-off) was applied to synchronize the two-dimensional Results are reported as individual values or as means ± one
coordinates from each camera. The magnification tool in SIMI standard deviation (SD). All statistical analyses were carried out
Motion was set at 400% to aid identification of body landmarks. using SPSS Statistics 27 (IBM SPSS, Inc., Chicago, IL). Because
The Direct Linear Transformation (DLT) algorithm (Abdel-Aziz of the small sample size, Wilcoxon sign-rank tests were used to
et al., 2015) was used to reconstruct the three-dimensional (3D) compare differences between laps for all variables; significance
coordinates from each camera’s x- and y-image coordinates. The was set at p < 0.05, and effect sizes (r) were calculated using their
obscuring of many body segments in most athletes, caused by the magnitude as either small (0.10–0.29), medium (0.30–0.49), or
tight “bunching” of the group, precluded a full-body digitizing large (≥ 0.50) (Field, 2009).
process. Running speed was thus calculated by digitizing the
athlete’s head as a proxy for the center of mass (CM) (Hanley RESULTS
et al., 2021a), whereas distances and angles were calculated using
3D coordinate data found using the 3D still image measurement The mean PB time (min:s) for the eight athletes before the race
tool in SIMI Motion. was 1:56.79 (±1.28) and their mean finishing time was 1:57.38
Descriptions of the spatiotemporal and joint angular variables (±1.37), equivalent to 100.5% (±0.6) of PB time; two athletes set
analyzed in this study are presented in Table 1. Joint angular PB times during the final. The results for each spatiotemporal and
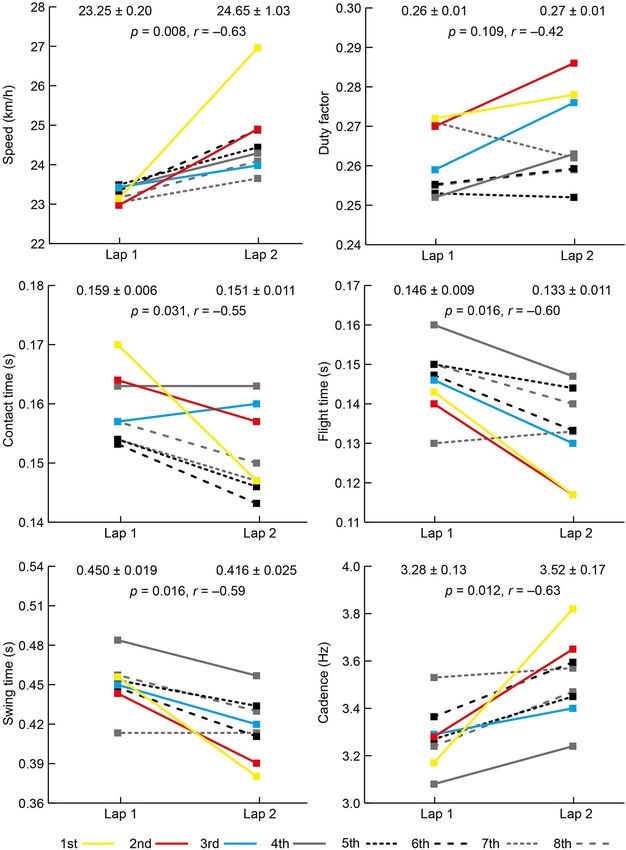
data were averaged between left and right sides, rounded to joint kinematic variable on both laps are shown in Figures 2, 3.
the nearest integer, and have been presented in this study at All athletes landed with a forefoot striking pattern on both laps.
initial contact (defined as the first visible instant during stance There was an increase in speed between laps from 23.25 km/h
where the athlete’s foot clearly contacted the ground). Footstrike (±0.20) to 24.65 km/h (±1.03) with all women faster on the
patterns were defined using the foot position at initial contact second lap (Figure 2). There was an increase in cadence from
as either rearfoot (the heel contacted the ground first without 3.29 to 3.52 Hz (Figure 2), but there was no change in step
simultaneous contact by the midfoot or forefoot), midfoot (the length (Figure 3). Individually, all eight competitors had greater
Frontiers in Sports and Active Living | www.frontiersin.org 3 April 2022 | Volume 4 | Article 834813Hanley et al. Biomechanics of World-Class 800 m Women
TABLE 1 | Variables analyzed in the study and their description. shows that athletes rely on higher cadences for faster speeds
and, on this most fundamental basis, athletes who wish to be
Variable name Description
successful 800 m runners must develop the neural adaptations
Running speed (km/h) The mean CM horizontal speed during a complete required for higher cadence (Salo et al., 2011). All eight women
gait cycle increased cadence from lap 1 to lap 2, and the biggest increase
Step length (m) The distance between successive foot contacts (+ 21%) was for the eventual winner (to 3.82 Hz, equivalent to a
from a specific event on the gait cycle on a rate of 229 steps/min) with the second biggest increase (+11%)
particular foot (e.g., toe-off) to the equivalent event for the silver medalist. Although it is not always the case that the
on the other foot
fastest runners are those with the highest cadences (van Oeveren
Cadence (Hz) Calculated by dividing horizontal speed by step
et al., 2021), increasing cadence when step length is already close
length (Mero and Komi, 1994)
to its maximum is clearly the principal factor in achieving world-
Contact time (s) The time duration from initial contact to toe-off
class finishing speeds in competition. Such a high cadence is not
Flight time (s) The time duration from toe-off of one foot to initial
contact of the opposite foot feasible over the whole of the race, or over longer distance events,
Swing time (s) The time duration from toe-off on one foot to initial
given its greater metabolic cost (Lieberman et al., 2015), and so is
contact on the same foot best left as the key biomechanical resource to tap into during the
Duty factor The proportion of stride time (contact time plus sprint for the finish line.
swing time) when the foot is in contact with the The temporal changes that occurred because of increased
ground cadence were large reductions in contact time and flight time.
Shank angle (◦ ) The angle between the lower leg and the ground, The athletes achieved this critical reduction in flight time and
where 0◦ indicates a vertical position (knee directly
a decrease in the time during swing (toe-off to initial contact)
above the ankle); angles greater than 0◦ indicate the
ankle landed in front of the knee
through higher cadences, which are largely achieved in fast
Knee angle (◦ ) The sagittal plane angle between the thigh and
running by flexing the hip faster (Bushnell and Hunter, 2007).
lower leg segments (0◦ in the anatomical standing It was noticeable in Figure 1 that the top two finishers had
position, with positive values indicating flexion) the shortest flight times on lap 2, resulting from their higher
Ankle angle (◦ ) The sagittal plane angle between the lower leg and cadences, and ultimately a key factor in their success. Although
foot segments, calculated in a clockwise direction lower duty factors are associated with faster running, they
(110◦ in the anatomical standing position) (Cairns
did not decrease between laps because the decrease in contact
et al., 1986)
time was effectively offset by the decrease in swing time (and
therefore total step time) and shows that duty factor is relatively
constant because elite-standard athletes have robust mechanisms
to exploit the advantages of better spring-mass behavior (Burns
cadences on the second lap (Figure 2). As well as a decrease in
et al., 2021). Regardless of how the 800 m is a middle-distance
contact time from lap 1 to lap 2, there was a decrease in flight
event that relies on predominantly aerobic energy metabolism,
time, itself caused by a decrease in swing time (Figure 2), but
the final stages are more sprint-like in mechanical terms and
there was no change in duty factor. At initial contact, there was a
demonstrate the value of developing sprinting form in training
5◦ decrease in knee angle (more flexed) and a 3◦ decrease in ankle
(Bushnell and Hunter, 2007). Indeed, the winner of the women’s
angle (more plantarflexed). The shank angle at initial contact also
800 m ran a quicker time over the last 100 m (13.54 s) than
decreased from lap 1 to lap 2 (Figure 3).
the women competing over 400 m in the same championships
(Hanley et al., 2018; Pollitt et al., 2018), and racing occasionally
DISCUSSION over 400 m could therefore be a coaching aid to coping with the
demands of maintaining sprinting form while fatigued (Gamboa
The aim of this observational study was to analyze changes in et al., 1996).
spatiotemporal factors in world-class women’s 800 m running The 3◦ decrease in shank angle at initial contact and a knee
between the end of the first and second laps. Although mean that flexed 5◦ more at initial contact on lap 2 resulted from the
running speed on the first lap was relatively fast (equivalent to higher cadences, and which might have been partly responsible
2:03.8 pace), all women sped up on lap 2, showing that they for the decrease in swing time. Despite a consistent forefoot
were running faster even though they were likely to be tiring. footstrike pattern (achieved through the ankle’s plantarflexed
The pacing profiles for this final (Hanley et al., 2018) showed position), the mean shank angle at initial contact was greater
that it was a tactical race, in line with other championship than zero (7◦ and 4◦ on laps 1 and 2, respectively), with
800 m finals (Hanley et al., 2019), where athletes adopt a slower the ankle therefore landing anterior to the knee. The shank
speed during the second half of the first lap, and attempt to angle at initial contact has been referred to previously as the
maintain a fast sprint finish over the last 100 m. Such tactics “overstride angle” (Squadrone et al., 2015), which could give
mean that the results of this study are unique to this race, and the impression that a touchdown position where the ankle is
will differ in other races where athletes adopt alternative tactics. anterior to the knee is a negative feature of an individual runner’s
The hypothesis that faster running speeds would result from technique. By contrast, this leg position is clearly normal within
increased cadence was supported; however, the hypothesis that this world-class sample of middle-distance runners. It might
step length would similarly increase was not supported. This be that it is not the shank’s orientation that affects running
Frontiers in Sports and Active Living | www.frontiersin.org 4 April 2022 | Volume 4 | Article 834813Hanley et al. Biomechanics of World-Class 800 m Women FIGURE 2 | Mean (±SD) and individual athlete data for speed and temporal data on laps 1 and 2 of the women’s 800 m final. The color used to represent each athlete is the same for each variable and the key for finishing positions is shown at the bottom of the figure. Frontiers in Sports and Active Living | www.frontiersin.org 5 April 2022 | Volume 4 | Article 834813
Hanley et al.                                                                                                            Biomechanics of World-Class 800 m Women

 FIGURE 3 | Mean (±SD) and individual athlete data for spatial and angular data on laps 1 and 2 of the women’s 800 m final. The color used to represent each athlete
 is the same for each variable and the key for finishing positions is shown at the bottom of the figure.

performance, but rather the landing foot’s position relative to                       conditioning is at its most discriminating influence with 200 m
the CM that induces braking effects (Lieberman et al., 2015),                         remaining (Hettinga et al., 2019), it is the ability of the athletes
and where too long a distance results in relatively long stance                       to adopt a metabolically costly but sprint-dependent increase
times (van Oeveren et al., 2021). Coaches should note that                            in cadence. Indeed, during the endspurt, there were strong
“overstriding” is a misleading term in describing foot landing                        similarities in the values recorded for cadence and lower limb
position during running, regardless of which definition is used                       joint angles between the women’s 400 and 800 m events (Pollitt
(Lieberman et al., 2015).                                                             et al., 2018). An inevitable limitation of collecting data in
   The most important strength of this novel research is that                         competition is that it is not possible to control the athletes’
the athletes have been studied in a natural setting, providing                        performances (as they can be in a laboratory), and so the tight
high ecological validity. The results showed that the two laps are                    bunching that occurred meant it was not possible to digitize
quite different (Gamboa et al., 1996), not only in physiological                      obscured body parts (e.g., the arms) and analyze all potentially
terms but also in biomechanical variables. As physiological                           important variables. This means, for example, that measurements

Frontiers in Sports and Active Living | www.frontiersin.org                       6                                             April 2022 | Volume 4 | Article 834813
Hanley et al.                                                                                                                       Biomechanics of World-Class 800 m Women

of CM position relative to foot position were not possible. It was                            DATA AVAILABILITY STATEMENT
also not possible to collect any physiological data that could have
aided analysis, for example in relation to muscle activity. This                              The datasets presented in this article are not readily available
study was limited by the small number of participants, and future                             because dataset has been part of a wider project commissioned
research should attempt to capture more in-competition data that                              by World Athletics. Requests to access the datasets should be
incorporate more middle-distance athletes (across abilities and                               directed to b.hanley@leedsbeckett.ac.uk.
sexes) to build a larger pool of data from which more advanced
analyses are viable.                                                                          ETHICS STATEMENT
                                                                                              The studies involving human participants were reviewed
CONCLUSIONS
                                                                                              and approved by Carnegie School of Sport Research Ethics
In summary, this was the first study to analyze the women’s                                   Committee, Leeds Beckett University. The patients/participants
800 m at a major championships final across both laps. The                                    provided their written informed consent to participate in
athletes achieved faster running speeds during the sprint finish                              this study.
through increased cadence, which predominantly resulted in
shorter flight times. Shorter swing times were part of the reason                             AUTHOR CONTRIBUTIONS
for these shorter flight times, as were a greater flexion of the
knee and a greater plantarflexion of the ankle at initial contact.                            AB and SM arranged data collection during the World
The well-established need for considerable anaerobic energy                                   Championships as Project Director and Project Leader,
system training during the endspurt should be complemented by                                 respectively. BH and AB performed data collection. BH processed
neural adaptation training that assists a high cadence, horizontal                            the data and created the figure. All authors conceptualized and
impulse production and spring-mass behavior (especially given                                 designed the study, wrote the manuscript, interpreted the results
the forefoot landing position adopted). The world’s fastest                                   of the research, edited, critically revised, and approved the final
runners have shank angles at initial contact greater than 0◦                                  version for submission.
at very fast running speeds, and the ubiquity of this landing
position amongst this group shows that it is normal for the                                   FUNDING
ankle to land anterior to the knee in middle-distance running.
Although many 800 m athletes double up over 1,500 m, the 400 m                                The data collection and initial data analysis were supported by
event might also provide the opportunity to develop the sprint                                funding provided by the IAAF/World Athletics as part of a wider
mechanics used in the endspurt despite fatigue. In this study,                                development/education project; however, the nature of the data
increasing cadence, rather than step length, was the driving factor                           is purely descriptive and not associated with any governing body,
for faster finishing speeds in the closing stages of the women’s                              commercial sector, or product. No funding was provided for the
800 m, and should be a key focus for athletes when training for                               writing of this manuscript. The results of the present study do not
800 m racing.                                                                                 constitute endorsement by the World Athletics.

REFERENCES                                                                                    Cunningham, R., Hunter, I., Seeley, M., and Feland, B. (2013). Variations
                                                                                                 in running technique between female sprinters, middle, and long-distance
Abdel-Aziz, Y. I., Karara, H. M., and Hauck, M. (2015). Direct linear                            runners. Int. J. Exerc. Sci. 6, 43–51.
    transformation from comparator coordinates into space coordinates in                      Field, A. P. (2009). Discovering Statistics Using SPSS, 4th Edn. London: Sage.
    close range photogrammetry. Photogramm. Eng. Remote Sens. 81, 103–107.                    Folland, J. P., Allen, S. J., Black, M. I., Handsaker, J. C., and Forrester, S.
    doi: 10.14358/PERS.81.2.103                                                                  E. (2017). Running technique is an important component of running
Billat, V., Hamard, L., Koralsztein, J. P., and Morton, R. H. (2009).                            economy and performance. Med. Sci. Sports Exerc. 49, 1412–1423.
    Differential modeling of anaerobic and aerobic metabolism in the 800-m and                   doi: 10.1249/MSS.0000000000001245
    1,500-m run. J. Appl. Physiol. 107, 478–487. doi: 10.1152/japplphysiol.912                Forrester, S. E., and Townend, J. (2015). The effect of running velocity
    96.2008                                                                                      on footstrike angle–a curve-clustering approach. Gait Post. 41, 26–32.
Brisswalter, J., Hausswirth, C., Smith, D., Vercruyssen, F., and Vallier, J. M. (2000).          doi: 10.1016/j.gaitpost.2014.08.004
    Energetically optimal cadence vs. freely-chosen cadence during cycling: effect            Gamboa, J. D., Elrick, R., Mora, A. H., Martin, D. E., Piqueras, M. P., Paterson,
    of exercise duration. Int. J. Sports Med. 21, 60–64. doi: 10.1055/s-2000-8857                M., et al. (1996). NSA round table: speed in the 800 metres. New Stud. Athlet.
Burns, G. T., Gonzalez, R., Zendler, J. M., and Zernicke, R. F. (2021).                          11, 7–22.
    Bouncing behavior of sub-four minute milers. Sci. Rep. 11, 10501.                         Hanley, B., Bissas, A., and Merlino, S. (2018). “Time analysis for the IAAF
    doi: 10.1038/s41598-021-89858-1                                                              World Championships London 2017: 800 m women’s,” in 2017 IAAF World
Bushnell, T., and Hunter, I. (2007). Differences in technique between sprinters                  Championships Biomechanics Research Project (London; Monte Carlo: IAAF).
    and distance runners at equal and maximal speeds. Sports Biomech. 6, 261–268.                Available online at: https://www.worldathletics.org/about-iaaf/documents/
    doi: 10.1080/14763140701489728                                                               research-centre
Cairns, M. A., Burdette, R. G., Pisciotta, J. C., and Simon, S. R. (1986). A                  Hanley, B., Bissas, A., and Merlino, S. (2021a). The head is an excellent proxy
    biomechanical analysis of racewalking gait. Med. Sci. Sports Exerc. 18, 446–453.             for the whole body center of mass when measuring running velocity in
Casado, A., Hanley, B., Jiménez-Reyes, P., and Renfree, A. (2021). Pacing profiles               competition. J. Biomech. 92, 110399. doi: 10.1016/j.jbiomech.2021.110399
    and tactical behaviors of elite runners. J. Sport Health Sci. 10, 537–549.                Hanley, B., Stellingwerff, T., and Hettinga, F. J. (2019). Successful pacing profiles
    doi: 10.1016/j.jshs.2020.06.011                                                              of Olympic and IAAF World Championship middle-distance runners across

Frontiers in Sports and Active Living | www.frontiersin.org                               7                                                April 2022 | Volume 4 | Article 834813
Hanley et al. Biomechanics of World-Class 800 m Women
qualifying rounds and finals. Int. J. Sports Physiol. Perform. 14, 894–901. Salo, A. I., Bezodis, I. N., Batterham, A. M., and Kerwin, D. G. (2011). Elite
doi: 10.1123/ijspp.2018-0742 sprinting: are athletes individually step-frequency or step-length reliant? Med.
Hanley, B., Tucker, C. B., Bissas, A., Merlino, S., and Gruber, A. H. Sci. Sports Exerc. 43, 1055–1062. doi: 10.1249/MSS.0b013e318201f6f8
(2021b). Footstrike patterns and race performance in the 2017 IAAF Santos-Concejero, J., Tam, N., Granados, C., Irazusta, J., Bidaurrazaga-Letona,
World Championship men’s 10,000 m final. Sports Biomech. 1–10. I., Zabala-Lili, J., et al. (2014). Interaction effects of stride angle and
doi: 10.1080/14763141.2020.1856916. [Epub ahead of print]. strike pattern on running economy. Int. J. Sports Med. 35, 1118–1123.
Hasegawa, H., Yamauchi, T., and Kraemer, W. J. (2007). Foot strike patterns of doi: 10.1055/s-0034-1372640
runners at the 15-km point during an elite-level half marathon. J. Strength Squadrone, R., Rodano, R., Hamill, J., and Preatoni, E. (2015). Acute effect
Cond. Res. 21, 888–893. of different minimalist shoes on foot strike pattern and kinematics
Haugen, T., Sandbakk, Ø., Enoksen, E., Seiler, S., and Tønnessen, E. in rearfoot strikers during running. J. Sports Sci. 33, 1196–1204.
(2021). Crossing the golden training divide: the science and practice of doi: 10.1080/02640414.2014.989534
training World-class 800-and 1500-m runners. Sports Med. 51, 1835–1854. Trowell, D., Phillips, E., Saunders, P., and Bonacci, J. (2021). The relationship
doi: 10.1007/s40279-021-01481-2 between performance and biomechanics in middle-distance runners. Sports
Hayes, P., and Caplan, N. (2012). Foot strike patterns and ground contact Biomech. 20, 974–984. doi: 10.1080/14763141.2019.1630478
times during high-calibre middle-distance races. J. Sports Sci. 30, 1275–1283. van Oeveren, B. T., de Ruiter, C. J., Beek, P. J., and van Dieën, J. H. (2021). The
doi: 10.1080/02640414.2012.707326 biomechanics of running and running styles: a synthesis. Sports Biomech. 1–39.
Hayes, P. R., and Caplan, N. (2014). Leg stiffness decreases during a run doi: 10.1080/14763141.2021.1873411. [Epub ahead of print].
to exhaustion at the speed at VO2 max. Eur. J. Sports Sci. 14, 556–562. Weyand, P. G., Sandell, R. F., Prime, D. N., and Bundle, M. W. (2010). The
doi: 10.1080/17461391.2013.876102 biological limits to running speed are imposed from the ground up. J. Appl.
Heiderscheit, B. C., Chumanov, E. S., Michalski, M. P., Wille, C. M., and Ryan, M. Physiol. 108, 950–961. doi: 10.1152/japplphysiol.00947.2009
B. (2011). Effects of step rate manipulation on joint mechanics during running. World Athletics (2021a). Timetable/Results. Available online at: https://www.
Med. Sci. Sports Exerc. 43, 296–302. doi: 10.1249/MSS.0b013e3181ebedf4 worldathletics.org/competitions/world-athletics-championships/iaaf-world-
Hettinga, F. J., Edwards, A. M., and Hanley, B. (2019). The science championships-london-2017-7093740/timetable/bydiscipline (accessed
behind competition and winning in athletics: using world-level competition August 20, 2021).
data to explore pacing and tactics. Front. Sports Act. Living 1, 11. World Athletics (2021b). Athletes. Available at: https://www.worldathletics.org/
doi: 10.3389/fspor.2019.00011 athletes-home (accessed August 20, 2021).
Hunter, J. P., Marshall, R. N., and McNair, P. J. (2004). Interaction of step length
and step rate during sprint running. Med. Sci. Sports Exerc. 36, 261–271. Conflict of Interest: The authors declare that the research was conducted in the
doi: 10.1249/01.MSS.0000113664.15777.53 absence of any commercial or financial relationships that could be construed as a
Lieberman, D. E., Warrener, A. G., Wang, J., and Castillo, E. R. (2015). Effects potential conflict of interest.
of stride frequency and foot position at landing on braking force, hip torque,
impact peak force and the metabolic cost of running in humans. J. Exp. Biol. Publisher’s Note: All claims expressed in this article are solely those of the authors
218, 3406–3414. doi: 10.1242/jeb.125500 and do not necessarily represent those of their affiliated organizations, or those of
Matthews, P. (ed.). (2017). Athletics 2017: The International Track and Field
the publisher, the editors and the reviewers. Any product that may be evaluated in
Annual. York: SportsBooks Ltd.
this article, or claim that may be made by its manufacturer, is not guaranteed or
Mero, A., and Komi, P. V. (1994). EMG, force, and power analysis of sprint-specific
strength exercises. J. Appl. Biomech. 10, 1–13. doi: 10.1123/jab.10.1.1 endorsed by the publisher.
Pollitt, L., Walker, J., Tucker, C., Bissas, A., and Merlino, S. (2018). “Biomechanical
report for the IAAF World Championships London 2017: 400m women’s,” Copyright © 2022 Hanley, Merlino and Bissas. This is an open-access article
in 2017 IAAF World Championships Biomechanics Research Project (London; distributed under the terms of the Creative Commons Attribution License (CC BY).
Monte Carlo: IAAF). Available online at: https://www.worldathletics.org/ The use, distribution or reproduction in other forums is permitted, provided the
about-iaaf/documents/research-centre original author(s) and the copyright owner(s) are credited and that the original
Preece, S. J., Bramah, C., and Mason, D. (2019). The biomechanical characteristics publication in this journal is cited, in accordance with accepted academic practice.
of high-performance endurance running. Eur. J. Sport Sci. 19, 784–792. No use, distribution or reproduction is permitted which does not comply with these
doi: 10.1080/17461391.2018.1554707 terms.
Frontiers in Sports and Active Living | www.frontiersin.org 8 April 2022 | Volume 4 | Article 834813You can also read