H1 2021 RESULTS PRESENTATION - 24 FEBRUARY 2021 amagroupltd.com - AMA Group
←
→
Page content transcription
If your browser does not render page correctly, please read the page content below
Page 1

H1 2021 RESULTS PRESENTATION
       24 FEBRUARY 2021

          amagroupltd.com
Page 2

WORLD CLASS
AUTOMOTIVE
  SOLUTIONS
Page 3

Disclaimer.
This presentation contains summary information about AMA Group Limited (ABN 50 113 883 560) (“AMA Group”) and its activities current as at the date
of this presentation. The information in this presentation is of general background and does not purport to be complete. It should be read in conjunction
with AMA Group’s other periodic and continuous disclosure announcements filed with the Australian Securities Exchange, which are available at
www.asx.com.au.

This presentation is for information purposes only and is not a prospectus or product disclosure statement, financial product or
investment advice or a recommendation to acquire AMA Group’s shares or other securities. It has been prepared without taking into account the
objectives, financial situation or needs of individuals. Before making an investment decision, prospective investors should consider the appropriateness of
the information having regard to their own objectives, financial situation and needs and seek legal and taxation advice appropriate to their jurisdiction.
AMA Group is not licensed to provide financial product advice in respect of AMA Group shares or other securities. Past performance is no guarantee of
future performance.

No representation or warranty, expressed or implied, is made as to the fairness, accuracy, completeness or correctness of the
information, opinions and conclusions contained in this presentation. To the maximum extent permitted by law, none of AMA Group and its related
bodies corporate, or their respective directors, employees or agents, nor any other person accepts liability for any loss arising from the use of this
presentation or its contents or otherwise arising in connection with it, including, without limitation, any liability from fault or negligence on the part of
AMA Group, its related bodies corporate, or any of their respective directors, employees or agents.

This presentation may contain forward-looking statements including statements regarding our intent, belief or current expectations with respect to AMA
Group’s business and operations, market conditions, results of operations and financial condition, specific provisions and risk management practices.
When used in this presentation, the words ‘likely’, ‘estimate’, ‘project’, ‘intend’, ‘forecast’, ‘anticipate’, ‘believe’, ‘expect’, ‘may’, ‘aim’, ‘should’, ‘potential’
and similar expressions, as they relate to AMA Group and its management, are intended to identify forward-looking statements. Forward looking
statements involve known and unknown risks, uncertainties and assumptions and other important factors that could cause the actual results,
performances or achievements of AMA Group to be materially different from future results, performances or achievements expressed or implied by such
statements. Readers are cautioned not to place undue reliance on these forward-looking statements, which speak only as of the date thereof.
Page 4

Contents.

AMA Group Overview                            Page 5

AMA Group Financial Information for H1 2021   Page 9

Divisional Performance                        Page 16

Strategy and Outlook                          Page 20

Other Information                             Page 27
Page 5

AMA GROUP
 OVERVIEW
Page 6

H1 2021 Highlights.

•   Total Group revenue and other income of $434.2 million

•   Normalised EBITDAI of $46.1 million with a Normalised EBITDAI margin of 9%

•   Strong operating cashflows and cash conversion

•   The Group de-levered by $76 million

•   Net Debt at 31 December 2020 was $151.1 million (undrawn availability $55.2 million)

•   All Banking Covenants met

•   Completion of the sale of the majority of the ACAD businesses for $70 million

•   Hold on dividends (revisit at full year)
Page 7

H1 2021 Answers before questions.

•   Normalisations
     – Limited to the Capital SMART paint agreement termination fee of $9.4 million

•   JobKeeper
     – Funding received of $30.7 million fully paid out in wages support to retain people capacity

•   Vehicle Repair volume impacted by COVID-19
     – Vehicle Panel Repairs have seen an average decline in volume of 27% compared to PCP
     – The Group excluding Victoria experienced an average decline in volume of 16% compared
       to prior period
     – Individual state impacts were a decline in volume as follows: VIC 48%, NSW 18%, NZ 17%,
       QLD 15%, WA 12%, SA 8% and ACT 7%
     – Victoria was impacted the most (48% decline), as a result of longer and more severe
       Government imposed restrictions
Page 8
H1 2021 Operations highlights.
• Capital SMART integration
– Paint supplier transition substantially complete (2x NZ sites remaining at end of
December due to travel constraints)
– Transition to direct sourced consumables complete
– $17 million of FRR annual synergies on track to be realised as normal vehicle repair
volumes resume across all sites
• Two acquisitions completed
– Western Trucks (our 8th Heavy Motor site)
– Perth Brake Parts (ACM Parts geographic expansion to the West Coast)Page 9
AMA GROUP
FINANCIAL INFORMATION
FOR H1 2021Page 10
Summary Financial Performance (Pre-AASB 16).
SUMMARY FINANCIAL PERFORMANCE HY 2021 HY 2020 CHANGE
FOR THE YEAR ENDED 31 DECEMBER PRE-AASB 16 PRE-AASB 16
• Increase in revenue and
AUD $'000 AUD $'000 AUD $'000 %
operating profit is largely due
to the benefit of a full six
Revenue and other income from continuing operations 434,228 364,085 70,143 19.3% months trading for
Raw materials and consumables used (200,556) (163,663) (36,893) 22.5% acquisitions such as Capital
SMART and ACM Parts.
Employment benefits expense (142,911) (145,301) 2,390 (1.6%)
Occupancy expense (36,493) (29,268) (7,225) 24.7% • Normalisations for the period
were $9.4m – this relates to
Supplier termination fee (9,437) - (9,437) 100.0%
the paint supplier termination
Professional services expense (3,310) (10,026) 6,716 (67.0%) fee. The supplier termination
Other expense (11,853) (8,386) (3,467) 41.3% fee was incurred as a result of
Earnings before interest, tax, depreciation, amortisation, 29,668 7,441 22,227 298.7% Capital SMART’s paint
impairment and fair value adjustments ("EBITDAI") transition to BASF, which is
Fair value adjustments on contingent vendor consideration (5,398) (708) (4,690) 662.4% substantially complete.
Depreciation and amortisation expense (20,616) (11,117) (9,499) 85.4% • Normalised EBITDAI includes
Impairment expense (1,950) - (1,950) 100.0% the contribution from the
Operating profit / (loss) before interest and tax 1,704 (4,384) 6,088 (138.9%) disposed businesses (ACAD
and Fully Equipped for H1)
Finance costs (6,002) (3,419) (2,583) 75.5% but does not include the
Loss before income tax from continuing operations (4,298) (7,803) 3,505 (44.9%) accounting gain on disposal.
Income tax (expense) / benefit (2,248) 941 (3,189) (338.8%)
• “Historical” normalisations
Profit / (loss) from discontinued operations 14,422 (1,763) 16,185 (918.0%) significantly reduced.
Profit / (loss) for the period 7,876 (8,625) 16,501 (191.3%)
• No normalisations for the
COVID-19 pandemic.
Normalisations 9,437 11,016 (1,579) (14.3%)
ACAD and Fully Equipped businesses sold on 31 December 2020 6,971 3,291 3,680 111.8%
Normalised EBITDAI (Pre-AASB 16) 46,076 21,748 24,328 111.9%
Normalised EBITDAI Margin on continuing operations % 9.0% 5.1% 3.9% 77.6%Page 11
Statutory Financial Performance.
HY 2021 STATUTORY RESULTS HY 2021 HY 2020 CHANGE
FOR THE PERIOD ENDED 31 DECEMBER STATUTORY STATUTORY • Results include full six months
AUD $'000 AUD $'000 AUD $'000 % trading for acquisitions such
as Capital SMART and ACM
Parts.
Revenue and other income from continuing operations 435,099 364,085 71,014 19.5%
Operating profit / (loss) before interest and tax 7,098 (1,613) 8,711 (540.0%) • Financial performance
impacted by:
Loss before income tax from continuing operations (8,685) (12,412) 3,727 (30.0%)
Profit / (loss) for the period 4,617 (12,272) 16,889 (137.6%) • The COVID-19 pandemic,
although largely offset by
Profit / (loss) attributable to members of AMA Group Limited 5,827 (11,602) 17,429 (150.2%)
operational actions and
Government wage
Basic EPS (Cents) - continuing operations (1.15) (1.36) 0.21 (15.4%) subsidies (contribution of
$30.7 million)
• Supplier termination fee
of $9.4 million relating to
Capital SMART’s paint
transition (non-recurring).
• Adoption of AASB 16
Leases which impacted
NPAT by $3.3 million.
Note: Prior comparative information (for P&L only) has been re-presented in accordance with accounting standards. The comparative
results of discontinued operations (e.g., sale of ACAD and Fully Equipped businesses) have been re-presented to Profit / (loss) from
discontinued operationsPage 12
Summary Financial Position.
SUMMARY FINANCIAL POSITION HY 2021 FY 2020 CHANGE
AS AT 31 DECEMBER AND 30 JUNE STATUTORY STATUTORY
AUD $'000 AUD $'000 AUD $'000 % • Financial position is impacted
by the divestment of ACAD
Cash and cash equivalents 86,397 112,916 (26,519) (23.5%) and Fully Equipped which has
impacted items such as:
Other current assets 90,739 124,476 (33,737) (27.1%)
Non-current assets 1,078,083 1,150,229 (72,146) (6.3%) • Cash and debt have both
decreased as a result of
Total assets 1,255,219 1,387,621 (132,402) (9.5%)
$102.5 million repayment
of debt from sale
Current liabilities 203,347 223,897 (20,550) (9.2%) proceeds and cash.
Bank loan, net of capitalised borrowing costs 234,096 335,942 (101,846) (30.3%) • Impact to other items
Other non-current liabilities 460,292 484,762 (24,470) (5.0%) such as working capital
Total liabilities 897,735 1,044,601 (146,866) (14.1%) (e.g. inventory)
• Fixed assets of $63.3
Net Assets 357,484 343,020 14,464 4.2% million between PPE,
Intangibles and ROU
Assets.
Contributed equity 425,404 417,117 8,287 2.0%
Reserves 2,436 880 1,556 176.8%
Retained deficit (85,491) (91,318) 5,827 (6.4%)
Non-controlling interest 15,135 16,341 (1,206) (7.4%)
Equity 357,484 343,020 14,464 4.2%Page 13
AMA Delevered during H1 2021.
NET DEBT HY 2021 FY 2020 CHANGE
AS AT 31 DECEMBER AND 30 JUNE STATUTORY STATUTORY
AUD $'000 AUD $'000 AUD $'000 %
Financial liabilities - drawn cash facilities 237,500 340,000 (102,500) (30.1%)
Cash and cash equivalents (86,397) (112,916) 26,519 (23.5%)
Net debt 151,103 227,084 (75,981) (33.5%)
Contingent vendor consideration - 50% 20,494 24,731 (4,237) (17.1%)
Net debt used in covenant calculations 171,597 251,815 (80,218) (31.9%)
• The Group's liquidity remains strong, with net debt of $151.1 million, and $55.2 million of undrawn facilities.
• The Group used sale proceeds from the ACAD and Fully Equipped divestment to deleverage during the period.
• During the period, the Group also made acquisition and earnout payments of $6.5 million.
• All Banking Covenants have been met.Page 14
Summary Cash Flows.
SUMMARY CASH FLOWS HY 2021 HY 2020 CHANGE
FOR THE PERIOD ENDED 31 DECEMBER STATUTORY STATUTORY
AUD $'000 AUD $'000 AUD $'000 %
• ACAD and Fully Equipped
Receipts from customers (inclusive of GST) 530,867 450,623 80,244 17.8% group of businesses
Payments to suppliers and employees (inclusive of GST) (471,321) (426,797) (44,524) 10.4% disposed for gross
Market incentive received (inclusive of GST) - 59,510 (59,510) (100.0%) proceeds of c. $70
Interest received 209 169 40 23.7% million, including earn out
Interest and other costs of finance paid (13,179) (11,558) (1,621) 14.0% of $2.1 million.
Income taxes paid (3,481) (8,687) 5,206 (59.9%)
• Repaid $102.5 million of
Net cash flows provided by operating activities 43,095 63,260 (20,165) (31.9%)
gross debt.
Proceeds from sale of property plant and equipment 259 - 259 100.0% • Payment for businesses
Proceeds from disposal of business (net of costs and cash disposed) 63,128 - 63,128 100.0% acquired and earn-outs
Payments for purchases of property plant and equipment (7,641) (5,142) (2,499) 48.6% for HY 2021 were $6.5
Payments for intangible assets (191) (53) (138) 260.4% million.
Payments for businesses acquired (including earn-outs) (6,543) (432,849) 426,306 (98.5%)
• On a pre-AASB 16 basis
Cash acquired through business combinations - 19,170 (19,170) (100.0%)
(excluding amortisation of
Net cash flows used in investing activities 49,012 (418,874) 467,886 (111.7%) market incentive), cash
flow conversion to pre-
Proceeds from borrowings - 326,000 (326,000) (100.0%) AASB 16 is circa 100%.
Repayment of borrowings (102,500) (116,568) 14,068 (12.1%)
Principal elements of lease payments (16,241) (11,962) (4,279) 35.8% • Cash flows presented on
Payment of new borrowings transaction costs - (4,817) 4,817 (100.0%) a group basis (includes
Equity raised (net of transaction costs) - 208,711 (208,711) (100.0%) continuing and
Dividends paid to AMA shareholders - (9,310) 9,310 (100.0%) discontinued operations).
Dividends paid to non-controlling shareholders - (169) 169 (100.0%)
Net cash flows provided by financing activities (118,741) 391,885 (510,626) (130.3%)
Net (decrease) / increase in cash and cash equivalents (26,634) 36,271 (62,905) (173.4%)
Cash and cash equivalents at the end of period 86,397 48,510 37,887 78.1%Page 15
Effects of AASB 16 – Leasing Standard.
SUMMARY FINANCIAL PERFORMANCE HY 2021 AASB 16 HY 2021
FOR THE PERIOD ENDED 31 DECEMBER STATUTORY ADJUSTMENT PRE-AASB 16
AUD $'000 AUD $'000 AUD $'000 • The Group adopted the new lease
accounting standard AASB 16 Leases from
1 July 2019.
Revenue and other income from continuing operations 435,099 (871) 434,228
Raw materials and consumables used (200,556) - (200,556) • Statutory results are directly comparative
as both are on a post-AASB 16 basis.
Employment benefits expense (142,911) - (142,911)
Occupancy expense (11,311) (25,182) (36,493) • AASB 16 Leases has had a material negative
impact ($3.3 million) on AMA Group’s
Supplier termination fee (9,437) - (9,437) statutory results, including:
Professional services expense (3,310) - (3,310)
• Substantial decrease in occupancy
Other expense (11,853) - (11,853) expense.
Earnings before interest, tax, depreciation, amortisation, 55,721 (26,053) 29,668
impairment and fair value adjustments ("EBITDAI") • Substantial increase in depreciation
and finance costs.
Fair value adjustments on contingent vendor consideration (5,398) - (5,398)
Depreciation and amortisation expense (41,275) 20,659 (20,616) • Impact to net profit after tax and
earnings per share.
Impairment expense (1,950) - (1,950)
• No cash impact.
Operating profit before interest and tax 7,098 (5,394) 1,704
Finance costs (15,783) 9,781 (6,002)
Loss before income tax from continuing operations (8,685) 4,387 (4,298)
Income tax expense (932) (1,316) (2,248)
Profit from discontinued operations 14,234 188 14,422
Profit for the period 4,617 3,259 7,876Page 16 DIVISIONAL PERFORMANCE
Page 17

Vehicle Panel Repairs – Trading Performance.
SUMMARY FINANCIAL PERFORMANCE                               HY 2021       HY 2020              CHANGE
FOR THE PERIOD ENDED 31 DECEMBER                            AUD $'000     AUD $'000     AUD $'000       %

Revenue and other income from continuing operations            405,732       352,105        53,627          15.2%

EBITDAI                                                         56,609        37,894        18,715          49.4%
AASB 16 Leases impact to occupancy costs and other income      (24,273)      (17,898)       (6,375)         35.6%
Pre-AASB 16 EBITDAI                                             32,336        19,996        12,340          61.7%

Normalisations                                                    9,437         1,729         7,708     445.8%
Normalised EBITDAI                                              41,773        21,725        20,048          92.3%
Normalised EBITDAI Margin %                                       10.3%          6.2%          4.1%         66.1%

Highlights and Trading Performance
• Increase in revenue and EBITDAI is largely due to the benefit of a full six months trading for acquisitions such as Capital SMART and the additional
  9 sites acquired in the prior half-year (HY 2020).

• Heavy Motor continues to be a strong contributor to AMA Panel. Heavy Motor contributed 15% of AMA Panel’s EBITDA (compared to 10% of
  AMA Panel’s EBITDA in prior comparative period).

• Capital SMART’s paint and consumables integration is substantially complete. Capital SMART is well positioned to achieve its synergy targets in
  H2 (as volumes fully return to pre COVID-19 levels).

• AMA Panel’s revised terms from insurer customers have provided profitability improvement.

• Vehicle Panel Repairs received circa $28 million in Government wage subsidies. These subsidies allowed us to support our workforce through this
  difficult trading period and have enabled the Group to make a faster recovery once community movement restrictions were eased.
Page 18

Vehicle Panel Repairs – National Footprint.
                                                          VEHICLE PANEL REPAIR SITE LOCATION   HY DEC-20    FY JUN-20

                                                          Victoria                                66           65
                                                          Queensland                              35           34
                                                          Western Australia                       14           14
                                                          New South Wales                         37           38
                                                          Australian Capital Territory            9            9
                                                          South Australia                         6            6
VEHICLE PANEL REPAIR SITE COUNT   HY DEC-20   FY JUN-20
                                                          Tasmania                                9            9
                                                          New Zealand                             6            6
Opening Balance                     181         130

                                                          Closing Balance                        182          181
 Acquired                            1           61
 Greenfields                         1           2
 Disposed or consolidated            (1)        (12)
                                                          VEHICLE PANEL REPAIR SITE TYPE       HY DEC-20    FY JUN-20
Closing Balance                     182         181
                                                          Prestige                                6            6
                                                          Exclusive                               84           83
                                                          Traditional                             81           82
                                                          Mechanical                              3            3
                                                          Heavy Motor                             8            7

                                                          Closing Balance                        182          181
Page 19 APAS (Automotive Parts and Services) – Trading performance. SUMMARY FINANCIAL PERFORMANCE HY 2021 HY 2020 CHANGE FOR THE PERIOD ENDED 31 DECEMBER AUD $'000 AUD $'000 AUD $'000 % Revenue and other income from continuing operations 29,259 11,907 17,352 145.7% EBITDAI 3,366 (142) 3,508 (2,470.4%) AASB16 adjustment for other income and occupancy costs (1,780) (548) (1,232) 224.8% Pre-AASB 16 EBITDAI 1,586 (690) 2,276 (329.9%) Normalisations - 83 (83) (100.0%) Normalised EBITDAI 1,586 (607) 2,193 (361.3%) Normalised EBITDAI Margin % 5.4% (5.1%) 10.5% (205.9%) Highlights and Trading Performance • The above results are for continuing operations only (ACM Parts and FluidDrive). Discontinued operations (ACAD and Fully Equipped group of businesses) contributed $7.0 million Normalised EBITDAI at 17% Normalised EBITDAI margin. • Increase in revenue is largely due to the benefit of a full six months trading for ACM Parts. The revenue and other income set out above is in relation to external customers only. However, a focus for ACM Parts in the past 12 months has been to increase sales into the Vehicle Panel Repairs Division, benefiting the bottom-line in that division. • ACM Parts expanded into Western Australia through the acquisition of Perth Brake Parts on 30 October 2020. • ACM Parts has been profitable during the period, including accounting for warehousing of consumables (previously funded by AMA Panel). • Now that ACAD and Fully Equipped have been sold, the key areas of focus in H2 2021 are to explore further synergies between ACM Parts and FluidDrive, and identify incremental revenue opportunities for both businesses.
Page 20

STRATEGY AND OUTLOOK
Page 21

Strategy.

•   Growth – organic
     – Selling the benefits of the Group’s unique value proposition – SMART (low severity) to Heavy
       Hit (high severity) – extensive and expanding geographic coverage, high quality cost effective
       repair solutions - across multiple vehicle types
     – The constantly evolving auto insurance market and Australasian car park present a steady flow
       of opportunity for a well capitalised market leader
     – Expansion of the Parts sourcing and distribution business – to serve both internal and external
       customers

•   Growth – acquisitions
     –   Live pipeline of opportunity – circa $100 million of near-term revenue
     –   Additional SMART locations
     –   Additional Panel locations – targeted areas of focus: prestige, non driveable, high severity
     –   Additional Heavy Motor vehicle sites

         Substantial opportunity in a market size estimated to be $6-7 billion
Page 22
Strategy.
• Margin expansion through sourcing
– Direct sourcing and distribution – consumables, parts
– Indirect spend – combined volumes of a circa 180 sites / 3700 staff business
• Operational excellence - reduce costs and lift margins
– Capacity utilisation
– Labour productivity
– Unlock and realise synergies
– Paint and consumables yields
– Repair vs replace
– ADAS recalibration capability development (insource)
– Drive branch level performance (benchmarking, people development, best practices)
– Overheads - solar solutions, LED lighting, rent negotiationsPage 23
Operational focus.
• Operational accountability
– Integration of acquisitions into the base business
– Outcome sanity check post integration – ensuring we got what we paid for
– Ensuring efficient site operations – customer commitment volume vs actuals
– Average cost vs actual cost revenue model – proper recoveries for work performed
• People
– Define and consolidate the culture
– Invest, develop and retain key industry skills
– Apprenticeships – build the workforce of the future
– Use scale and culture to attract talent in an industry with skills shortagesPage 24
Governance.
• Transition in leadership style – from Entrepreneurial and Big Picture to Operations
and Outcomes
• Focus on Governance – we are an ASX300 Public Company – what should be in
place, will be
• Enhanced systems, processes and controls – management of the business through
policy and guidelines
• Culture transformation from private operating style to one of Public Company
governance – important as we integrate acquisitions
• Risk assessment and mitigationPage 25
Outlook - Headwinds.
• COVID-19 hangover
– ‘Just because we want it to be over doesn’t make it so’
– Still living with the reality of outbreaks and snap border closures
– Remnants of work from home mandates in place
– Reduced traffic volumes and changing traffic patterns
• Reduced efficiencies as lower volumes affect site productivity and our ability to
realise synergies
• Growing ADAS penetration limiting some collisionsPage 26
Outlook - Tailwinds.
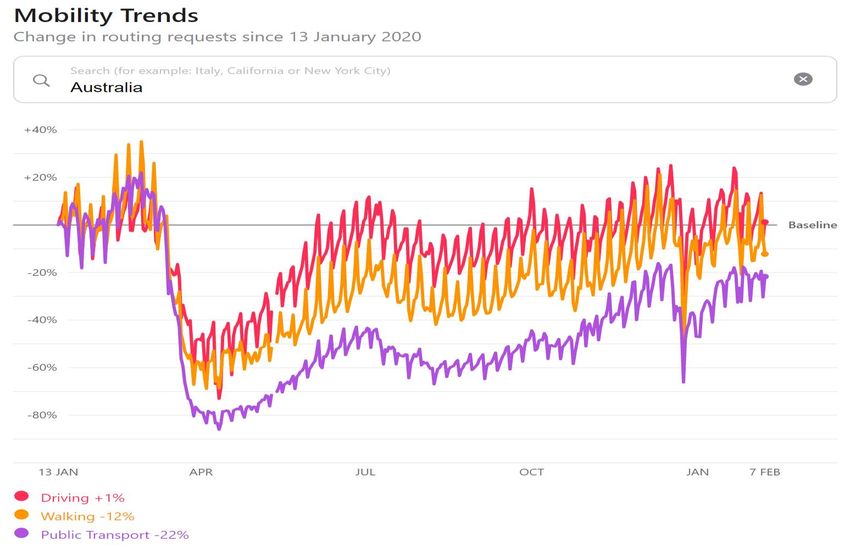
• Reluctance to use public transport will lift traffic volumes as return to work edicts
rise
• Vaccine rollout to hasten return to normal
• Domestic driving holidays increasing kilometres travelled
• Forecast La Niña weather conditions have historically increased repair volumes
• Small independent panel businesses impacted by COVID-19 related trading
conditions – opportunity for industry consolidation increasingPage 27 OTHER INFORMATION
Page 28

Mobility trends - Australia.
Page 29

Scorecard update from FY2020.

                                                                              SUBSTANTIALLY
 Complete BASF paint roll out to all Capital SMART sites                       COMPLETE 1

 Meet Bank Facility undertakings for Q2 2021                                    ACHIEVED

 Continue to drive further scale benefits to deliver additional
 synergies beyond the $17 million run rate identified and on track to           ONTRACK
 be delivered in FY 2021

 Re-establish full network operations in all States as soon as COVID-
                                                                                COMPLETE
 19 restrictions relaxation allows volumes to fully return

 Return to pre-COVID acquisition pace targeting annual acquired
                                                                                ONTRACK
 revenues of circa $100 million

Note 1: 2x NZ sites remaining at end of December due to travel constraints.
Page 30
Normalisations.
NORMALISATIONS HY 2021 HY 2020 CHANGE
AUD $'000 AUD $'000 AUD $'000 %
• Normalisations for the
Supplier termination fee 9,437 - 9,437 100.0% period were $9.4 million
Acquisition costs - 8,508 (8,508) (100.0%) which represents the
Restructuring and reorganisation costs - 1,999 (1,999) (100.0%)
Capital SMART paint
supplier termination fee.
Integration costs - 321 (321) (100.0%)
Other costs - 188 (188) (100.0%) • Normalised EBITDAI
includes the contribution
Total normalisations 9,437 11,016 (1,579) (14.3%) from the disposed
businesses (ACAD and Fully
Pre-AASB 16 EBITDAI 29,668 7,441 22,227 298.7% Equipped) but does not
ACAD and Fully Equipped businesses sold on 31 December 2020 6,971 3,291 3,680 111.8% include the accounting gain
on disposal.
Normalised EBITDAI 46,076 21,748 24,328 111.9%
• Normalisations have been
significantly reduced and
% of normalisations 20.5% 50.7%
only relate to the
acquisition of Capital
SMART.
• There are no
Normalisations for the
impact of the COVID-19
pandemic.Page 31 Acquisitions and Divestments. ACQUISITIONS # SITES DATE Vehicle Panel Repairs Western Trucks 1 25-Sep-20 Automotive Parts and Accessories Perth Brake Parts N/A 30-Oct-20 DIVESTMENTS # SITES DATE Automotive Parts and Accessories ACAD Limited N/A 31-Dec-20 AECAA Pty Ltd N/A 31-Dec-20 ECB Pty Ltd N/A 31-Dec-20 Service Body Manufacturing Australia Pty Ltd N/A 31-Dec-20 Uneek 4x4 Australia Pty Ltd N/A 31-Dec-20 AMA Fully Equipped NZ Holdings Pty Limited N/A 31-Dec-20 Fully Equipped Auckland Limited N/A 31-Dec-20 Fully Equipped Group Limited N/A 31-Dec-20 Fully Equipped Limited N/A 31-Dec-20 Fully Equipped Wellington Limited N/A 31-Dec-20 Tuff Accessories Limited N/A 31-Dec-20
You can also read