Epstein-Barr virus inactivates the transcriptome and disrupts the chromatin architecture of its host cell in the first phase of lytic reactivation ...
←
→
Page content transcription
If your browser does not render page correctly, please read the page content below
Published online 1 March 2021                                                        Nucleic Acids Research, 2021, Vol. 49, No. 6 3217–3241
                                                                                                                    doi: 10.1093/nar/gkab099

Epstein-Barr virus inactivates the transcriptome and
disrupts the chromatin architecture of its host cell in
the first phase of lytic reactivation
Alexander Buschle 1 , Paulina Mrozek-Gorska 1 , Filippo M. Cernilogar 2 ,
Andreas Ettinger 3 , Dagmar Pich1 , Stefan Krebs4 , Bianca Mocanu 1 , Helmut Blum4 ,
Gunnar Schotta 2 , Tobias Straub 5 and Wolfgang Hammerschmidt 1,*
1

                                                                                                                                                                  Downloaded from https://academic.oup.com/nar/article/49/6/3217/6155940 by guest on 22 September 2021
 Research Unit Gene Vectors, Helmholtz Zentrum München, German Research Center for Environmental Health and
German Center for Infection Research (DZIF), Partner site Munich, Germany, Feodor-Lynen-Str. 21,
D-81377 Munich, Germany, 2 Division of Molecular Biology, Biomedical Center, Faculty of Medicine,
Ludwig-Maximilians-Universität (LMU) München, 82152 Planegg-Martinsried, Germany, 3 Institute of Epigenetics and
Stem Cells, Helmholtz Zentrum München, German Research Center for Environmental Health, Feodor-Lynen-Str. 21
D-81377 Munich, Germany, 4 Laboratory for Functional Genome Analysis (LAFUGA), Gene Center of the
Ludwig-Maximilians-Universität (LMU) München, 81377 Munich, Germany and 5 Bioinformatics Unit, Biomedical
Center, Ludwig-Maximilians-Universität (LMU) München, 82152 Planegg-Martinsried, Germany

Received January 06, 2021; Revised February 01, 2021; Editorial Decision February 03, 2021; Accepted February 04, 2021

ABSTRACT                                                                          sive reduction of cellular transcripts and a loss of
                                                                                  chromatin-chromatin interactions of cellular promot-
Epstein-Barr virus (EBV), a herpes virus also termed
                                                                                  ers with their distal regulatory elements as shown
HHV 4 and the first identified human tumor virus,
                                                                                  in Capture-C experiments. Our data document that
establishes a stable, long-term latent infection in hu-
                                                                                  EBV’s lytic cycle induces discrete early processes
man B cells, its preferred host. Upon induction of
                                                                                  that disrupt the architecture of host cellular chro-
EBV’s lytic phase, the latently infected cells turn into
                                                                                  matin and repress the cellular epigenome and tran-
a virus factory, a process that is governed by EBV.
                                                                                  scriptome likely supporting the efficient de novo syn-
In the lytic, productive phase, all herpes viruses en-
                                                                                  thesis of this herpes virus.
sure the efficient induction of all lytic viral genes to
produce progeny, but certain of these genes also re-
press the ensuing antiviral responses of the virally                              INTRODUCTION
infected host cells, regulate their apoptotic death                               Viruses exploit their hosts at the cellular or organismic level
or control the cellular transcriptome. We now find                                to support viral propagation and spread. Towards this end,
that EBV causes previously unknown massive and                                    they also manipulate the infected cellular host with their
global alterations in the chromatin of its host cell                              own toolkit to suppress various antiviral defense mecha-
upon induction of the viral lytic phase and prior to                              nisms. For example, viruses can inhibit several levels of in-
the onset of viral DNA replication. The viral initia-                             terferon responses (1 and references therein), counteract
tor protein of the lytic cycle, BZLF1, binds to >105                              cellular cytidine deaminases with potent antiviral activities
binding sites with different sequence motifs in cel-                              (2), reduce cellular immunity with viral micro RNAs (3), or
lular chromatin in a concentration dependent man-                                 even mimic histone tails to interfere with antiviral responses
                                                                                  of the infected cells (4).
ner implementing a binary molar switch probably to
                                                                                     The manipulation of the host’s antiviral programs is es-
prevent noise-induced erroneous induction of EBV’s                                pecially important for herpes viruses. Commonly, they turn
lytic phase. Concomitant with DNA binding of BZLF1,                               the infected cell into a virus factory, but they can also ini-
silent chromatin opens locally as shown by ATAC-                                  tiate their temporal coexistence in certain cells to establish
seq experiments, while previously wide-open cellular                              long-lasting, non-productive, latent infections. During la-
chromatin becomes inaccessible on a global scale                                  tency, the herpesviral, genomic DNA acquires a genuine
within hours. While viral transcripts increase drasti-                            cellular and highly repressive chromatin signature, which
cally, the induction of the lytic phase results in a mas-                         blocks transcription of most viral genes. Herpes viruses can

* To   whom correspondence should be addressed. Tel: +49 89 3187 1506; Fax: +49 89 3187 4225; Email: hammerschmidt@helmholtz-muenchen.de

C The Author(s) 2021. Published by Oxford University Press on behalf of Nucleic Acids Research.
This is an Open Access article distributed under the terms of the Creative Commons Attribution-NonCommercial License
(http://creativecommons.org/licenses/by-nc/4.0/), which permits non-commercial re-use, distribution, and reproduction in any medium, provided the original work
is properly cited. For commercial re-use, please contact journals.permissions@oup.com
3218 Nucleic Acids Research, 2021, Vol. 49, No. 6

escape from the latent phase and reactivate virus produc-               Much is known about the impact of BZLF1 on the vi-
tion. In this step, herpes viruses instruct their cellular host to   ral genome after induction of EBV’s lytic phase and the
remove the repressive epigenetic signature from viral chro-          ensuing alterations in viral chromatin (18,34), but if and
matin to allow and activate massive viral transcription of all       how herpes viruses in general – and EBV in particular –
lytic viral genes within hours. During lytic reactivation, the       manipulate the chromatin of the host cell during the early
host cell must also be manipulated to provide chemical en-           hours of lytic, productive infection is not known in detail.
ergy, macro-molecules, and nuclear space for the so-called           Therefore, we examined the global modification of the host
viral replication compartments (5,6) or amplification fac-           genome in the lytic, pre-replicative phase of EBV. We chose
tories (7). Additionally, the cell’s transcription machinery         the Raji cell line as our preferred model for one main reason.
needs to be redirected to support an efficient virus de novo         In Raji cells, EBV’s latent phase is very tightly controlled
transcription within a few hours after reactivation. Many            and, upon induction, the majority of the cells readily en-
molecular details of these fundamental processes are un-             ter EBV’s lytic phase. The lytic phase, however, is incom-
known.                                                               plete and does not support the amplification the viral DNA

                                                                                                                                         Downloaded from https://academic.oup.com/nar/article/49/6/3217/6155940 by guest on 22 September 2021
   A ubiquitous human herpes virus is Epstein-Barr virus             because Raji cells carry a defective EBV genome (35–37).
(EBV, HHV4), which infects ∼ 95 % of the human popula-               Thus, Raji cells allow studying the very early modifications
tion. B lymphocytes are the preferred target cells in which          in cellular chromatin in the pre-replicative phase, when the
EBV establishes a latent infection. EBV reactivates from             cells transit from viral latency to lytic reactivation, but prior
this latent state with the help of the viral BZLF1 protein,          to the formation of replication compartments or amplifica-
which is expressed upon differentiation of EBV-infected              tion factories. In EBV-infected cells, the chromatin modifi-
memory B cells to plasma cells (8), and induces the switch           cations become microscopically visible as early as 16–24 h
from latency to EBV’s lytic phase (9,10). BZLF1, also called         after lytic phase induction and are characterized by the lo-
EB1, ZEBRA, zta or Z, is known to act as an essential viral          cal accumulation of EBV DNA and the occlusion of cellu-
transcription and replication factor (9–11). BZLF1 binds             lar chromatin constituents such as histones (7). This report
two classes of DNA binding motifs (ZREs) in the viral                by Chiu et al. also indicated that the nuclear architecture
genome, one of which needs to be methylated to be bound              of the lytic cycle-induced cells undergoes substantial mod-
efficiently (12,13). These sites are termed meZREs or CpG-           ifications prior to the formation of the amplification facto-
ZREs and are mainly positioned in promoters of impor-                ries, with nuclei showing an initial ‘honeycombed’ structure,
tant lytic viral genes (12,14). Upon initial infection during        suggestive of an early reorganization of the cellular chro-
EBV’s pre-latent phase (15), BZLF1 is transiently expressed          matin or nuclear 3D architecture.
(14,16), but it does not bind its many viral meZREs because             BZLF1 and certain members of the cellular AP-1 tran-
the incoming viral DNA is free of methylated CpG dinu-               scription factor family are structurally and functionally
cleotides (17). As a consequence, the virus cannot activate          similar. It seems therefore plausible that BZLF1 may take
its lytic promoters in the pre-latent phase, but it rather initi-    part in manipulating the chromatin and transcriptome of
ates its latent program, which leads to the restricted expres-       its cellular host during viral reactivation and the subsequent
sion of the few latent viral genes only. CpG methylation of          lytic phase. Our focus was to detect global changes within
viral DNA is a slow process in newly infected primary B              EBV’s host cell upon induction of the lytic cycle. There-
cells that takes several weeks to completion (18), but CpG           fore, we considered the possible role of BZLF1 in induc-
methylation further supports the epigenetic silencing of all         ing modifications with respect to the cell’s transcriptome,
viral lytic genes (19). It is likely that EBV uses this strat-       chromatin accessibility, and chromatin-chromatin interac-
egy to prevent the premature expression of its lytic genes in        tions. To investigate these cellular processes when BZLF1
newly infected cells, which would induce a massive antiviral         is expressed in the absence of other viral proteins, we also
immune response of EBV-specific T cells and would readily            included DG75 – an EBV-negative B cell line – in our
eliminate the virus-infected cells (20).                             studies.
   BZLF1 is a homo-dimeric bZIP transcription factor. Its               We discovered that the induction of BZLF1 induces
DNA binding domain shows a strong homology to the cel-               global alterations in the host cell transcriptome and chro-
lular AP-1 protein family including the Jun, Fos, Fra, and           matin within 6–15 h. We found (i) an up- and down-
ATF subfamilies. AP-1 binding motifs and ZREs are re-                regulation of cellular RNA causing considerable transcrip-
lated sequences of about seven nucleotides (21,22). Similar          tional noise, (ii) a prevalent reduction or even collapse of
to BZLF1, c-Jun/c-Fos hetero-dimers can also bind to and             chromatin-chromatin interactions, concomitant with a gen-
regulate cellular genes via methylated DNA motifs, which             eral reduction of open, accessible chromatin compared to
are related to meZRE motifs of BZLF1 (23). Collectively,             non-induced cells and (iii) a localized opening of chromatin
these findings suggest that BZLF1 may widely influence cel-          at the majority of about 105 cellular BZLF1 binding sites.
lular transcription since several hundred thousand motifs            These changes were generally more pronounced in Raji cells
of members of the AP-1 family are known in the genome                than in the EBV-negative DG75 cells. Only in EBV-positive
of mammalian cells (24), some of which are located in en-            Raji cells we detected a global and impressive reduction
hancers (25–29). AP-1 family members participate in reg-             of cellular transcripts, indicative of the virus-induced host
ulating genes involved in cellular proliferation, differenti-        shut-off. Together, these findings document that the host
ation, and apoptosis (30–33) – pathways which EBV also               cell is subject to global nuclear changes already in the pre-
manipulates in its pre-latent, latent, and lytic phases.             replicative phase of the virus’ lytic cycle.
Nucleic Acids Research, 2021, Vol. 49, No. 6 3219
MATERIALS AND METHODS For BZLF1 expression level analysis 2.5 × 10⁶ DG75,
Eukaryotic cell lines B95-8 cells, non-induced Raji iBZLF1 cells or Raji iB-
ZLF1 cells induced for 6 h were lysed in RIPA buffer
The cell lines B95-8 (EBV-positive) (38), DG75 (EBV- and sheared with the BioRuptor (Diagenode) four times
negative) (39) and Raji (EBV-positive) (40) and their deriva- (5 min, 30 on/off, high) in ice cold water. 5× Laemmli
tives were cultured in RPMI 1640 medium (Life Tech- loading buffer containing 15 % DTT (1 M) and 0.75 %
nologies) supplemented with 1 mM sodium pyruvate (Life beta-mercaptoethanol were added to the lysates. Aliquots
Technologies), 100 g/ml streptomycin, 100 units/ml peni- of these lysates corresponding to different cell numbers were
cillin (Life Technologies) and 8 % fetal bovine serum (FBS) loaded onto 14 % SDS-PAGE gels and analysed by Western
(Bio&Sell GmbH) in an atmosphere with 5 % CO2 , 95 % hu- blot immune detection. BZLF1 was detected with the BZ1
midity at 37 ◦ C. 1 (0,4) g/ml puromycin (Invitrogen) was antibody (45), which was used at a 1:50 dilution in combina-
added to Raji (DG75) cells to select for the maintenance of tion with a secondary anti-mouse HRP antibody (1:10 000,
oriP plasmids with two conditional doxycycline-inducible Cell Signaling #7076S). ECL Select (GE Healthcare) was
Downloaded from https://academic.oup.com/nar/article/49/6/3217/6155940 by guest on 22 September 2021
BZLF1 alleles: iBZLF1 full-length (p4816) and iBZLF1 used for signal detection and bands were quantified with a
AD-truncated (p5694) encode the wild-type BZLF1 and the Fusion FX (VILBER) system. Calculation and visualisa-
activation domain (AD)-truncated alleles, respectively. On tion of BZLF1 dimers was done with R (46).
average, the cells were kept at a density of 5×10⁵ cells/ml.
HEK 293 cells (41) were kept at a confluency of ∼ 70 %.
HEK 293 cells that produce the EBV strain wt/B95.8 (2089) Intracellular BZLF1 staining
upon induction were cultivated with 100 ng/ml hygromycin For the intra-cellular staining of BZLF1 Fix & Perm perme-
as described (42). The 9G10 HEK293 cell line carries a re- abilisation Kit (Invitrogen) was used. 1×10⁶ cells were cen-
combinant EBV genome, which encodes puromycin resis- trifuged (300 g, 10 min) and washed with 100 l PBS. 100
tance, but lacks the gene encoding green fluorescent protein l of Kit reagent A were added (15 min, in the dark). Sam-
(GFP). The cells were stably transduced with a retroviral ples were washed with 2 ml wash buffer (PBS, 50 % FBS,
vector that encodes BZLF1 fused to the hormone binding 0.1 % NaN3 ) before 100 l Kit reagent B was added. 1 l
domain variant ERT2 of the human estrogen receptor. The BZ1 antibody (45) coupled with Alexa647 was added before
cells were cultivated in the presence of 1 g/ml puromycin. vortexing (2 s) and incubation (20 min, RT, in the dark).
Samples were washed with 2 ml wash buffer and taken up
in 0.5 ml wash buffer afterwards for flow cell analysis (BD
Plasmids Fortessa).
The doxycycline-inducible BZLF1-expressing plasmids
p4816 and p5694, which encode full-length iBZLF1 and the Virus titration
activation domain (AD)-truncated iBZLF1 respectively, are
The 2089.2.22.7 version of HEK 293 cells stably transduced
described in Woellmer et al. (18). The two plasmids also ex-
with the maxi-EBV plasmid p2089 releases the EBV strain
press the green fluorescent protein (GFP) upon doxycycline
wt/B95.8 (2089) upon BZLF1 expression (42). This cell line
addition (43). The BZLF1 plasmid p3928 expresses a trun-
was transfected with the inducible iBZLF1 expression plas-
cated BZLF1 (aa 149–245) with an amino-terminal tan-
mid p4816 and selected with 500 ng/ml puromycin (34).
dem step-tag as described (44). The retroviral vector plas-
4×10⁵ HEK 293 2089 cells were induced with 25, 100 or 200
mid termed p7087.1 encodes BZLF1:ERT2.
ng doxycycline/ml for three days or the cells were left non-
induced as a control. The supernatants were filtered through
a filter with a pore size of 1.2 m and 25, 50 or 100 l were
Quantitative BZLF1 expression analysis
used to infect 105 parental Raji cells. GFP positive Raji cells
BZLF1 protein was purified from HEK 293 cells transiently (Green Raji units) were identified via flow cell analysis as
transfected with the BZLF1-strep-tag expressing plasmid described in detail (47). The virus concentrations were cal-
p3928 for 48 h. Cells were lysed in RIPA buffer (1 % NP- culated and visualised with R.
40, 0.1 % SDS, 0.5 % sodium deoxycholate, 150 mM NaCl,
50 mM Tris–HCl pH 8.0, 1× proteinase inhibitor cock-
Analysis of cytoplasmic and nuclear BZLF1 signals and
tail (Roche)), incubated (20 min) and sheared on ice with
plasma membrane-associated gp350 in the 9G10 HEK293
a Branson sonifier 250-D (10 s on/50 s off, 1 min, 20 %
cell line upon tamoxifen induction
amplitude). The lysates were centrifuged (15 min, 16 000 g,
4 ◦ C) and the supernatants were purified with IBA Strep- Sample preparation. Round 18 mm coverslips were trans-
Tactin sepharose beads (IBA, 2-1201-002) on Poly-Prep ferred to individual wells of a 12-well cluster plate and incu-
Chromatography Columns (731-1550, BioRad) with IBA’s bated with 80 % EtOH (5 min) for sterilization. After dry-
buffer’s W (washing) and E (elution). The concentration of ing, the coverslips were coated with 1 ml of a 0.01 % poly-L-
purified protein was determined by Coomassie staining of lysine solution (diluted in H2 O) for 5 min. Poly-L-lysine was
14 % gels after SDS-PAGE with BSA standards obtained removed and the coverslips were washed twice with sterile
from the Pierce BCA protein assay kit (23209, Thermo water and dried for 2 h.
Fisher Scientific). The purified BZLF1 protein was used as 2×10⁵ 9G10 cells were seeded onto a poly-L-lysine treated
a quantitative standard and reference for subsequent West- coverslip in a single well of a 12-well cluster plate and incu-
ern blot analyses. bated for at least 8 h to allow cellular adherence. The cells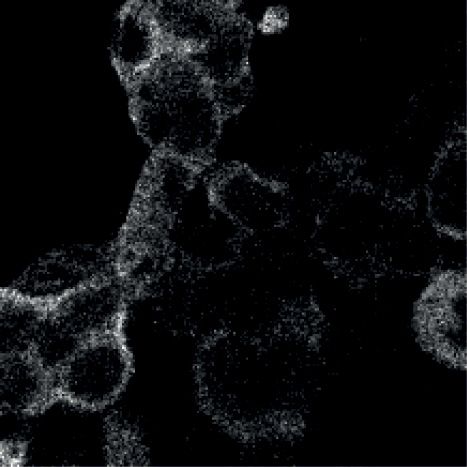
3220 Nucleic Acids Research, 2021, Vol. 49, No. 6
were induced in 2 ml induction medium (D-MEM without Subsequently, we combined the cell segmentation result
supplements) for 12 and 72 h with tamoxifen in the follow- and the output of the N-scale Morphological Watershed
ing concentrations [nM]: 0, 5, 10, 20, 40, 80, 160, 320, 640, filter with the StarDist nuclear label. We only considered
1000. objects as nuclei if the area was larger than 500 px2 (cor-
responding to 17.8 micron2 ) and smaller than 15,000 px2
Immunofluorescence analysis. The coverslips were washed (corresponding to 535.8 micron2 ) to remove cell fragments,
with 1 ml PBS prior to adding 500 l fixation buffer (4 % speckles and dirt and/or wrongly classified larger objects,
PFA in PBS; 20 min, RT). Cell were washed again with 1 ml respectively, from our analysis. Subsequently, we identified
PBS, permeabilised with 500 l 0.3 % Triton in PBS (RT, 20 matching cell-nuclei pairs by a global distance map that
min) and blocked twice in 500 l 3 % BSA with 0.1 % Triton excluded pairs of >100 px distance (>18.0 micron), fol-
in PBS (RT, 10 min). The coverslips were transferred onto lowed by individually testing whether a nucleus lies within
parafilm in a humidified chamber. Subsequently, a single a cell region. Finally, from matching nuclei and cell objects,
coverslip was covered with 150 l staining buffer (PBS, 1 % we constructed masks to measure BZLF1 and gp350 in-
Downloaded from https://academic.oup.com/nar/article/49/6/3217/6155940 by guest on 22 September 2021
BSA, 0.1 % Triton) containing 0.5 l anti-BZ1-Alexa 647, tensity parameters in the nucleus, cytoplasm or at the cell
anti-CD147-Alexa 488 (9G2), anti-gp350-Alexa 568 (6G4) border, the latter representing a dilated outline around the
and 1 l DAPI (10 mg/ml) and incubated (RT, 2 h, in the cell object. Data were saved in csv format for further data
dark). Coverslips were transferred to wells of 12-well clus- analysis.
ter plates containing 1 ml 1 % BSA, 0.1 % Triton in PBS.
Cells were washed 5 times with 1 ml 1 % BSA, 0.1 % Triton Data analysis. Data processing and visualisation was con-
and 3 times with 1 ml PBS. The coverslips were embedded in ducted in R. All samples were analysed separately regarding
Mowiol and sealed with nail polish after Mowiol hardened replicate, tamoxifen concentration and time point. These
over night. sets were size sampled to the smallest number of cells anal-
ysed from the four replicates to continue with an identi-
Microscopy. Images were acquired on a Leica SP8 confo- cal number of sampled cells per replicate. Subsequently, the
cal microscope with a Plan Apochromat 40× NA 1.3 oil mean signal intensities were calculated based on the inten-
immersion objective. Laser power was adjusted to obtain sity values of single cells regarding cytoplasm, nucleus and
signal intensities within the dynamic range of the detector. membrane within each replicate. All non-induced samples
Typical settings were as follows: DAPI signal was acquired were set to 1 and all other signal intensities were normalised
with a 405 nm diode laser at 0.8 % on a photo-multiplier accordingly. The mean of four replicates was plotted to-
with a detection window set to 410–475 nm and voltage gain gether with the standard error for each concentration.
at 768 V and 0.1 % offset. Alexa 488 signal was acquired on
a Hybrid Detector with the white light laser set to 488 nm
Next generation ChIP-sequencing
at 2.5 %, a detection window of 494–562 nm and a time gate
of 0.3–6 ns. Alexa 568 signal was acquired on a Hybrid De- For immuno-precipitation, two samples with 1×10⁸ cells
tector with the white light laser set to 568 nm at 3.5 %, a each were adjusted to a concentration of 5×10⁵ cells/ml in
detection window of 573–641 nm and a time gate of 0.4– fresh medium and were left non-induced or were induced
6 ns. Alexa 647 signal was acquired on a Hybrid Detector with a final concentration of 100 ng/ml doxycycline (Sigma-
with the white light laser set to 647 nm at 1.0 %, a detection Aldrich) for 15 h. Nuclei were extracted with hypotonic
window of 653–773 nm and a time gate of 0.5–6 ns. DAPI buffer (10 mM KCl, 340 mM sucrose, 1.5 mM MgCl2 , 10
and Alexa 647 channels were acquired simultaneously, the mM HEPES pH 7.9) containing 10 % proteinase inhibitor
other channels separately. We scanned images at 0.75 zoom cocktail (PIC, Roche) and lysed in RIPA buffer + 1× PIC.
factor, 2048 × 2048 pixels, 400 Hz, at 2× line averaging and The chromatin was shared in a BioRuptor on wet ice (4
in bi-directional scan mode, yielding an effective pixel size cycles, 5 min each, 30 on/off, high). The chromatin was
of 189 nm. Depending on the number of cells per field of immuno-precipitated with the BZ1 antibody (45), 10 % in-
view, 15–30 images were acquired per experimental condi- put was used as a control. The precipitates were washed
tion, either in tile mode or individually. with different salt concentrations and the proteins were di-
gested with proteinase K. For Raji iBZLF1 cells, the library
Image processing and analysis. For downstream process- preparations and sequencing (Illumina, paired-end, 150 nt)
ing, we wrote a custom Python script based on the bio- were performed by Vertis Biotechnology AG (Freising, Ger-
formats library to extract individual channel images from many), while DG75 iBZLF1 and DG75 cells were prepared
the Leica LIF image files to save them as individual TIFF with the NEBNext Ultra II DNA Library Prep Kit and
files. To identify nuclei, we used the image segmentation tool the NEBNext Multiplex Oligos for Illumina kits. The se-
StarDist (48) with the previously published neuronal net- quences were mapped with bowtie2 2.2.6 (51), formats were
work to detect fluorescent cells. Centroids of StarDist la- transformed with samtools 1.0 (52) and bedtools v2.25.0
bels were found with the scikit-image (49) regionprops mod- (53) and the peak calling of the samples versus input was
ule and used as seeds for RACE (50) segmentation of the done by MACS2 2.1.0 (54,55). The overlapping peaks of
CD147 channel. We used a typical RACE pipeline for seed- two replicates were merged with bedtools intersect and the
assisted segmentation with some adjustments: Median filter DREME algorithm (56) of the MEME-Chip 4.10.1 suite
was set to 2 pixels, Sigma of the Hessian filter to 2 pixels and (57) was used for motif identification. Raji 15 h DREME
the Morphological Operations filter maximum radius set to motifs shown in Figure 1C resulted from the merger of the
8 pixels. two motifs TGAGYVA and TGTGYVA.
Nucleic Acids Research, 2021, Vol. 49, No. 6 3221
Raji iBZLF1 ATAC-sequencing
106 Raji or DG75 cells, with either inducible BZLF1
A plasmid (iBZLF1, p4816) or AD-truncated BZLF1
BZLF1 level 0h 15h
(p5694), were treated with 100 ng/ml doxycycline for 15
h or left untreated. The cells were FACS-sorted for living
cells (untreated) and living, induced cells (15 h induced),
ChIP peaks 30,346 145,544 controlled with trypan blue and prepared for NGS. Omni-
p-val: ≤ 7.3e-6,832 p-val: ≤ 1.2e-2,681 ATAC was performed as previously described (58), with
minor modifications. Briefly, 50,000 FACS-sorted cells
peaks with
21,387 133,337 were washed in PBS, re-suspended in 50 l of ATAC-seq
≥ 1 major re-suspension buffer (RSB: 10 mM Tris–HCl, pH 7.4,
BZLF1 motifs (70 %) (92 %)
10 mM NaCl and 3 mM MgCl2 ) containing 0.1 % NP40,
Downloaded from https://academic.oup.com/nar/article/49/6/3217/6155940 by guest on 22 September 2021
0.1 % Tween-20 and 0.01 % digitonin (Promega) and were
incubated on ice for 3 min. Following lysis, 1 ml of ATAC-
B seq RSB containing 0.1 % Tween-20 was added, and nuclei
iBZLF1 levels were collected at 500 g (4 ◦ C, 10 min). Pelleted nuclei were
0h 15h re-suspended in 50 l of transposition mix (25 l 2 × TD
buffer, 2.5 l Tagment DNA enzyme) (Illumina Nextera
DNA Library Preparation Kit, cat. FC-121–1030), 16.5 l
numbers
PBS, 0.5 l 1 % digitonin, 0.5 l 10 % Tween-20 and 5.25 l
absolute
8,379 13,008 120,329
water) and incubated (37 ◦ C, 30 min) in a thermo-mixer
shaking (1000 rpm). DNA was purified using Qiagen PCR
percent (%)
clean-up MinElute kit (Qiagen). The transposed DNA
9 91 was subsequently amplified in 50 l reactions with custom
39 61 primers, as described (59). After four cycles, libraries were
monitored with qPCR: 5 l PCR sample in a 15 l reaction
with the same primers. qPCR output was monitored for the
C delta reporter value (RN); 0.25 RN cycle number was
iBZLF1 levels
0h 15h used to estimate the number of additional cycles of the PCR
reaction needed for the remaining PCR samples. Amplified
2 2
libraries were purified with the Qiagen PCR clean-up
Information content
1.5 1.5 MinElute kit (Qiagen) and size-selected for fragments <
1 1
600 bp using the Agencourt AMPure XP beads (Beckman
Coulter). Libraries were quality controlled by Qubit and
0.5 0.5 Agilent DNA Bioanalyzer analysis. High-throughput se-
0 0 quencing was performed by the Laboratory for Functional
1 2 3 4 5 6 7 1 2 3 4 5 6 7
Position Position Genome Analysis (LAFUGA) of the Ludwig-Maximilian-
University, Munich, on an Illumina Hi-Seq 1500, using
n = 23,207 n = 344,383
50 nt single-end reads.
The data were mapped on the hg19 genome with Bowtie
1.1.2. The HOMER 4.9 software was used to calculate tag
D directories. The data for the metaplots and heatmaps were
iBZLF1 levels calculated with HOMER’s annotatePeaks.pl tool on data
0h 15h from three independent experiments and visualised with R
1.1 motifs/peak 2.5 motifs/ peak (3.5.1) (46). For heatmap visualisation, the data.table pack-
(23,207 motifs/ (344,383 motifs/ age (60) and the superheat package (61) were used.
21,387 peaks) 133,337 peaks)
Next generation RNA-sequencing
Figure 1. Identification of ChIP-seq peaks and BZLF1 binding motifs in
chromatin of Raji iBZLF1 cells. (A) Numbers of peaks at 0 and 15 h lev- For RNA sequencing, parental Raji and DG75 cells and
els of BZLF1 (i.e. in the non-induced and induced states, respectively) in their derivatives carrying the conditional expression plas-
EBV-positive Raji iBZLF1 cells after ChIP-seq with the BZLF1 specific mids encoding full-length iBZLF1 or AD-truncated iB-
BZ1 antibody. (B) The intersections of the 0 and 15 h peak sets with at least
one identified motif indicate that the majority of 0 h-level peaks are main- ZLF1 were employed. At an initial cell concentration of
tained when BZLF1 is induced. The abundance of peaks increases more 5×10⁵ cells/ml, a total of 2×10⁷ non-induced cells or 4×10⁷
than 5-fold at 15 h BZLF1 levels compared with the peak number at 0 h cells induced with 100 ng/ml doxycycline for 6 h were anal-
BZLF1 levels. (C) At 0 h BZLF1 levels, the known BZLF1 binding motif ysed. Doxycycline leads to the co-expression of BZLF1 and
TGWGCGA predominates in individual peaks. At 15 h BZLF1 levels, the
less specific TGWGYVA motif was identified as the major motif, which
the truncated human NGF-receptor. To limit the analysis
encompasses the previously identified meZRE motif TGWGCGA (12). to BZLF1 expressing cells, only, we sorted NGF-R-positive
(D) The average frequencies of the number of BZLF1 motifs per ChIP-seq cells with magnetic beads (MACS, Miltenyi Biotec) and
peak is provided. the primary anti-NGF-R antibody (HB8737-1, IgG1) and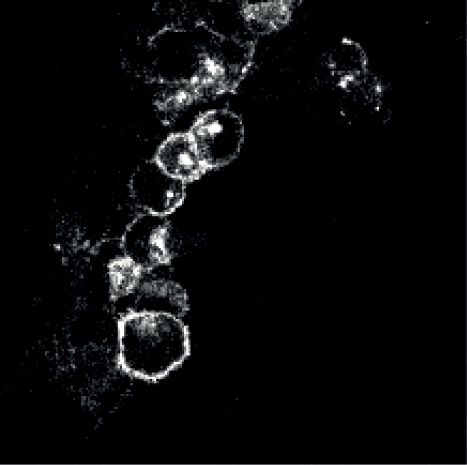
3222 Nucleic Acids Research, 2021, Vol. 49, No. 6
a secondary anti-mouse IgG (1:10, Miltenyi Biotech) anti- Samples were joined and the reaction was stopped with SDS
body. 7.5×10⁵ cells were lysed in 1 ml Trizol (Thermo Fisher at a final concentration of 1.6 %. The samples were incu-
Scientific), snap frozen in liquid nitrogen and stored at −80 bated (65 ◦ C, 1200 rpm, for 30 min), diluted with 5760 l
◦
C. 1.25× 3C ligation buffer (62.5 mM Tris–HCl (pH 7.5), 12.5
Prior to RNA isolation, identical molar amounts of mM MgCl2 , 1.25 mM ATP, 12.5 mM DTT in ddH2 O) and
ERCC spike-in control RNAs (Ambion) were added to 720 l Triton X-100 (final concentration of 1 %) and in-
3×10⁵ non-induced or doxycycline-induced Raji iBZLF1 cubated again (37 ◦ C, 1 h, carefully inverting every 10 min).
(0 h/6 h) and DG75 iBZLF1 cells. The subsequent pro- 100 units T4 DNA Ligase (Affymetrix or Thermo Scientific)
cesses and steps were identical for all cells. RNA was ex- was used for DNA fragment ligation (16 ◦ C for 4.5 h and RT
tracted with the Direct-zol RNA MiniPrep Kit (Zymo Re- for 45 min) followed by proteinase K (20 g/l) treatment
seach). The RNA concentration and quality were controlled at 65 ◦ C over-night to revert cross-linking. RNAs were de-
with Nanodrop (Thermo Fisher Scientific), Qubit (Thermo graded with RNase A (10 g/l), 37 ◦ C, 1 h). DNA was ex-
Fisher Scientific) and Bioanalyzer (Agilent), and the RNAs tracted with organic solvents (2/3 v/v phenol–chloroform
Downloaded from https://academic.oup.com/nar/article/49/6/3217/6155940 by guest on 22 September 2021
were treated with dsDNase (Thermo Fisher Scientific). The and 1/3 v/v butanol), precipitated (EtOH, 100 %), washed
Encore Complete RNA-Seq Library System kit (NuGEN), (EtOH 70 %) and re-hydrated (TE buffer).
which uses not-so-random hexamer primers for rRNA de- For Raji and DG75 iBZLF1 cells, 1.5 g and 3.0 g DNA
pletion, was used for library preparation. The samples were were sheared, respectively, using a Covaris M-series instru-
sequenced on an Illumina HiSeq 1500 instrument (100 nt, ment (Covaris, peak incident power: 50 W; duty factor 20
single-end reads). %; cycles/burst: 200 counts, duration 200 s). Samples were
For bioinformatic analysis, the samples were mapped cleaned with Agencourt AMPure beads (Beckman Coul-
with Tophat2 (62) on a Galaxy server (63) to the hg19 ter). The library preparation and sequence capture for Raji
genome, locally with HiSat2 2.0.1 to EBV-Raji (KF717093), iBZLF1 cells were done as described in the SureSelectXT2
and reads were assigned to annotated genes with HTSeq- Target Enrichment System for Illumina Paired-End Mul-
count 0.6.1p1 (64). The counts were compared between in- tiplexed Sequencing manual (Agilent, Version: E1, June
duced (6 h) and non-induced (0 h) cells with the R pack- 2015). For DG75 iBZLF1 cells the SureSelectXT Target
age DESeq2 1.12.3 (65). Samples with added ERCC spike- Enrichment System was used (Agilent, Version C2, Decem-
in RNAs were normalised to these. The visualisation was ber 2018). The desired fragments were captured with Dyn-
done with R including the packages ‘Extrafont’ 0.17 (66) abeads (Thermo Fisher Scientific). Finally, the samples were
and ‘RColorBrewer’ 1.1–2 (67). sequenced on a HiSeq 1500 (Illumina, paired-end reads, 100
nt read length).
Overlapping paired-end reads were joined using the flash
Promoter analysis
tool (68). The sequences were DpnII-digested in silico with
Bedtools intersect was used to identify peaks which are the dpnII2E.pl script (kindly provided by James Davies, Ox-
located within the promoters [−1 kb/+5 kb relative to ford, UK) and mapped with Bowtie 1.1.0 (69). The perl
TSS (UCSC, RefSeq Genes, Hg19)] of regulated and non- script dpngenome3 1.pl (kindly provided by James Davies,
regulated genes. R was used to remove duplicates, calcu- Oxford, UK) was used to digest the hg19 genome in silico
late and visualize the number of BZLF1 peaks or motifs with DpnII. Interactions between distant DNA fragments
within the promoters. Genes with fewer than 20 reads were were identified with the CCAnalyser2.pl script (kindly pro-
excluded from the analysis. vided by James Davies, Oxford, UK). The data were aver-
aged between triplicates, normalised by the total number of
interactions for all captured fragments per time point, and
Capture-C
visualised with R. Additionally, ChIP-seq and RNA-seq re-
For Capture-C analysis, 107 non-induced Raji iBZLF1 and sults were added to the visualisation. The analysed genes
DG75 iBZLF1 cells or cells induced for 6 and 15 h with 100 can be found in Supplementary Table S2. The CHiCAGO
ng/ml doxycycline were used. The 6 h time period was anal- package (70) was used to calculate and visualize the loss or
ysed only in Raji iBZLF1 cells. Cells were washed (PBS), gain of significant chromatin interaction upon induction of
filtered for single cells, and fixed (1 % formaldehyde, 10 % EBV’s lytic cycle.
fetal bovine serum in PBS). The fixation was quenched on
ice with 1 M glycine and washed with PBS before cells were
RESULTS
homogenized two times with 15 strokes each with a 20G sy-
ringe in 3C lysis buffer (10 mM Tris–HCl (pH 7.5), 10 mM The aim of this study was to investigate the alterations
NaCl, 0.2 % NP-40 in ddH2 O + PIC). Cells were washed of the cellular chromatin structure and the transcriptome
and taken up in DpnII restriction buffer (NEB). SDS was of latently-infected B cells when BZLF1 is expressed and
added to a concentration of 0.1 % and the cells were incu- EBV’s lytic cycle starts. First, we determined the physio-
bated (65 ◦ C, 40 min) while shaking (1200 rpm) and 20 min logical levels of BZLF1 protein in cells that naturally sup-
at 37 ◦ C shaking (1200 rpm). Triton X-100 was added to a port virus de novo synthesis. Next, we stably introduced two
final concentration of 4 % and the cells were incubated (37 conditional oriP plasmids into Raji and DG75 cells, which
◦
C, 1 h, 1200 rpm). The cell suspension was divided into four are EBV-positive and EBV-negative Burkitt lymphoma cell
aliquots of equal volume and incubated each with 100 units lines, respectively. Upon addition of doxycycline, the two
DpnII at 37 ◦ C while shaking (1200 rpm) overnight followed plasmids express regulated levels of full-length BZLF1 or
by another incubation with 100 units of DpnII for 2.5 h. BZLF1 devoid of its trans-activation domain. The estab-Nucleic Acids Research, 2021, Vol. 49, No. 6 3223
lished human B cell line Raji is latently infected with EBV, Figure S1C), while the population of non-induced Raji iB-
does not support EBV’s lytic phase spontaneously, but en- ZLF1 cells still expressed detectable levels of BZLF1 that
ters it rapidly and synchronously upon the induced ex- were lower by a factor of about 42 (Supplementary Figure
pression of full-length BZLF1. We used this cell line (and S1C). Using flow cytometry, we reproducibly found that the
parental controls) throughout our studies and investigated population of non-induced Raji iBZLF1 cells contained a
the cells in their non-induced state and upon addition of very small fraction with low to medium levels of BZLF1
doxycycline for up to 15 h covering the pre-replicative protein (data not shown).
lytic phase of reactivated EBV. Indistinguishable from full- We were concerned that the conditional expression plas-
length BZLF1, BZLF1 without its trans-activation domain mid p4816 is leaky and might express steady state levels of
binds to its many cognate sequence motifs, but cells that ex- BZLF1, even in the absence of doxycycline that are suffi-
press it do not enter EBV’s lytic phase (18,34). We there- cient to induce EBV’s lytic phase in latently-infected cells.
fore used Raji cells engineered to express the conditional Since Raji cells are incapable of fully supporting de novo
AD-truncated BZLF1 for certain control experiments as virus synthesis (35), we turned to a derivative of HEK 293
Downloaded from https://academic.oup.com/nar/article/49/6/3217/6155940 by guest on 22 September 2021
well as DG75 cells, an EBV-negative human B cell line, in 2089 cells that releases the EBV strain wt/B95.8 (2089)
which we addressed the functions of BZLF1 in the absence upon BZLF1 expression (42). We stably introduced the
of other viral genes. Last, we studied the function of the > p4816 plasmid into these cells termed HEK293 2089 iB-
5×10⁵ binding sites of BZLF1 in cellular chromatin, which ZLF1 and evaluated the concentration of EBV virions in
we had identified in our initial experiments. In a third cellu- the cells’ supernatant, both in the absence and presence
lar model, we found that the abundant number of BZLF1 of different concentrations of doxycycline (Supplementary
binding sites acts as a sink to prevent the induction of EBV’s Figure S1D). The supernatants were used to infect Raji cells
lytic phase upon low level expression of BZLF1. In turn, the that turn GFP-positive upon infection with the EBV strain
many BZLF1 binding sites implement a dichotomous func- wt/B95.8 (2089). Virus amounts were expressed as Green
tion that can only become active when BZLF1 accumulates Raji units (GRU), as described (42,47). As expected, only
at high molar concentration in the nucleus of a cell latently HEK 293 2089 iBZLF1 cells released infectious wt/B95.8
infected with EBV. (2089) EBV in a dose-dependent fashion after adding in-
creasing concentrations of doxycycline, but not the parental
HEK 293 2089 cells (Supplementary Figure S1D). With-
Lytic viral gene expression requires high levels of BZLF1
out doxycycline, the supernatants of HEK 293 2089 iB-
When latent EBV-infected memory B cells come in contact ZLF1 cells contained very low numbers of virus, similar
with their cognate antigens, the viral BZLF1 gene is acti- to supernatants obtained from the parental HEK 293 2089
vated and virus synthesis is induced (8). In vivo, only sin- cells (Supplementary Figure S1D). In all subsequent ex-
gle memory B cells respond to this trigger, which makes periments, a doxycycline concentration of 100 ng/ml was
it technically impossible to determine the protein levels of used in cells with the conditional expression plasmid p4816
BZLF1 required to induce and/or support the lytic phase (iBZLF1) to reach BZLF1 levels comparable to lytically-
of EBV’s life cycle in these cells. Therefore, we turned induced B95-8 cells (Supplementary Figure S1C).
to the B95-8 cell line because a small fraction within its In RNA-seq experiments using our conditional Raji iB-
population spontaneously enters the lytic phase and re- ZLF1 cell model, we compared viral lytic genes prior to
leases infectious virions. We first determined this fraction and after induction of BZLF1 to test how the expres-
of cells in the lytic cycle to be 2.8 % on average by intra- sion of BZLF1 influences their expression. Before induc-
cellular staining with an Alexa 647 fluorophore-coupled tion, lytic genes were expressed at very low levels only,
monoclonal antibody directed against BZLF1 and flow while latent genes were strongly expressed (Supplemen-
cytometry. tary Tab. S1). Upon adding doxycycline for 6 h, Raji iB-
We then obtained whole cell protein lysates from a known ZLF1 cells readily expressed many viral genes that clearly
number of B95-8 cells and compared the BZLF1 signal mark the onset of EBV’s lytic phase. Supplementary Fig-
intensities by western blot immuno-detection with known ure S1E shows the log2 fold differential expression of vi-
molar amounts of a truncated BZLF1 protein (Supplemen- ral genes comparing non-induced and induced Raji iB-
tary Figure S1A) that was recombinantly expressed in HEK ZLF1 cells after ERCC spike-in normalisation (see below
293 cells and purified to high homogeneity (Supplementary for experimental details). Very few viral genes were down-
Figure S1B). We also engineered Raji cells to carry a condi- regulated such as EBNA1 and EBNA2 among other latent
tional BZLF1 allele on the oriP-based plasmid p4816 (18), genes (Supplementary Tab. S1). Five of the six early lytic
added doxycycline for 6 h (Raji 6 h iBZLF1), and loaded genes known to be essential for lytic amplification of vi-
protein lysates of non-induced Raji cells (Raji 0 h iBZLF1) ral DNA (71) were up-regulated 60- to > 250-fold (high-
onto the same gel. Depending on the cell line and its state lighted genes: BBLF3-BBLF2, BBLF4, BALF5, BMLF1-
of induction, protein equivalents that corresponded to dif- BSLF1 and BMRF1; Supplementary Figure S1E), except
ferent cell numbers were also loaded and the signal inten- BALF2, which is deleted in Raji EBV DNA (37). Addi-
sities were quantified as shown in Supplementary Figure tional genes that contribute to the lytic replication of viral
S1A. Based on this approach, we estimated that each B95- DNA (BKRF3, BRLF1, BHLF1 and BMLF1) (72) were
8 cell that was found to express BZLF1 by intra-cellular strongly induced as well as BZLF1. The most strongly up-
staining contained 1.3×10⁶ ± 0.2×10⁶ BZLF1 dimers on regulated gene, BDLF3.5, was induced almost 300-fold.
average. BZLF1 levels in Raji iBZLF1 cells induced for 6 Supplementary Table S1 provides a list of viral genes and
h with doxycycline were ∼ 3.5-fold higher (Supplementary their regulation.3224 Nucleic Acids Research, 2021, Vol. 49, No. 6
BZLF1 binds many DNA sites in cellular chromatin spectively 95 % of all peaks contained the consensus motif
TGWGYVW at 15 h BZLF1 levels in Raji (Figure 2A) and
The binding sites and sequence motifs of BZLF1 were al-
DG75 iBZLF1 cells (Figure 2D).
ready identified and further analysed in the viral genome
In total, in induced Raji and DG75 iBZLF1 cells, 145,544
(12,73,74). BZLF1 is a member of the cellular AP-1 family
and 231,019 peaks contained 579,911 and 794,729
of transcription factors (75), which are estimated to bind
TGWGYVW motifs, respectively, of which 344,383
∼ 500,000 sites in human DNA. We therefore hypothesised
and 431,282, respectively, terminated with A (Figure 1C,
that BZLF1 might also bind to many accessible sites in the
Supplementary Figure S2G) and 235,528 and 363,447, re-
chromatin of human B cells. To address this possibility, we
spectively, terminated with T (Supplementary Figure
used our conditional iBZLF1 Raji cell model in compar-
S2C, K). The peak number in Raji iBZLF1 cells includes
ison with DG75 iBZLF1 cells to identify BZLF1 binding
the peaks we found in the viral genome (34). Our analysis
sites in a genome-wide ChIP-seq approach in EBV-positive
also revealed a clear hierarchy of the BZLF1 sequence
and EBV-negative cells, respectively.
motifs in Raji and DG75 iBZLF1 cells as shown in Figure
Downloaded from https://academic.oup.com/nar/article/49/6/3217/6155940 by guest on 22 September 2021
We analysed different experimental conditions using the
2B and E. The highest affinity at 0 h BZLF1 levels appears
BZ1 monoclonal antibody directed against the dimerisation
to correlate with the motif TGWGCGA, whereas the
domain of BZLF1 (45) in our ChIP-seq analysis: Raji iB-
weakest binding is associated with the motif TGWGYVT,
ZLF1 and DG75 iBZLF1 cells in their non-induced state
to which BZLF1 binds also less frequently at 15 h BZLF1
and after induction of full-length BZLF1 with 100 ng/ml
levels compared with the TGWGYVA motif.
doxycycline for 15 h. Parental EBV-negative DG75 cells
At 15 h BZLF1 levels, on average, in Raji and DG75 iB-
served as a negative control.
ZLF1 cells each peak was found to contain about 4.0 and
In the parental EBV-negative DG75 cells, we found few
3.4 BZLF1 binding motifs, respectively (Figure 2C and F).
mapping reads after ChIP-seq that rarely accumulated to
peaks. This finding suggested that our ChIP-seq protocol
delivers data with a very low background, because DG75 High BZLF1 levels induce open chromatin at cellular BZLF1
cells do not express BZLF1. binding sites, but a genome-wide loss of open chromatin
When BZLF1 is not inducibly expressed (0 h level) in Next, we investigated the chromatin of EBV’s host cells
Raji iBZLF1 or DG75 iBZLF1 cells in the absence of and studied the consequences of inducing EBV’s lytic cy-
doxycycline (Supplementary Figure S2A) we found about cle and the binding of BZLF1 to cellular DNA. BZLF1
30,000 or 11,000 ChIP peaks, respectively, of which 70 % is a viral pioneer factor, binds to nucleosomal DNA, re-
(Figure 1A) and 82 % (Supplementary Figure S2E) con- cruits chromatin remodelers such as INO80, and induces
tained the known BZLF1 binding motif TGWGCGA (Fig- the local opening of repressed EBV chromatin (34). To ex-
ure 1C; Supplementary Figure S2G) also termed meZRE tend this insight, we analysed the chromatin accessibility of
(12,18). BZLF1 preferentially binds this motif when its non-induced and induced Raji and DG75 iBZLF1 cells by
CpG dinucleotide contains methylated 5 -cytosine residues ATAC-seq. In these experiments, both cell lines engineered
(12). When the cells were induced with doxycycline for 15 h to carry a conditionally expressed BZLF1 gene lacking its
more than half of the peaks with this motif were preserved transactivation-domain (AD-truncated BZLF1) were used
(Figure 1B; Supplementary Figure S2F), but the total num- as negative controls.
ber of peaks increased dramatically (Figure 1A, B; Supple- We combined the ATAC-seq data with the BZLF1 peaks
mentary Figure S2E, F) in both Raji and DG75 iBZLF1 cell identified at 15 h levels in Raji and DG75 iBZLF1 cells
lines. In the induced state, about 146,000 and 231,000 ChIP (Figure 1A, Supplementary Figure S2E) to analyse the lo-
peaks were identified, respectively, of which 92 % (Figure cal chromatin accessibility as a function of BZLF1 binding.
1A) and 88 % (Supplementary Figure S2E) contained one Supplementary Figure S3 illustrates the bioinformatic ap-
or more copies of the less precisely defined consensus mo- proach. Average chromatin accessibility along all BZLF1
tif TGWGYVA (Figure 1C; Supplementary Figure S2G). peaks in cellular chromatin is shown as meta-plots for
At 0 h BZLF1 levels, this motif was not among the highly Raji and DG75 iBZLF1 cells in Figure 3A and C, and as
ranked motifs. heatmaps in Supplementary Figure S4A and D, respectively.
In a minor fraction of called peaks the MEME-Chip suite BZLF1 peak coverage and input signals are shown in Sup-
(57) failed to identify a common sequence motif for un- plementary Figure S5, panels A–C and D–F, respectively,
known reasons. We therefore turned to a visual inspection as meta-plots and heatmaps.
of the DNA sequences within the peak regions of this ChIP We analysed the average coverage of ATAC-seq reads at
fraction. After inspection of peaks, in which no other motif these sites in the two pairs of Raji and DG75 cell lines that
could be identified before, we found an additional and re- express full-length or the AD-truncated BZLF1 protein in
lated sequence motif TGWGYVT. This motif is very sim- their non-induced and induced states. The visualisation in
ilar to the meZRE motif TGWGYVA except its last nu- Figure 3A and C documents the opening of silent, compact
cleotide residue. We continued our analysis with a computa- chromatin at cellular BZLF1 binding sites that occurs only
tional search for this possible motif in the sets of called ChIP at induced 15 h levels of BZLF1 in Raji iBZLF1 cells and
peaks. Data shown in Supplementary Figure S2A and S2I also in the EBV-negative DG75 iBZLF1 cells, respectively.
indicate that 58 % and 54 % of all peaks in Raji and DG75 An example is shown in Supplementary Figure S6A and D.
iBZLF1 cells, respectively, contained the motif TGWGYVT The average peak of chromatin opening co-locates in both
when BZLF1 was expressed for 15 h. Taking both motifs cell lines exactly with the peak center of the > 105 cellular
with terminal A or T residues into consideration, 96 % re- BZLF1 binding sites in induced cells that express full-lengthNucleic Acids Research, 2021, Vol. 49, No. 6 3225
A B
Peaks with Motifs Motifs
total peaks = 145,544
high
5,581 <
BZLF1 expression level
(None) (235,528) (344,383)
Raji iBZLF1
numbers
absolute
55,417 77,920
(A) (AT)
6,626
low
(T) <
Downloaded from https://academic.oup.com/nar/article/49/6/3217/6155940 by guest on 22 September 2021
percentage
(3,912) (23.207)
3.8
(%)
38.1 53.5 4.6
0 100k 200k 300k 400k
96 motif abundance
C
(235,528 (T-Motif ) + 344,383 (A-Motif ) ) / 145,544 peaks (high) = 4.0 motifs/ peak
D E
Peaks with Motifs Motifs
total peaks = 231,019
high
11,436 <
BZLF1 expression level
(None) (363,447) (431,282)
DG75 iBZLF1
numbers
absolute
95,659 106,812
(A) (AT)
17,112
low
<
(T)
(330) (9,886)
percentage
(%)
41.4 46.2 7.4 5.0 0 100k 200k 300k 400k 500k
motif abundance
95
F
(363,447 (T-Motif ) + 431,282 (A-Motif ) ) / 231,019 peaks (high) = 3.4 motifs/ peak
Figure 2. Motif abundance as a function of BZLF1 levels in Raji and DG75 iBZLF1 cells. (A, D) The Venn diagram shows the number of peaks that
contain either the TGWGYVA (A) or the TGWGYVT (T) motifs, both (A/T) or no identifiable motif (none). In Raji and DG75 iBZLF1 cells at 15 h
BZLF1 levels 54 % and 46 % of the peaks contain both motifs (A/T), respectively. Within 96 % and 95 % of all peaks in Raji and DG75 iBZLF1 cells,
respectively, at least one motif could be identified. (B, E) The number of the four BZLF1 binding motifs found in ChIP-seq peaks is plotted at 0 h and
15 h expression levels of BZLF1. At both levels and in both cell lines, the number of motifs ending with the residue A exceeds the number of motifs ending
with T. The finding suggests that BZLF1’s ranked motif preference is TGWGCGA > TGWGCGT > TGWGYVA > TGWGYVT. (C, F) Calculation of
the number of motifs per peak.
BZLF1. A truncated BZLF1 protein without its transcrip- kept open (Supplementary Figure S6B, E). Accessibility at
tional activation domain does not induce chromatin remod- random locations (n = 145,477 resp. n = 231,019 in Raji and
eling (Figure 3A, C, Supplementary Figure S4A4 , D4 ), al- DG75 iBZLF1 cells) was not affected (insets in Figure 3A,
though it binds inactive chromatin as efficiently as full- C, Supplementary Figure S4B, E).
length BZLF1 (12). This finding clearly supports our view Prior to BZLF1 induction, Raji and DG75 iBZLF1 cell
that BZLF1’s activation domain recruits chromatin remod- chromatin demonstrates a high number of accessible, open
elers such as INO80 to silent chromatin (34). As a conse- regions that are clearly identifiable by ATAC-seq (Sup-
quence, the previously repressed chromatin becomes acces- plementary Figure S6C, F). In latent Raji and DG75 iB-
sible (Figure 3A, C, Supplementary Figure S4A2 ,D2 ) and ZLF1 cells, the MACS2 peak caller found about 81,000 and
acquires activating histone marks (data not shown) or is 105,000 peaks of accessible cellular chromatin, respectively,3226 Nucleic Acids Research, 2021, Vol. 49, No. 6
A B
Cellular BZLF1 Open host chromatin
2.0
25
Random sequences
0.5 1.0 1.5 2.0
ATAC−seq coverage
20
1.5
ATAC−seq coverage
Raji iBZLF1
15
−2k −1k 0 1k 2k
Distance [bases]
1.0
10
Downloaded from https://academic.oup.com/nar/article/49/6/3217/6155940 by guest on 22 September 2021
5
0.5
0
−2000 −1000 0 1000 2000 −2000 −1000 0 1000 2000
Distance [bases] Distance [bases]
BZLF1 full−length 0h BZLF1 full−length 15h BZLF1 AD-truncated 0h BZLF1 AD-truncated 15h
C D
Cellular BZLF1 Open host chromatin
2.0
Random sequences
25
0.5 1.0 1.5 2.0
ATAC−seq coverage
20
1.5
ATAC−seq coverage
DG75 iBZLF1
15
−2k −1k 0 1k 2k
Distance [bases]
1.0
10
5
0.5
0
−2000 −1000 0 1000 2000 −2000 −1000 0 1000 2000
Distance [bases] Distance [bases]
Figure 3. Changes in cellular chromatin accessibility after induction of BZLF1 in Raji and DG75 iBZLF1 cells. (A, C) The meta-plot summarizes the
accessibility at the 145,477 and 231,019 BZLF1 binding sites (Figure 1A and Supplementary Figure S2E) in Raji and DG75 cell chromatin, respectively,
prior to and after induction of full-length or AD-truncated BZLF1. The average ATAC-seq coverages in the four different Raji and DG75 cell samples
are plotted according to the nucleotide coordinates of the centers of the 145,477 and 231,019 BZLF1 peaks. In non-induced Raji and DG75 iBZLF1 cells
(BZLF1 full-length, 0 h) the average ATAC-seq coverage is congruent with the coverage found in induced and non-induced Raji and DG75 cells that carry
the conditional AD-truncated BZLF1 allele. At induced BZLF1 levels (full-length, 15 h) the average ATAC-seq coverage is substantially increased indicating
a gain in chromatin accessibility. The inset provides the ATAC-seq coverage of 145,477 and 231,019 randomly sampled sequences in the chromatin of Raji
and DG75 iBZLF1 cells, respectively, expressing full-length BZLF1 at 15 h levels after doxycycline-mediated induction. (B, D) The meta-plot summarizes
the ATAC-seq coverage at the about 81,000 and 105,000 called peaks of open host chromatin identified prior to the induction of BZLF1 in both Raji and
DG75 iBZLF1 cell lines, respectively. After induced expression of full-length BZLF1 the chromatin accessibility is strongly reduced in Raji iBZLF1 cells
indicating that previously open host chromatin becomes globally inaccessible upon induction of EBV’s lytic phase. In DG75 iBZLF1 cells the effect is
apparent, but less pronounced. Compared with non-induced cells (0 h), the ATAC-seq coverage is barely affected when the AD-truncated BZLF1 protein
is expressed in both cell lines. The data summarize three independent biological replicates.Nucleic Acids Research, 2021, Vol. 49, No. 6 3227
that allowed us to calculate the average ATAC-seq coverage reproducibility of the experimental approach in both
of open chromatin prior to and after induction of EBV’s cell lines (Supplementary Figure S7A–D).
lytic cycle. As shown in Figure 3B and D and in the corre-
sponding heatmaps (Supplementary Figure S4C, F), and in In Raji and DG75 iBZLF1 cells we found 91 and 109
a representative IGV browser image shown in Supplemen- cellular genes with increased transcript levels, while 7174
tary Figure S6C and F, we found that open chromatin in and 93 showed a decrease, respectively (Figure 4C, F). The
non-induced Raji and DG75 iBZLF1 cell chromatin closes population spreads were much higher in both cell lines
upon induction of EBV’s lytic phase. Reduction of chro- when compared to their controls, but only in Raji iB-
matin accessibility was evident at the majority of ATAC- ZLF1 cells the median of the population was shifted to a
seq peaks identified to be accessible prior to induction of strong negative value indicating that the majority of cellu-
BZLF1 in both cell lines (Figure 3B, Supplementary Fig- lar transcripts was substantially reduced on average. The
ure S6C, resp. Figure 3D, Supplementary Figure S6F), al- median of DG75 iBZLF1 cells was found unaltered indi-
though the effect in Raji iBZLF1 cells was stronger com- cating that full-length BZLF1 induces considerable tran-
Downloaded from https://academic.oup.com/nar/article/49/6/3217/6155940 by guest on 22 September 2021
pared to lytically-induced DG75 iBZLF1 cells. scriptional noise, but its expression does not repress cellu-
The data suggest that the induced expression of BZLF1 lar transcripts globally as in Raji iBZLF1 cells. Individual
alone reduces the accessibility of previously open cellular triplicates are shown as boxplots in Supplementary Figure
chromatin globally as shown in DG75 cells, but the ensu- S7E–H.
ing activation of EBV’s lytic phase reduces it further as it is The results indicate that the induced expression of full-
evident in Raji cells upon induction. On the contrary, chro- length BZLF1 for 6 h and subsequent induction of EBV’s
matin loci bound by BZLF1 open up site-specifically upon lytic cycle led to a dramatic and global drop of transcript
its induced expression independent of other viral factors. levels in Raji iBZLF1 cells, only. Fewer than hundred genes
were found up-regulated upon BZLF1 expression, an unex-
pected finding, because BZLF1 is a known transcriptional
activator in the viral genome, which also binds to the cel-
Induction of EBV’s lytic cycle drastically reduces cellular
lular genome frequently (Figure 1, Supplementary Figure
transcripts in Raji iBZLF1 cells
S2).
We investigated the consequences of the induction of EBV’s
lytic phase and BZLF1’s binding to cellular chromatin with
respect to transcriptional regulation. RNA-seq experiments BZLF1 binding sites in proximity to TSS do not correlate
were performed in three different experimental layouts: with the magnitude of gene regulation
Since BZLF1 binds more than 145,000 and 231,000 sites in
(i) Steady state RNA transcript levels of parental Raji or the cellular chromatin of Raji and DG75 iBZLF1 cells, re-
DG75 cells were analysed and compared with the same spectively (Figure 1, Supplementary Figure S2), it seemed
cells incubated with doxycycline for 6 h (Figure 4A, D). plausible that it can regulate promoters of cellular genes
Doxycycline did not regulate any genes according to similar to the many viral promoters of lytic EBV genes
our threshold criteria, which are provided in the figure. (12,14,18). To address this question, we looked for peaks
The violin plots shown in Figure 4A and D indicate identified by ChIP-seq within promoter regions of genes
that the log2 fold change of 95 % of the expressed genes, found to be regulated in our RNA-seq experiments (Fig-
subsequently termed ‘population spread’, was located ure 4C, F). We limited our search to a region 5 kb upstream
in a very narrow range in parental Raji and DG75 cells to 1 kb downstream of the TSSs (Figure 5C). About half
(Figure 4A, D, bottom panels). of the up-regulated genes comprised one or more peaks
(ii) We repeated the experiment with Raji and DG75 cells within the defined limits of their TSSs, while about two-
engineered to express a truncated version of BZLF1 thirds of the down-regulated genes did not contain recog-
(AD-truncated) without its transcriptional activation nizable peaks attributed to BZLF1 binding in both cell lines
domain (18). Upon adding doxycycline for 6 h, no (Figure 5A, E).
gene was identified to be regulated (Figure 4B, E). We also searched for a possible correlation between the
The population spread in Raji iBZLF1 AD-truncated absolute numbers of BZLF1 motifs within the promoter re-
cells slightly exceeded the range found in parental Raji gions and the magnitude of gene regulation. Similar to the
cells (0.28 versus 0.42 log2 values; Figure 4A,B), while results shown in Figure 5A and E, we did not find a cor-
DG75 iBZLF1 AD-truncated cells and parental DG75 relation. Certain promoters with few BZLF1 binding mo-
cells were comparable (Figure 4D, E). tifs were more profoundly regulated than promoters with
(iii) Raji iBZLF1 cells engineered to express the full-length multiple binding motifs (Figure 5B, F). Few cellular genes
BZLF1 protein were induced by adding doxycycline seemed to be exceptions to this rule in both cell lines (Fig-
for 6 h and were analysed by RNA-seq (Figure 4C). ure 5B, F). A very small number of genes contained > 50
We used the ERCC RNA spike-in mix to be prepared and up to 142 and 111 BZLF1 binding motifs in Raji and
for global changes in the cellular transcriptomes, to DG75 cells, respectively, within their promoter regions but
analyse the basic performance metric of the RNA-seq these genes were barely regulated upon BZLF1 expression.
libraries, and to normalize the data during the steps Together, the many identified BZLF1 binding motifs in
of subsequent bioinformatic analyses according to this promoter regions of cellular genes did not provide a clear
standard. The quantitative detection of the external function that could be ascribed to BZLF1. BZLF1 was
spike-in RNAs demonstrated the linearity, quality and characterized as a transcription factor of viral promoters,You can also read