Rapid signaling reactivation after targeted BRAF inhibition predicts the proliferation of individual melanoma cells from an isogenic population
←
→
Page content transcription
If your browser does not render page correctly, please read the page content below
www.nature.com/scientificreports
OPEN Rapid signaling reactivation
after targeted BRAF inhibition
predicts the proliferation
of individual melanoma cells
from an isogenic population
Payam Khoshkenar1,4, Emily Lowry1,4 & Amir Mitchell1,2,3*
Cancer cells within tumors display a high degree of phenotypic variability. This variability is thought
to allow some of the cells to survive and persist after seemingly effective drug treatments. Studies on
vemurafenib, a signaling inhibitor that targets an oncogenic BRAF mutation common in melanoma,
suggested that cell-to-cell variation in drug resistance, measured by long-term proliferation,
originates from epigenetic differences in gene expression that pre-exist treatment. However, it is still
unknown whether reactivation of signaling downstream to the inhibited BRAF, thought to be a key
step for resistance, is heterogeneous across cells. While previous studies established that signaling
reactivation takes place many hours to days after treatment, they monitored reactivation with bulk-
population assays unsuitable for detecting cell-to-cell heterogeneity. We hypothesized that signaling
reactivation is heterogeneous and is almost instantaneous for a small subpopulation of resistant cells.
We tested this hypothesis by monitoring signaling dynamics at a single-cell resolution and observed
that despite highly uniform initial inhibition, roughly 15% of cells reactivated signaling within an hour
of treatment. Moreover, by tracking cell lineages over multiple days, we established that these cells
indeed proliferated more than neighboring cells, thus establishing that rapid signaling reactivation
predicts long-term vemurafenib resistance.
Numerous studies over the past decade revealed extensive diversity between cancer cells within tumors. These
cell-to-cell differences, often referred to as heterogeneity, can involve multiple cellular pathways and underly
significant phenotypic variation. In some cases, cell-to-cell heterogeneity can engage key oncogenic pathways
underlying disease progression or influencing treatment resistance and can therefore pose significant challenges
for personalized cancer treatment1. Cell-to-cell variation is typically thought to originate from genomic insta-
bility leading to genetic differences between individual cancer cells within a tumor. However, multiple recent
studies have also revealed that non-genetic mechanisms can play a significant role in promoting heterogeneity
with potential important implications for correct diagnostics, disease progression and treatment o ptions2–6. In
these cases, isogenic cancer cells exist in alternative epigenetic states that arise from transcriptional and post-
transcriptional differences between t hem7,8. Since the underlying mechanisms driving this type of heterogeneity
can be independent of genetic differences (mutations) between cells, an individual cell can readily transition
between two or more phenotypic states5,6.
The research of epigenetic-driven heterogeneity has greatly benefitted from in-vitro experiments in cell-line
cultures. Such experiments, especially with clonal cell-lines that were derived from a single ancestor cell, allow
controlling for multiple parameters that are highly variable in the extracellular tumor microenvironment and
can also contribute to heterogeneity. Such parameters include uneven nutrient availability, oxygen gradients and
spatial pH differences across the tumor environment9–11. Hence, in-vitro experiments allow for elucidation and
focus on the inherent phenotypic diversity that is still retained even in a highly regulated and uniform in-vitro
environment4–6. Melanoma cell-lines harboring the oncogenic BRAFV600E mutation have become a primary model
1
Program in Systems Biology, University of Massachusetts Medical School, Worcester, USA. 2Program in Molecular
Medicine, University of Massachusetts Medical School, Worcester, USA. 3Department of Molecular, Cell and
Cancer Biology, University of Massachusetts Medical School, Worcester, USA. 4These authors contributed equally:
Payam Khoshkenar and Emily Lowry. *email: amir.mitchell@umassmed.edu
Scientific Reports | (2021) 11:15473 | https://doi.org/10.1038/s41598-021-94941-8 1
Vol.:(0123456789)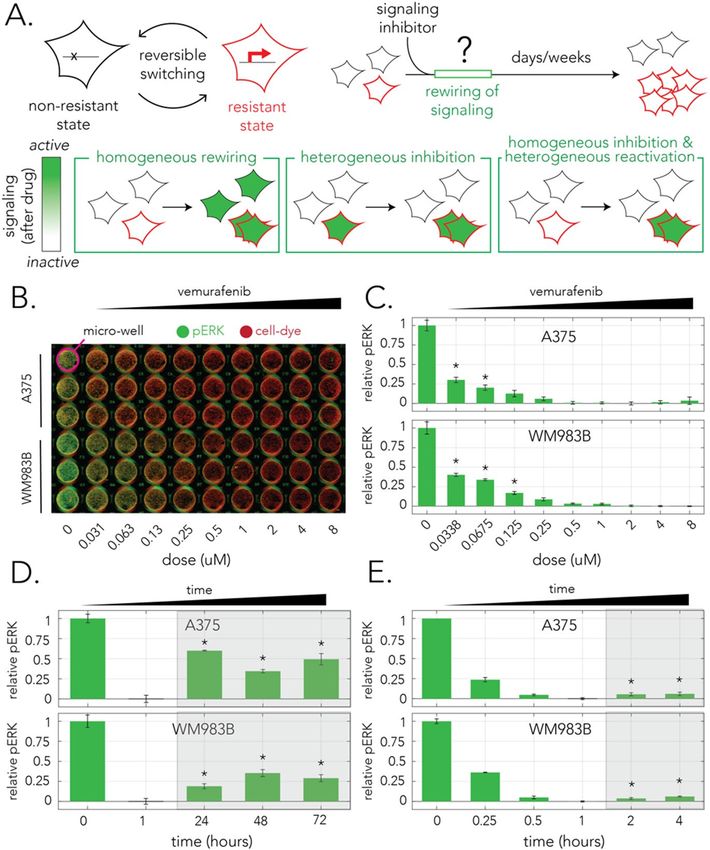
www.nature.com/scientificreports/
system for studying adaptive drug resistance and epigenetic-driven h eterogeneity5,12–14. Specifically, the B
RAFV600E
mutation, which is the most frequent BRAF mutation in melanoma, stimulates the constitutive activation of the
downstream extracellular signal-regulated kinase (ERK). Constitutive activation of this pro-proliferative kinase
in tumor cells, even in the absence of any extracellular stimuli, allows cells to become self-sufficient in growth
signals15. Vemurafenib, the first drug approved for BRAF-mutant cancer, is a selective inhibitor of oncogenic
BRAF that offers a significant clinical benefit for patients with metastatic m elanoma16. Vemurafenib acts by
selectively binding to the mutated BRAF protein which in turn inhibits the downstream mitogen-activated
protein kinase network, including ERK.
While vemurafenib emerges as a highly effective anti-cancer treatment reaching 80% tumor response rate
among patients, its potency is typically only transient, and after initial response, drug resistance arises in most
patients17. A recent pioneering study that investigated vemurafenib resistance in-vitro in isogenic populations of
melanoma cells revealed that drug resistance can arise from a reversible epigenetic state that characterizes a rare
subpopulation of c ells5 (Fig. 1A). The study leveraged on cell cultures that were plated sparsely for monitoring
the long-term fate of individual cells and revealed that resistance is extremely heterogeneous and is correlated
with high expression of multiple resistance marker genes, many of which belong to the gene network responding
to extra-cellular growth factors (e.g., the growth factor receptors NGFR and EGFR).
The recent observations of drug resistance in a rare cell population through semi-coordinated high expression
of specific genes, such as growth factor receptors, agree with previous seminal work that revealed that rewiring
of signaling downstream to BRAF is a key step underlying adaptive r esistance13. This study tested vemurafenib
efficacy in diverse BRAFV600E mutated cell-lines and showed that although vemurafenib was initially efficient in
inhibiting downstream signaling, the shutdown was only transient. Within 24–48 h of drug administration, ERK
phosphorylation levels rebound until they stabilized on a new intermediate steady-state level. ERK reactivation
was suggested to originate from rewiring of the upstream signaling network that relieves an ERK-dependent
negative feedback that suppresses ligand-dependent signaling in untreated cells. The relief of ERK-dependent
negative feedback reactivates signal transduction through the generation of vemurafenib-resistant RAF dimers
and culminates in renewed cell proliferation. In agreement with this mechanism of rewiring, co-administration
of a MEK inhibitor with the targeted BRAF inhibitor mitigated signaling reactivation13. Additional observations
showing that stromal cell secretion of hepatocyte growth factor can elicit resistance against RAF inhibitors further
support the model of resistance through ligand-dependent signaling upon t reatment18.
Given the widely accepted model of signaling reactivation and the discovery of a rare cell population that is
drug resistant, an important open question that arises is therefore how signaling reactivation transpires at the
single-cell resolution. However, since most studies that investigated signaling rewiring relied on bulk assays,
methods that pool large cell populations together for measurements, the dynamics of signaling rewiring at the
single-cell resolution remain elusive. The diagram in Fig. 1A shows three alternative models of single-cell behav-
iors that are consistent with existing observations of signaling reactivation in bulk population assays. Under the
homogenous model (Fig. 1A, lower-left panel) signaling rewiring is homogenous across all cells irrespective of
their drug resistance state (only resistant cells later continue to proliferate). Under the alternative models, cell
behavior is heterogeneous. In one heterogeneous model (Fig. 1A, lower-middle panel), cell-to-cell variation
already emerges at the initial signaling inhibition phase. In this model signaling in resistant cells remains unaf-
fected by the drug and a profile of signaling reactivation seemingly arises since un-inhibited cells continue to
proliferate and gradually increase their proportion in the population. In a second heterogeneous model (Fig. 1A,
lower-right panel), all cells are initially inhibited by the drug, but resistant cells rapidly reactivate signaling.
In this study we examined how changes in ERK signaling transpire upon treatment at the single-cell resolution
and tested how signaling dynamics in individual cells correlate with their ultimate proliferation capacity (drug
resistance). Given observations that resistant cells highly express multiple growth factor receptors prior to drug
administration5, we hypothesized that rewiring of signaling will take place almost instantaneously for a small
sub-population of cells (following the homogenous inhibition, heterogeneous reactivation model in Fig. 1A).
We reasoned that this prediction can be tested by monitoring signaling dynamics within the first few hours of
treatment using a live-cell signaling reporter. We further predicted that single-cell measurements will allow us to
observe signaling reactivation much earlier than was previously reported in the literature since previous studies
relied on pooled population measurements that “average out” heterogeneous cellular responses. Lastly, we tested
if signaling dynamics immediately after treatment are good predictors of ultimate cell fate (drug resistance). We
tested our predictions using a combination of bulk-population measurements and high-throughput time-lapse
microscopy experiments. These approaches allowed us to monitor signaling dynamics in thousands of individual
cells and rigorously quantify cell–cell heterogeneity. In agreement with our prediction, we observed that despite
uniform initial inhibition, early reactivation of ERK signaling is observed within an hour for a small subpopula-
tion of cells and that these cells indeed proliferate more than non-recovering neighboring cells after multiple
days of drug treatment. We concluded that the identification of a rapidly recovering subpopulation supports the
hypothesis that a small fraction of melanoma cells pre-exists in a drug-resistant state and reconciles the widely
accepted model for drug recovery through rewiring of signaling with recent observations made in single cells.
Results
Bulk measurement of signaling inhibition and reactivation. The effect of BRAF inhibition on
MAPK signaling is typically monitored by testing the phosphorylation state of the downstream kinase ERK with
semi-quantitative biochemical methods, such as Western blots, that measure the phosphorylation state aver-
aged over large cell populations (e.g.13,19). In order to similarly quantify ERK phosphorylation levels (pERK) in
bulk populations we used the in-cell-Western (ICW) method previously used by us and others to monitor ERK
signaling20. Figure 1B shows a representative image of an ICW assay that measured ERK phosphorylation levels
Scientific Reports | (2021) 11:15473 | https://doi.org/10.1038/s41598-021-94941-8 2
Vol:.(1234567890)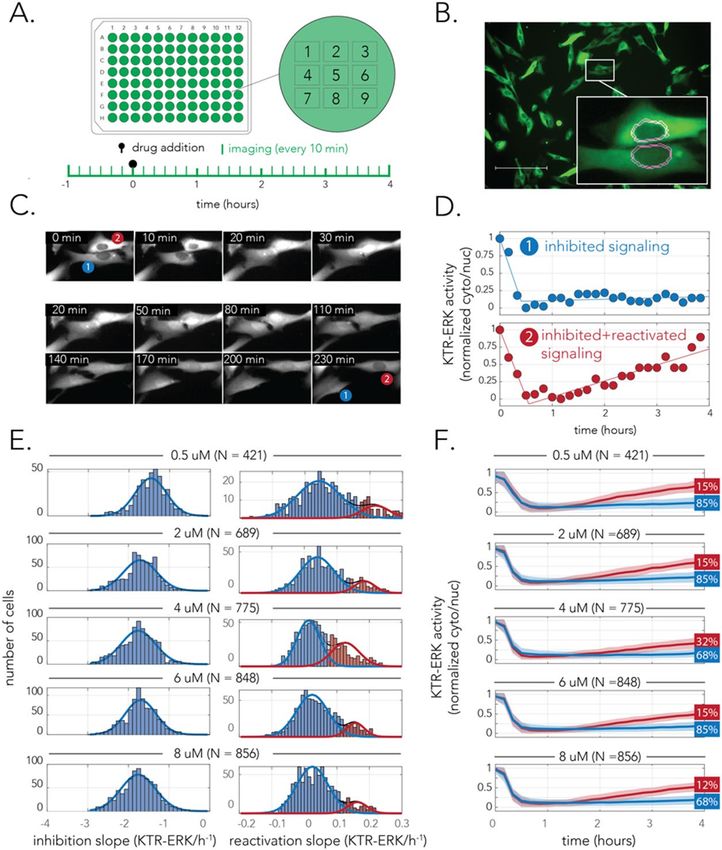
www.nature.com/scientificreports/

                                  Figure 1.  Reactivation of ERK signaling after vemurafenib treatment in bulk populations. (A) The epigenetic-
                                  based model for drug resistance and alternative models for signaling rewiring. High expression of a set of
                                  genes is thought to underlie a reversible drug-resistant state (upper-left panel). A small subpopulation of
                                  drug-resistant cells proliferates more than kin-cells after drug administration, however, the dynamics of
                                  signaling rewiring immediately after drug treatment in individual cells remains unknown (upper-right panel).
                                  The lower panels show three alternative models for signaling rewiring consistent with measurements from
                                  bulk populations. (B) A representative image of the immunofluorescence signal in the in-cell-western (ICW)
                                  method used for monitoring signaling activity 1 h after treatment. Cells growing in a micro-well plate were
                                  fixed and stained with an antibody specific for phosphorylated ERK (green). The wells were co-stained with a
                                  cell-dye (red) to monitor population size. The ratio between the two signals (green/red) marks the ERK activity
                                  normalized to cell number. (C) Vemurafenib impact on ERK signaling at different concentrations. The bars
                                  mark the relative pERK levels 1 h after treatment. (D) Vemurafenib impact on ERK signaling after multiple days
                                  of treatment. In both cell-lines, signaling recovers and rebounds to intermediate levels already within the first
                                  24 h (reactivation period is marked by shaded area). (E) Vemurafenib impact on ERK signaling after multiple
                                  hours of treatment. In both cell-lines, signaling inhibition is maximized 1 h after treatment and then marginally
                                  recovers within 2 h (shaded area). In all graphs (C–E), green bars mark the relative pERK levels after treatment
                                  averaged over 3 biological replicates and thin black bars mark standard deviation. The relative ERK activity is
                                  calculated by comparing its normalized level to the minimum and maximum levels observed. Stars mark pERK
                                  levels that are statistically higher than the maximum inhibition observed (one-tailed t-test with a Bonferroni
                                  corrected p-value for multiple statistical tests).

                                  1 h after adding vemurafenib. As the figure shows, we used a pERK antibody (marked in green) and a non-spe-
                                  cific cell stain (marked in red) to simultaneously monitor ERK phosphorylation and cell confluency in fixed cell
                                  cultures. Using this method, we were able to infer the relative ERK activity, normalized to population size, across

Scientific Reports |   (2021) 11:15473 |               https://doi.org/10.1038/s41598-021-94941-8                                                  3

                                                                                                                                              Vol.:(0123456789)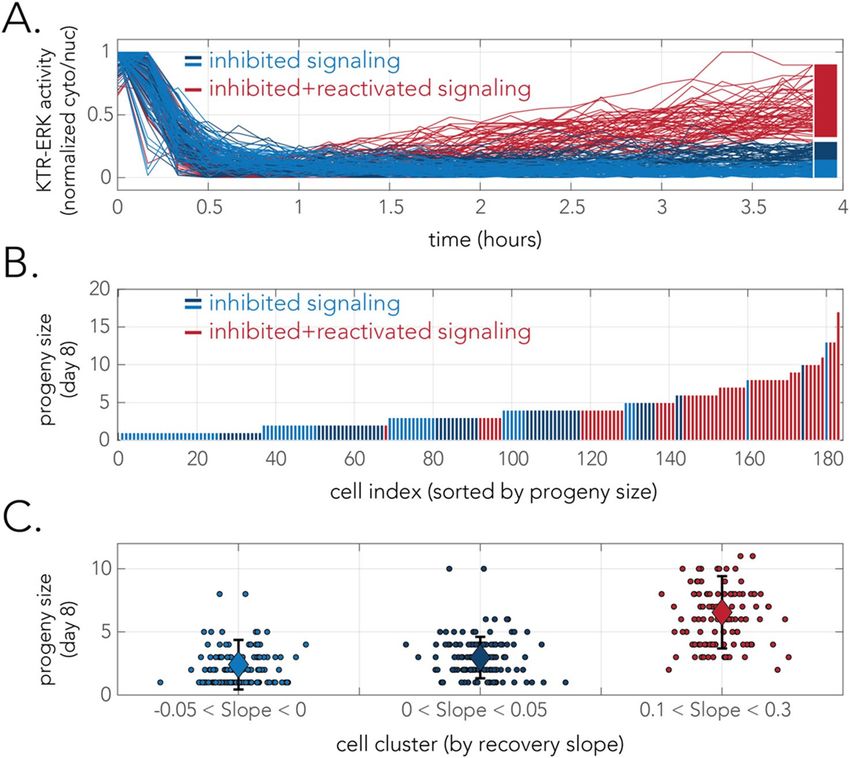
www.nature.com/scientificreports/
a range of drug concentrations. Figure 1C shows the drug response curve, as measured by pERK levels, in two
melanoma cell-lines harboring the oncogenic B RAFV600E mutation. A375 is a widely studied melanoma cell-line
and WM983B is a cell-line that was recently derived from a patient melanoma tumor5. We found that the drug
has reduced efficacy at a dose of 67.5 nM for A375 cells and 125 nM for WM983B cells (one-tailed t-test with a
Bonferroni corrected p-value of 0.005 for ten statistical tests). We concluded that in our experimental system,
vemurafenib is a potent signaling inhibitor at sub-micromolar concentrations for both cell-lines.
The previous discovery of signaling reactivation after B RAFV600E targeted inhibition revealed that pERK
levels can rebound within a few hours. However, in some cell-lines signaling reactivation can take significantly
longer and transpire only after multiple days. In order to validate that signaling reactivation exists in our cells
and estimate the timescale required for it to take place, we quantified pERK levels at 24 h intervals over 72 h
in both cell lines. Figure 1D shows the results of these bulk population measurements. We observed that for
both A375 and WM983B cells maximum inhibition was 1 h after the drug was added and that signaling levels
considerably rebounded within 24–48 h reaching an intermediate level (one-tailed t-test with a Bonferroni
corrected p-value of 0.01 for five statistical tests). The results for the A375 cell-line agree with previous observa-
tions made for this cell-line13. Since some recovery already takes place within the first 24 h, we next decided to
repeat the experiment and monitor the dynamics of pERK at a high time resolution within the first few hours
of adding the drug (Fig. 1E). The experiments revealed that pERK levels decay rapidly after treatment and that
inhibition is maximized after an hour. However, the experiments also revealed that signaling inhibition starts
to slowly weaken after 2 h of treatment (one-tailed t-test with a Bonferroni corrected p-value of 0.01 for five
statistical tests). Taken together our results show that vemurafenib leads to transient signaling inhibition with
initial signaling reactivation within 2 h of treatment. This observation is shorter than the previously observed
time window of 4 h identified using a Western b lot13. We note however, that since our ICW approach relies on
measurement of pERK level in bulk populations, it is insufficient to discriminate between the signaling rewiring
models presented in Fig. 1A.
Bulk measurement of growth arrest and recovery. Cells harboring the BRAFV600E mutation prolifer-
ate independently from growth-factors due to their oncogenic mutation. Previous work revealed that although
targeted inhibition of the mutated BRAF initially leads to growth arrest, this arrest is transient and that growth-
factor dependent proliferation can be later o bserved5,13. We tested if transient arrest existed in the two cell-lines
we used by time-lapse microscopy. We reasoned that microscopy observations will allow us to evaluate the mag-
nitude of recovery and evaluate the minimal time interval needed for growth recovery. Towards this aim we used
high-throughput time-lapse fluorescence microscopy and quantified changes in the cell numbers by automated
image analysis. Quantifying growth by changes in cell number is preferable to using culture confluence since cel-
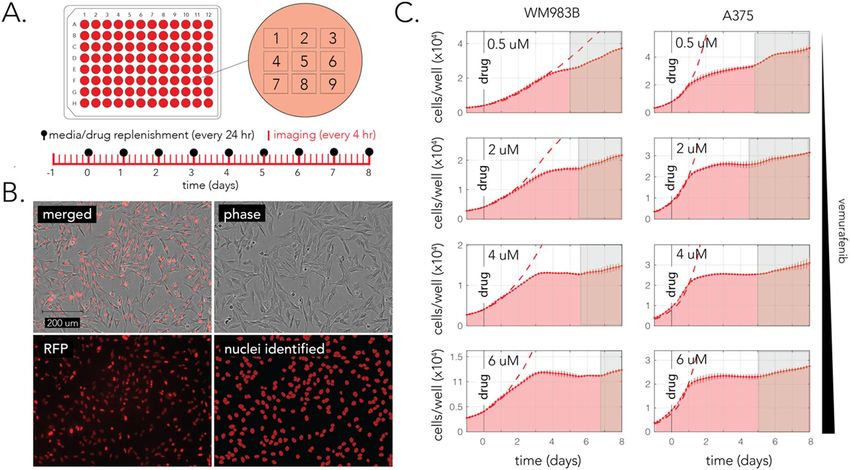
lular morphology is noticeably influenced by vemurafenib. Figure 2A shows our experimental setup. We plated
cells that constitutively expressed a fluorescent nuclear tag at low confluence in a micro-well plate and imaged
them over a week-long experiment at 4-h intervals. To minimize potential effects of gradual decreases in drug
potency during prolonged incubation due to drug degradation or cell metabolism, we replenished half of the
drug-containing media every day. This treatment also ensures that extracellular growth-factors will not be spent
by the cultured cells and that dead cells will be regularly removed. Extracellular growth factors were previously
shown to be important for growth recovery during vemurafenib treatament18. We then used automated image
analysis of fluorescence images to calculate the number of individual nuclei in each imaging field. Figure 2B
shows representative phase and fluorescence images of a single field of view and a mask image showing the nuclei
detected after segmentation of the fluorescence image.
We monitored the growth dynamics of cells in the presence of multiple drug concentrations. We focused on
a concentration range that we previously established as fully inhibitory according to pERK levels we observed 1
h after adding the drug (Fig. 1C). Figure 2C shows the results of our experiments across the four drug concen-
trations in the two tested cell-lines. We observed overall similar trends in growth, arrest, and recovery across
all experiment conditions. We observed an almost complete growth arrest, as compared with untreated control
cultures within a day or two of drug treatment (marked by a dashed line in Fig. 2C). However, we also detected
a slow but reproducible recovery from growth arrest (marked by shaded areas in the graph). The initial response
time, as measured by separation between the growth curve of treated and untreated cells, ranged from 24 h in
A375 cells to 48 h in WM983B cells. This difference likely originates from the different generation time of the
two cell-lines and the time it takes cells to complete the cell-cycle before arresting at the G1 stage due to the
drug21. Importantly, we observed that in both cell-lines the arrest in growth was transient (1–5 days) and that
the arrest period was inversely proportional to drug concentration. Lastly, it was also evident that at least in the
experiment’s time period, growth recovery was modest, with resumed growth being substantially slower than
the initial growth without the drug. In agreement with previous results showing growth recovery dependance on
extracellular growth factors, we also observed a correlation between growth recovery and media replenishment
frequency (Supplementary Fig. S1). Taken together, these results confirm that growth arrest is indeed transient,
and establish that growth can resume very early after the arrest. Establishing this timeline was key for designing
the subsequent time-lapse microscopy experiments that monitored both signaling and growth.
Single‑cell measurement of signaling inhibition and reactivation. Bulk measurements of signal-
ing dynamics and cell growth allowed us to outline the relevant period for signaling reactivation and growth
recovery (Figs. 1, 2). However, these experiments were insufficient for clarifying the dynamics of individual
cells and determining the underlying signaling rewiring model (Fig. 1A). Multiple previous studies by us and
many others used translocation-based fluorescent reporters to monitor signaling activity in individual live-cells
(e.g.22,23). Such reporters alter their subcellular localization in response to a posttranscriptional modification,
Scientific Reports | (2021) 11:15473 | https://doi.org/10.1038/s41598-021-94941-8 4
Vol:.(1234567890)www.nature.com/scientificreports/
Figure 2. Transient growth arrest after vemurafenib treatment in bulk populations. (A) A diagram of the drug
treatment and imaging protocol. Cells were plated in a 96-well microplate and drug was replenished every 24 h.
Each well was imaged with nine non-overlapping imaging fields and treatments were applied in duplicates. (B)
Representative microscopy images and the paired image analysis for counting nuclei number in each imaging
field. (C) Changes in cell number over 8 days of drug treatment across multiple drug concentrations. The red
area shows the inferred number of cells (per well) in drug treated wells (the bars show the standard deviation
across biological replicates). The dashed red line shows the number of cells in a control (no-drug) experiment.
The gray area shows the period with notable growth recovery (determined by eye). We observed growth
recovery in both cell-lines, across all drug concentrations.
such as phosphorylation by the kinase of interest, and therefore provide an almost instantaneous marker of the
signaling status without hampering cell viability. In order to monitor signaling downstream to BRAF we used a
previously developed fluorescent kinase-translocation-reporter (KTR) that localizes primarily in the cytoplasm
when ERK is active and pERK level is high24 (Supplementary Fig. S2). In contrast, when BRAF activity is inhib-
ited and pERK levels drop, the KTR localizes primarily in the nucleus. Figure 3A shows our experimental setup.
We plated cells that constitutively expressed a fluorescent nuclear tag and the KTR-ERK reporter at low conflu-
ence in micro-well plates and imaged the cells every 10 min over 4 h after treatment. We decided to conduct
these experiments with WM983B cells since the rare subpopulation of resistant cells was well characterized in
this cell-line5.
We developed an automated image analysis pipeline for monitoring signaling dynamics in individual cells
in our time-lapse microscopy experiments. The approach relied on monitoring KTR-ERK fluorescent intensity
in each of the imaged cells in addition to tracking cells over consecutive time points of the experiment (see
“Methods” section). Figure 3B shows a representative image of cells expressing the KTR-ERK reporter and our
approach for image segmentation (Fig. 3B inset). We segmented the nuclear region and a thin ring-shaped region
around it to infer the ERK activity from the KTR-ERK intensity in the nucleus and c ytoplasm25. Figure 3C shows
a montage of two cells over the 4 h of the experiment as the KTR-ERK reporter translocated from the cytoplasm
to the nucleus in response to BRAF inhibition. As the images show, KTR-ERK translocation can be easily detected
within 20 min of adding the drug. Figure 3D shows the signaling dynamics we inferred with our image analysis
pipeline for the cells presented in the montage. As the figure shows, although signaling in the two cells had a
similar profile in the first hour, they greatly differed in later time points—signaling clearly recovered in cell #2
while it remained fully inhibited in cell #1. In order to capture the temporal dynamics of the signaling profile we
fitted the observations made in each cell to a phenomenological model with only three parameters. The signal-
ing dynamics are fitted to a two-stage linear model that capture the slope of signaling inhibition, and the slope
of signaling reactivation (or plateaued inhibition). The fitted model for the two cells is represented by the line
graphs in Fig. 3D. It is important to note that although more complicated models can surely be used to fit the
data, reduction of the dynamics to a two-phase linear model worked very well and was sufficient for our purposes.
The experimental setup we used, coupled with our automated image analysis pipeline, allowed us to simul-
taneously monitor the signaling dynamics of hundreds of cells in a single experiment. We therefore reasoned
that this approach would allow us to identify if signaling dynamics are homogenous or heterogeneous across
identically treated cells that are cultured together in a single micro-plate well. Towards this goal we decided to
evaluate the regularity of signaling dynamics by inspecting the distribution of the signaling inhibition slopes
Scientific Reports | (2021) 11:15473 | https://doi.org/10.1038/s41598-021-94941-8 5
Vol.:(0123456789)www.nature.com/scientificreports/
Figure 3. Single-cell measurements of signaling reveal homogenous inhibition yet heterogeneous signaling
reactivation in WM983B cells. (A) A diagram of the drug treatment and imaging protocol. Cells were plated in a
96-well microplate and were imaged every 10 min over 4 h after drug treatment. (B) Representative microscopy
image of the translocation fluorescent reporter used to monitor ERK signaling. Image analysis was used to
segment both the nucleus region of each cell and a narrow ring surrounding it (to evaluate reporter intensity in
the cytoplasm). (C) Microscopy images of changes in KTR-ERK in two neighboring cells after drug treatment.
Upon 20 min of treatment the fluorescent reporter translocated to the nucleus in both cells (indicating ERK
signaling is inhibited). The reporter partially translocated back to the cytoplasm after a few hours in cell #2.
(D) Quantification of reporter localization in the two cells shown in (C) over time reveals different signaling
reactivation in neighboring cells. The markers show the ERK activity relative to the range observed during the
experiment as determined by the KTR-ERK reporter. The lines show the two-phase linear model that was fitted
to the data points collected. Signaling reactivation starts as early as after 1 h in cell #2 while signaling remains
inhibited in cell #1. (E) Cellular heterogeneity is observed in signaling reactivation but not in initial signaling
inhibition. The histograms show the slopes of signaling inhibition (left panels) and signaling reactivation
(right panels) across hundreds of co-cultured cells. The histograms were fitted to both unimodal and bimodal
gaussians to test for heterogeneity and determine if dynamics were homogenous (unimodal) or heterogeneous
(bimodal) with a statistical test. The histograms are colored with one or two colors according to the fit result and
the underlying distributions are shown in thin blue and red lines. (F) Signaling profiles of all cells grouped and
colored according to the bimodal distributions of signaling reactivation. The lines mark the average signaling
status for the cell group and the shaded area shows the standard deviation. The numbers at the end of the graphs
show the percentage of cells belonging to the cell group.
and the distribution of the signaling reactivation slopes. We expected that homogenous behaviors across the cell
population will transpire as unimodal distribution while heterogeneous behaviors will transpire as multimodal
distribution. Figure 3E shows the histograms of signaling inhibition and reactivation slopes in five different
drug concentrations, all of which are expected to be fully inhibitory by their initial impact (Fig. 1C). We used a
Kolmogorov–Smirnov statistical test to see if the histograms better fit a single unimodal gaussian or a bimodal
gaussian (mixture of two unimodal gaussians). This analysis revealed that the initial stage of drug response,
signaling inhibition, is homogenous in the cell population across the entire drug concentration range. How-
ever, the same analysis revealed that signaling reactivation is heterogeneous and fits a mixture of two unimodal
gaussian distributions (marked in red and blue lines in the figure). This bimodal distribution indicated that the
Scientific Reports | (2021) 11:15473 | https://doi.org/10.1038/s41598-021-94941-8 6
Vol:.(1234567890)www.nature.com/scientificreports/
population consists of two differently behaving subpopulations: signaling remains inhibited for the majority of
cells yet it gets reactivated in a minority of them. The signaling dynamics of these two subpopulations is similar
to that presented for the two cells in Fig. 3D. Importantly, our analysis also allows us to estimate the proportion
of each subpopulation from all imaged cells (marked by the percentage numbers at the edge of the graphs in
Fig. 3F). These estimations showed that the proportion of the recovering subpopulation is almost identical across
all tested drug concentrations (averaging around 15%).
Taken together, our single-cell results indicate that WM983B cells can be stratified into two subpopulations
by their signaling response to vemurafenib within the first few hours of treatment—a large group of cells that
remains inhibited and a small group capable of reactivating signaling after initial inhibition within an hour
of treatment. These dynamics support the homogenous inhibition and heterogeneous reactivation model of
signaling rewiring presented in Fig. 1A. Furthermore, the short time-scale in which the differences between the
two subpopulations manifests itself is too short to be explained by a different transcriptional program that is
triggered post-treatment. The differences in signaling rewiring therefore likely reflect dissimilar transcriptional
states that pre-existed the drug. This hypothesis is further supported by the observation that the same fraction
of cells recovered irrespectively from the drug concentration used.
Single‑cell measurement of growth recovery. Our long-term measurement of bulk population
growth after drug treatment revealed that the cell cultures are transiently arrested and then resume growth at a
slow rate (Fig. 2C). Given the cell–cell heterogeneity we observed in signaling reactivation, a key question that
arises is whether the signaling profile of a cell within hours of drug treatment is a good predictor of its prolifera-
tion capacity. To address this question, we combined the experimental approaches we used previously (Figs. 2,
3) in a two-phase time-lapse microscopy experiment. In this experiment we first monitored early signaling
dynamics, at a high time resolution, and then continued and monitored the proliferation of individual cells over
7 days at a lower time resolution (see “Methods” section). Since accurately tracking individual cell lineages over
multiple days was impractical by automated image analysis (due to cell movement, division, and detachment) we
tracked lineages by eye after observing time-lapse microscopy images.
In these experiments we focused on the WM983B cells treated with a single inhibitory concentration of
vemurafenib throughout the experiment (6 uM) and focused on a representative sample of 180 cells chosen by
their early signaling dynamics. Figure 4A shows the signaling dynamics of the subset of cells that we chose for
this analysis (taken from two independent experiments). A sample group of 120 cells was chosen to represent
the major subpopulation of non-recovering cells (blue lines in Fig. 4A). This group was further subdivided into
a group of 60 fully inhibited cells (light blue lines) and a group of 60 inhibited cells with a marginal recovery
(dark blue lines). A sample group of 60 cells was chosen to represent the minor subpopulation of signaling
reactivating cells (red lines in Fig. 4A). We next counted how many cells descended from the 180 monitored
cells during a period of seven days of drug treatment (a period sufficient to detect growth recovery, Fig. 2C).
Figure 4B shows bar plots representing the lineage size originating from each tracked cell after sorting the cells
by their number of decedents and coloring the bars according to the early signaling dynamics. As the figure
shows, we observed that cells characterized by early signaling recovery (red bars) had significantly larger line-
ages than non-recovering cells (blue bars). A non-parametric statistical test on the rank order of cells from the
two groups rejected the null hypothesis that they are characterized by identical lineage sizes (p-valuewww.nature.com/scientificreports/
Figure 4. Single-cell measurements connect early signaling recovery with long term drug resistance. (A)
Signaling dynamics at the first 4 h after drug treatment of 180 cells treated with inhibitory concentration of
vemurafenib (6 uM). The colors mark the signaling recovery capacity of the cells (recovering cells in red and
non-recovering cells in blue). The identity of the cells was determined solely according to the slope of the
signaling curve after the initial inhibition phase. The non-recovering cells were further subdivided to strongly
inhibited cells (light blue) and weakly inhibited cells (light blue). (B) Lineage sizes descending from the 180 cells
after seven days of drug treatment. The bars show the lineage descending from single cells and the bar colors
mark initial signaling recovery of the ancestor cell. (C) Lineage sizes descending from ancestor cells according to
the signaling recovery group. Each point marks the lineage descending from a single ancestor cell and the large
diamond markers show the average lineage size. Error bars represent standard deviation.
It is important to note that there is a considerable challenge in gathering such direct evidence of a connec-
tion between cellular processes that manifest on such different time scales that might also be highly hetero-
geneous across the population. First, work on heterogeneity requires single-cell assays that are typically more
demanding than bulk population measurements and typically rely on “end-point” assays that require fixing the
cells (e.g., immunofluorescence) or at least significantly perturbing them (e.g., live-cell cytometry). Due to this
limitation, multiple independent observations, as signaling and subsequent proliferation, can rarely be done
on the same exact cell. Additionally, in this specific model system, there is the need to simultaneously monitor
multiple cellular processes, from cell-to-cell differences in the transcriptional program that exist for days before
the drug treatment5, followed by rewiring of the signaling network that can transpire within minutes of drug
treatment, and eventually with changes in cell proliferation that take multiple d ays13. Indeed, this challenge
of bridging events that transpire on multiple time-scales is common to many model systems in cell b iology30.
Here we addressed this challenge by performing time-lapse microscopy experiments, at different time resolu-
tions, in a week-long experiment while maintaining ideal growth conditions (without any perturbations to the
treated cells). This methodology has proven valuable in bridging such time gaps between a fast signaling event,
transcriptional response and cell fate decisions in the past (e.g.23,26–29). While being demanding, this approach
allowed us to make single-cell observations and gather direct evidence establishing a clear connection between
early signaling dynamics and long-term proliferation capacity. These observations fill in a critical piece of the
puzzle that connected the widely accepted rewiring model, suggested a decade ago, to population heterogeneity
in drug sensitivity that was reported only very recently5.
The experimental approach we present here can be further used to address additional open questions in
this important model system. For example, while we established a connection between signaling dynamics and
drug resistance, additional work will be required to establish a connection between the transcriptional state of
cells pre-treatment and their signaling dynamics post-treatment. However, this connection may not be easy to
establish given that cells existing in the resistant state prior to the drug may themselves be highly heterogeneous,
Scientific Reports | (2021) 11:15473 | https://doi.org/10.1038/s41598-021-94941-8 8
Vol:.(1234567890)www.nature.com/scientificreports/
with different resistant cells over-expressing a different set of resistance genes5. Another important question that
might be addressed using our microscopy approach concerns the stability and inheritance of the resistance state.
For example, it is possible to monitor if kin-cells that descended from a common ancestor prior to treatment
share a common signaling profile as a function of the time that elapsed from cell division to drug treatment.
Such measurements can help refine parameters of the state model previously developed for these melanoma
cells5. Alternatively, information regarding other signaling pathways can also be collected using orthogonal
live-cell reporters in order to provide direct evidence of additional early signaling events that predict long-term
drug resistance. Such investigation is highly interesting in the context of the JNK pathway that was previously
suggested to be implicated in vemurafenib drug r esistance12,14.
Methods
Cell‑lines and media and antibodies. A375 (ATCC) and WM983B (Arjun Raj lab) cells were cultured
in DMEM supplemented with 5% fetal bovine serum (Gibco FBS cat# 26140-079) and incubated at 37 °C with
5% CO2. All experiments were conducted by plating cells on 96-well plates 12–18 h before starting the experi-
ment. BRAF targeted inhibition was achieved with Vemurafenib (Selleckchem, PLX4032). Time lapse micros-
copy experiments were performed with cells constitutively expressing fluorescent reporters after infection with
lentivirus.
Live‑cell fluorescent reporters. Plasmid constructs for mammalian expression were cloned into the pHR
lentiviral backbone similarly to our previous work22. We cloned the mammalian histone H2B-mRuby and the
pathway reporter KTR(ERK)-mEGFP24 into separate plasmids. Lentivirus was produced by co-transfecting the
pHR plasmids and vectors encoding packaging proteins (pMD2.G and p8.91) using the Fugene 6 HD transfec-
tion reagent in HEK-293T cells plated in 6-well plates at ∼ 70% confluency. Viral supernatants were collected
2 days after transfection and 0.45 μm filtered and used for transduction immediately. A375 and WM983B cells
were cultured in 5% fetal bovine serum in DMEM at 37 °C with 5% C O2 in a humidified incubator. For viral
transduction, cells were plated in 6-well plates to achieve ∼ 20% confluency at the time of infection. For lentiviral
transduction, we added 50 μL of virus supernatant directly to cells. Viral media was replaced with growth media
24 h post infection.
72‑h dose response (ICW). A375 and WM983B were seeded in 96-well plates (Greiner, 655090; 7500 cells/
well) in 100 uL media the day before treatment. Vemurafenib (Selleckchem, PLX4032; 2× in 100 uL media) was
added to wells in triplicate with doses 0 uM, 0.031 uM, 0.062 uM, 0.125 uM, 0.25 uM, 0.5 uM, 1uM, 2 uM, 4 uM,
8 uM for 1 h. Vemurafenib media was removed and wells were washed 3 times with fresh media before replenish-
ing wells with 200 uL media. After 72 h, cells were analyzed with an in-cell western.
pERK peak inhibition and recovery (ICW). A375 and WM983B were seeded in 96-well plates (Greiner,
655090; 10,000 cells/well) in 100 uL media in triplicate the day before treatment. Vemurafenib (Selleckchem,
PLX4032; 2× in 100 uL media) was added for a final concentration of 0.5uM. Cells were treated for 0, 0.25, 0.5,
1, 2, and 4 h (peak inhibition and short-term recovery) and for 0, 1, 24, 48, and 72 h (long-term recovery) before
analyzing with an in-cell western.
In‑cell western. Cells were grown and treated in 96-well plates. Treated cells were fixed with 3.7% formalde-
hyde for 20 min at room temperature (RT) and washed 2 times with 200 uL PBS (RT). Cells were permeabilized
with 200 uL/well 0.5% Triton X-100 (10 min, RT) and blocked with 150 uL/well Odyssey Blocking Buffer (LI-
COR) for 1.5 h at RT with 300 rpm shaking. Cells were incubated overnight at 4 °C with anti-phospho-Erk1/2
(Cell Signaling #4370; 1:400). Primary antibody solution was removed and wells were washed 5 times with 200
uL PBS-T (5 min each, RT, 300 rpm). A near-infrared (800 nm) fluorescent secondary antibody (LI-COR 926-
32210; 1:800) and near-infrared (700 nm) cell counterstain (LI-COR 926-41090; 1:2000) were incubated with
cells (1 h, RT, 300 rpm). Secondary antibody was removed before washing wells 2 times with 200 uL PBS-T
(5 min each, RT, 300 rpm). 96-well plates were imaged with LI-COR Odyssey. Signal (800 nm and 700 nm) per
well was quantified using Image Studio Lite (LI-COR). Relative phospho-Erk1/2 signal per well was determined
by dividing the phospho-Erk1/2 signal (800 nm) by the CellTag signal (700 nm) and replicates averaged (mean).
Time‑lapse microscopy and automated image analysis. For imaging, cells were plated in 96-well
TC-treated plates (Eppendorf) at a concentration of 3000 cells/well and were allowed to adhere over night before
imaging started (12–18 h). All microscopy images were obtained using an IncuCyte S3 microscope platform
(Sartorius) that is placed inside a humidified incubator with temperature and CO2 control. We used built-in filter
sets in the IncuCyte microscope (Green/Red 4616 optical module) to monitor GFP (300 ms acquisition time),
RFP (400 ms acquisition time) and phase channels. For experiments monitoring cellular signaling we imaged
nine none-overlapping fields in each well with a × 20 magnification objective with time intervals of 10 min. For
experiments monitoring cell growth, we imaged nine none-overlapping fields in each well with a × 20 magnifica-
tion objective with time intervals of 1 h. All experiments were conducted with biological replicates in separate
wells (indicated in the “Results” section).
Image analysis was performed similarly to our previous w ork22 with the propriety software of the IncuCyte
microscope and additional custom written computer scripts developed in MATLAB (Mathworks). Calculation
of nuclei number in each imaging field was based on segmentation of the mRuby fluorescence signal with the
IncuCyte software. We used Top-Hat algorithm to correct for uneven illumination. We used area and eccentricity
Scientific Reports | (2021) 11:15473 | https://doi.org/10.1038/s41598-021-94941-8 9
Vol.:(0123456789)www.nature.com/scientificreports/
filters to further remove fluorescent objects that are not live cells (specs of dust, cellular debris). The number of
nuclei per well was calculated by summing the number of objects detected over all imaging fields and multiply-
ing a constant conversion coefficient (the coefficient is the ratio of well surface area over the total area of the
imaging fields).
To analyze signaling dynamics we first segmented the nuclei according to the mRuby fluorescence signal
using the IncuCyte software and produced black/white mask images that correspond to the detected nuclei. These
mask images were first used for registration of fluorescence images (aligning consecutive images to account for
systematic drift) and then used for segmenting individual cells and inferring the signaling activities (inferring the
localization of the nucleus region and cytoplasm ring region and in the signal intesity22,25). For image registration
we used the Descriptor based registration plugin31 in the Fiji distribution32 of ImageJ33. Registered images were
then used as input to a Matlab script that segmented all the objects (nuclei) in each mask image and a narrow
ring region around the segmented nuclei. We subtracted the background fluorescence from GFP images and
measured the 80th percentile nuclear intensity and the corresponding cytoplasm ring region. Pathway activity
was calculated as the ratio between the signals of the cytoplasm ring and the nuclear r egion22. Lastly, in order to
track temporal changes in signaling activity, we reconstructed continuous pathway activity for each cell over the
entire time-lapse period (4 h) by tracking individual cells over time. Cell tracking was performed with a Matlab
script that assigned to each nucleus the spatially closest nucleus over consecutive time points while filtering out
nuclei that move to far or underwent significant changes in their area (typically corresponding to cells undergo-
ing mitosis). By assigning highly conservative filters for removing suspicious nuclei we were able to maintain
highly reliable tracks for over half of all detected nuclei (estimated by inspection of tracks for individual random
cells). Nuclei that were filtered out were ones that migrated out of the imaging area, underwent mitosis or lost
adherence during the experiment.
Received: 28 April 2021; Accepted: 16 July 2021
References
1. Burrell, R. A., McGranahan, N., Bartek, J. & Swanton, C. The causes and consequences of genetic heterogeneity in cancer evolution.
Nature 501, 12625 (2013).
2. Black, J. R. M. & McGranahan, N. Genetic and non-genetic clonal diversity in cancer evolution. Nat. Rev. Cancer. https://doi.org/
10.1038/s41568-021-00336-2 (2021).
3. Flavahan, W. A., Gaskell, E. & Bernstein, B. E. Epigenetic plasticity and the hallmarks of cancer. Science 357, 2380 (2017).
4. Puig, I. et al. TET2 controls chemoresistant slow-cycling cancer cell survival and tumor recurrence. J. Clin. Investig. 128, 3887–3905
(2018).
5. Shaffer, S. M. et al. Rare cell variability and drug-induced reprogramming as a mode of cancer drug resistance. Nature 546, 431–435
(2017).
6. Sharma, S. V. et al. A chromatin-mediated reversible drug-tolerant state in cancer cell subpopulations. Cell 141, 69–80 (2010).
7. Marjanovic, N. D. et al. Emergence of a high-plasticity cell state during lung cancer evolution. Cancer Cell 38, 229–246 (2020).
8. LaFave, L. M. et al. Epigenomic state transitions characterize tumor progression in mouse lung adenocarcinoma. Cancer Cell 38,
212–228 (2020).
9. Hoefflin, R. et al. Spatial niche formation but not malignant progression is a driving force for intratumoural heterogeneity. Nat.
Commun. 7, 11845 (2016).
10. Lloyd, M. C. et al. Darwinian dynamics of intratumoral heterogeneity: Not solely random mutations but also variable environmental
selection forces. Cancer Res. 76, 3136–3144 (2016).
11. Korenchan, D. E. & Flavell, R. R. Spatiotemporal pH heterogeneity as a promoter of cancer progression and therapeutic resistance.
Cancers 11, 1026 (2019).
12. Fallahi-Sichani, M. et al. Adaptive resistance of melanoma cells to RAF inhibition via reversible induction of a slowly dividing
de-differentiated state. Mol. Syst. Biol. 13, 905 (2017).
13. Lito, P. et al. Relief of profound feedback inhibition of mitogenic signaling by RAF inhibitors attenuates their activity in BRAFV600E
melanomas. Cancer Cell 22, 668–682 (2012).
14. Fallahi-Sichani, M. et al. Systematic analysis of BRAF(V600E) melanomas reveals a role for JNK/c-Jun pathway in adaptive resist-
ance to drug-induced apoptosis. Mol. Syst. Biol. 11, 797 (2015).
15. Cantwell-Dorris, E. R., O’Leary, J. J. & Sheils, O. M. BRAFV600E: Implications for carcinogenesis and molecular therapy. Mol.
Cancer Ther. 10, 385–394 (2011).
16. Bollag, G. et al. Vemurafenib: The first drug approved for BRAF-mutant cancer. Nat. Rev. Drug Discov. 11, 873–886 (2012).
17. Flaherty, K. T. et al. Inhibition of mutated, activated BRAF in metastatic melanoma. New Engl. J. Med. 363, 809–819 (2010).
18. Straussman, R. et al. Tumour micro-environment elicits innate resistance to RAF inhibitors through HGF secretion. Nature 487,
500–504 (2012).
19. Haferkamp, S. et al. Vemurafenib induces senescence features in melanoma cells. J. Investig. Dermatol. 133, 1601–1609 (2013).
20. Bugaj, L. J. et al. Cancer mutations and targeted drugs can disrupt dynamic signal encoding by the Ras-Erk pathway. Science 361,
3048 (2018).
21. Salerno, P. et al. Cytostatic activity of adenosine triphosphate-competitive kinase inhibitors in BRAF mutant thyroid carcinoma
cells. J. Clin. Endocrinol. Metab. 95, 450–455 (2010).
22. Shraga, A. et al. Covalent docking identifies a potent and selective MKK7 inhibitor. Cell Chem. Biol. 26, 98–108 (2019).
23. Mitchell, A., Wei, P. & Lim, W. A. Oscillatory stress stimulation uncovers an Achilles’ heel of the yeast MAPK signaling network.
Science 350, 1379–1383 (2015).
24. Regot, S., Hughey, J. J., Bajar, B. T., Carrasco, S. & Covert, M. W. High-sensitivity measurements of multiple kinase activities in
live single cells. Cell 157, 1724–1734 (2014).
25. Kudo, T. et al. Live-cell measurements of kinase activity in single cells using translocation reporters. Nat. Protoc. 13, 155–169
(2018).
26. Karanam, K., Kafri, R., Loewer, A. & Lahav, G. Quantitative live cell imaging reveals a gradual shift between DNA repair mecha-
nisms and a maximal use of HR in mid S phase. Mol. Cell 47, 320–329 (2012).
27. Purvis, J. E. et al. p53 dynamics control cell fate. Science 336, 1440–1444 (2012).
Scientific Reports | (2021) 11:15473 | https://doi.org/10.1038/s41598-021-94941-8 10
Vol:.(1234567890)www.nature.com/scientificreports/
28. Spencer, S. L., Gaudet, S., Albeck, J. G., Burke, J. M. & Sorger, P. K. Non-genetic origins of cell-to-cell variability in TRAIL-induced
apoptosis. Nature 459, 428 (2009).
29. Lee, R. E. C., Walker, S. R., Savery, K., Frank, D. A. & Gaudet, S. Fold change of nuclear NF-κB determines TNF-induced transcrip-
tion in single cells. Mol. Cell 53, 867–879 (2014).
30. Tsabar, M., Lovitch, S. B., Jambhekar, A. & Lahav, G. Connecting timescales in biology: Can early dynamical measurements predict
long-term outcomes? Trends Cancer 7, 301–308 (2021).
31. Preibisch, S., Saalfeld, S., Schindelin, J. & Tomancak, P. Software for bead-based registration of selective plane illumination micros-
copy data. Nat. Methods 7, 418–419 (2010).
32. Schindelin, J. et al. Fiji: An open-source platform for biological-image analysis. Nat. Methods 9, 676–682 (2012).
33. Schneider, C. A., Rasband, W. S. & Eliceiri, K. W. NIH image to ImageJ: 25 years of image analysis. Nat. Methods 9, 671–675 (2012).
Acknowledgements
We thank the lab of Dr. Arjun Raj for providing us with the WM983B melanoma cell line. We thank Dr. Hyun
Youk for comments on the manuscript.
Author contributions
P.K.—Experiments, Data curation, Software, Formal analysis, Validation, Investigation, Visualization, Method-
ology; E.L.—Experiments, Data curation, Software, Formal analysis, Validation, Investigation, Visualization,
Methodology, Writing and Editing; A.M.—Conceptualization, Data curation, Software, Formal analysis, Valida-
tion, Investigation, Visualization, Methodology, Writing and Editing.
Funding
The research reported in this article was supported by NIGMS of the National Institutes of Health under Award
Number R35GM133775 to AM.
Competing interests
The authors declare no competing interests.
Additional information
Supplementary Information The online version contains supplementary material available at https://doi.org/
10.1038/s41598-021-94941-8.
Correspondence and requests for materials should be addressed to A.M.
Reprints and permissions information is available at www.nature.com/reprints.
Publisher’s note Springer Nature remains neutral with regard to jurisdictional claims in published maps and
institutional affiliations.
Open Access This article is licensed under a Creative Commons Attribution 4.0 International
License, which permits use, sharing, adaptation, distribution and reproduction in any medium or
format, as long as you give appropriate credit to the original author(s) and the source, provide a link to the
Creative Commons licence, and indicate if changes were made. The images or other third party material in this
article are included in the article’s Creative Commons licence, unless indicated otherwise in a credit line to the
material. If material is not included in the article’s Creative Commons licence and your intended use is not
permitted by statutory regulation or exceeds the permitted use, you will need to obtain permission directly from
the copyright holder. To view a copy of this licence, visit http://creativecommons.org/licenses/by/4.0/.
© The Author(s) 2021
Scientific Reports | (2021) 11:15473 | https://doi.org/10.1038/s41598-021-94941-8 11
Vol.:(0123456789)You can also read