Enhancement of the Tolerogenic Phenotype in the Liver by ImmTOR Nanoparticles
←
→
Page content transcription
If your browser does not render page correctly, please read the page content below
ORIGINAL RESEARCH
                                                                                                                                  published: 25 May 2021
                                                                                                                         doi: 10.3389/fimmu.2021.637469

                                          Enhancement of the Tolerogenic
                                          Phenotype in the Liver by
                                          ImmTOR Nanoparticles
                                          Petr O. Ilyinskii , Christopher J. Roy , Julie LePrevost , Gina L. Rizzo
                                          and Takashi Kei Kishimoto *

                                          Selecta Biosciences, Watertown, MA, United States

                                          ImmTOR biodegradable nanoparticles encapsulating rapamycin have been shown to
                                          induce a durable tolerogenic immune response to co-administered biologics and gene
                                          therapy vectors. Prior mechanism of action studies have demonstrated selective
                         Edited by:
                                          biodistribution of ImmTOR to the spleen and liver following intravenous (IV)
                     Hyewon Phee,         administration. In the spleen, ImmTOR has been shown to induce tolerogenic dendritic
                Amgen, United States
                                          cells and antigen-specific regulatory T cells and inhibit antigen-specific B cell activation.
                       Reviewed by:
                                          Splenectomy of mice resulted in partial but incomplete abrogation of the tolerogenic
                           Linda Diehl,
 University Medical Center Hamburg-       immune response induced by ImmTOR. Here we investigated the ability of ImmTOR to
                  Eppendorf, Germany      enhance the tolerogenic environment in the liver. All the major resident populations of liver
                         James Moon,
 University of Michigan, United States
                                          cells, including liver sinusoidal endothelial cells (LSECs), Kupffer cells (KC), stellate cells
                  *Correspondence:
                                          (SC), and hepatocytes, actively took up fluorescent-labeled ImmTOR particles, which
                Takashi Kei Kishimoto     resulted in downregulation of MHC class II and co-stimulatory molecules and upregulation
          kkishimoto@selectabio.com
                                          of the PD-L1 checkpoint molecule. The LSEC, known to play an important role in hepatic
                   Specialty section:
                                          tolerance induction, emerged as a key target cell for ImmTOR. LSEC isolated from
         This article was submitted to    ImmTOR treated mice inhibited antigen-specific activation of ovalbumin-specific OT-II T
             Immunological Tolerance      cells. The tolerogenic environment led to a multi-pronged modulation of hepatic T cell
                       and Regulation,
               a section of the journal   populations, resulting in an increase in T cells with a regulatory phenotype, upregulation of
              Frontiers in Immunology     PD-1 on CD4+ and CD8+ T cells, and the emergence of a large population of CD4–CD8–
      Received: 03 December 2020          (double negative) T cells. ImmTOR treatment protected mice in a concanavalin A-induced
          Accepted: 05 May 2021
          Published: 25 May 2021
                                          model of acute hepatitis, as evidenced by reduced production of inflammatory cytokines,
                             Citation:
                                          infiltrate of activated leukocytes, and tissue necrosis. Modulation of T cell phenotype was
    Ilyinskii PO, Roy CJ, LePrevost J,    seen to a lesser extent after administration by empty nanoparticles, but not free
   Rizzo GL and Kishimoto TK (2021)       rapamycin. The upregulation of PD-1, but not the appearance of double negative
      Enhancement of the Tolerogenic
              Phenotype in the Liver by   T cells, was inhibited by antibodies against PD-L1 or CTLA-4. These results suggest
               ImmTOR Nanoparticles.      that the liver may contribute to the tolerogenic properties of ImmTOR treatment.
          Front. Immunol. 12:637469.
   doi: 10.3389/fimmu.2021.637469         Keywords: immune tolerance, ImmTOR, rapamycin, liver, LSECs, double-negative T cells, regulatory T cells

Frontiers in Immunology | www.frontiersin.org                                  1                                   May 2021 | Volume 12 | Article 637469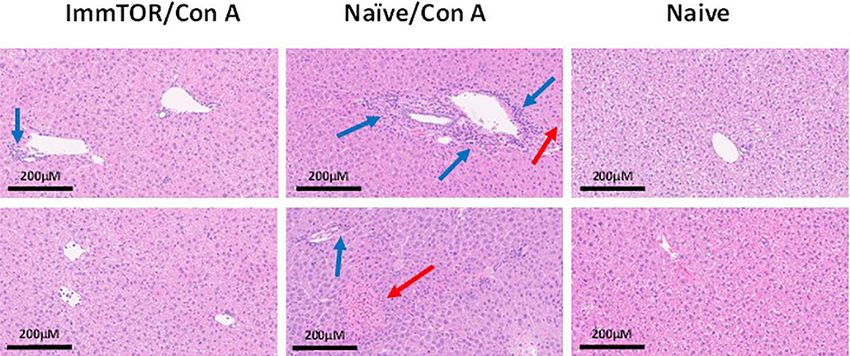
Ilyinskii et al.                                                                                    ImmTOR Enhances Hepatic Tolerogenic Phenotype

INTRODUCTION                                                                phenotype (CD25 + , CD127 low , PD-1 + ). Additionally, the
                                                                            emergence of a large population of double-negative (CD4-, CD8-)
ImmTOR nanoparticles (formerly called SVP-Rapamycin) are                    T cells was observed in the liver, but not the spleen. The
comprised of rapamycin, an inhibitor of the mTOR pathway,                   upregulation of PD-1, but not the increase in double negative T
embedded in a matrix of biodegradable poly(lactic acid) (PLA)               cells, was partially dependent on the PD-L1/PD-1 axis and on
polymer (reviewed in 1). ImmTOR has been shown to induce                    CTLA-4. Collectively, upon the exposure to ImmTOR, most of
durable and antigen-specific tolerance in a variety of applications          hepatic T cells acquired an immunosuppressive or anergic
including mitigating immune responses against biological                    phenotype, which was maintained for at least 2 weeks after a single
therapeutics (2–5), hepatotropic AAV gene therapy vectors (6),              treatment. ImmTOR treatment also protected mice in a concanavalin
and autoantigens (7, 8). The principal target organs of                     A-induced model of acute hepatitis.
biodistribution for intravenously delivered ImmTOR are spleen
and liver (7). This is consistent with another published report that
shows nanoparticle accumulation and capture by hepatic and                  MATERIALS AND METHODS
splenic sinusoids (9). The liver is known to behave as a
tolerogenic organ (10). Under normal conditions, there is an                ImmTOR and Other Nanoparticles
active suppression of immunity to a continuous flow of gut flora              Rapamycin containing nanoparticles (ImmTOR) were
and food-borne antigens, which enter the liver via portal vessels to        manufactured as described earlier (2, 7). Briefly, PLA, pegylated
liver sinusoids (11). This process is essential to prevent unwanted         polylactic acid (PLA-PEG), and rapamycin were dissolved in
immune stimulation to otherwise harmless digestive antigens and             dichloromethane to form the oil phase. An aqueous solution was
commensal bacterial antigens. The tolerogenic potential of the liver        then added to the oil phase and emulsified by sonication (Branson
was first shown over 50 years ago, with an observation that MHC              Digital Sonifier 250A). Following emulsification, a double emulsion
mismatched pigs could tolerate allogeneic liver transplants without         was created by adding an aqueous solution of polyvinylalcohol and
immunosuppressive drugs. Moreover, porcine recipients of liver              sonicating a second time. The double emulsion was added to a beaker
allografts were also capable of accepting other organ grafts, which         containing phosphate buffer solution and stirred at room
normally would have been rejected in the absence of the liver               temperature for 2 h to allow the dichloromethane to evaporate.
allograft (12). Similarly, immune responses against the transgene           The resulting NPs were washed twice by centrifuging at 75,600 × g
product of AAV gene therapy expressed in the muscle can be                  and 4°C followed by resuspension of the pellet in PBS. Fluorescent
mitigated by co-expression of the transgene in the liver (13).              Cy5-containing NPs were manufactured as described above using
    Despite the propensity towards tolerogenic immune responses             PLA-Cy5 conjugate. PLA with a butyl amine end group was prepared
in the liver, robust effector immune responses can be mounted in the        from PLA-acid, which was then treated with Cy5-acid in the presence
liver in the case of liver-tropic viral infections and liver-targeted       of a coupling agent (O-(Benzotriazol-1-yl)-N,N,N′,N
autoimmune diseases. In humans, immunosuppressive drugs must                ′-tetramethyluronium tetrafluoroborate) to afford the conjugates.
be used in liver transplantation, although up to 20% of patients can        ImmTOR doses were based on rapamycin content ranging from 200
be gradually weaned from these drugs over time while maintaining            to 400 µg. Empty nanoparticles were manufactured in an identical
graft function (14). The liver contains several unique cell                 manner, but without rapamycin. Rapamycin (sirolimus) was
populations capable of presenting antigens, such as Kupffer cells           manufactured by Concord Biotech (Ahmedabad, India).
(KC), the most abundant liver resident macrophage population
possessing scavenger/phagocytic function (15), and liver sinusoidal         Mice
endothelial cells (LSECs), the most abundant non-parenchymal                Immunologically naïve, female C57BL/6 mice aged 36-52 days
hepatic cell population which line the sinusoidal capillary channels        (or 17-18g) were purchased from Charles River Laboratories
and are involved in filtering blood passing through the liver. LSECs         (Wilmington, MA). Similarly aged B6.Cg-Tg(TcraTcrb)425Cbn/
have high endocytic capacity and are capable of presenting antigen          J mice (also known as OT-II mice), expressing the T cell receptor
to T cells (16). The balance between tolerogenic immune responses           (TCR), which is specific for chicken ovalbumin 323-339 peptide
and effector immune responses is likely influenced by the phenotype          (OVA323-339 or OP-II) in the context of I-Ab resulting in CD4+ T
of antigen-presenting cells in the liver, such as expression of co-         cells that primarily recognize OP-II when presented by the
stimulatory molecules, CD80 and CD86, which promote effector                MHC-II molecule were purchased from Jackson Laboratories
immune responses, and checkpoint molecules, such as PD-L1,                  (Bar Harbor, ME). To minimize the potential effects of stress,
which promote tolerogenic immune responses.                                 mice were acclimated to the Animal Care Facility at Selecta for at
    In this study we followed trafficking of fluorescent-labeled              least three days prior to injection. All the experiments were
ImmTOR particles to the liver, showing its simultaneous uptake              conducted in strict compliance with NIH Guide for the Care and
by all major liver cell populations. ImmTOR induced a prolonged             Use of Laboratory Animals and other federal, state and local
tolerogenic phenotype in KCs and LSECs, characterized by down-              regulations and were approved by Selecta’s IACUC.
regulation of MHC class II and co-stimulatory molecule expression
and profound upregulation of PD-L1. This, in turn, led to induction         Animal Injections
of major and persistent changes in hepatic T cell populations, with         Mice were injected (i.v., tail vein or retro-orbital plexus) with
an overall decrease in CD4 and CD8 T cells, a marked increase in            ImmTOR or empty nanoparticles in the effective range of 200-
PD-1 expression, and induction of T cells with a regulatory                 400 µg. Molar equivalent of soluble rapamycin was administered i.p.

Frontiers in Immunology | www.frontiersin.org                           2                                    May 2021 | Volume 12 | Article 637469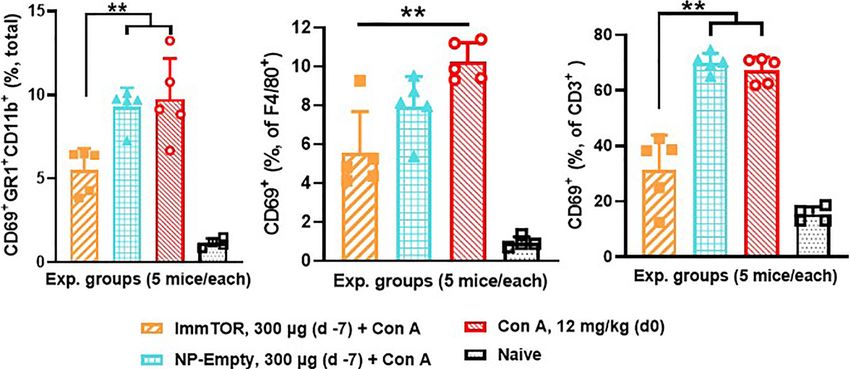
Ilyinskii et al.                                                                                     ImmTOR Enhances Hepatic Tolerogenic Phenotype

Sample Collection and Flow Cytometry                                        cytometer (BD Biosciences) with data analysis using FlowJo
For given timepoints (most of the time, several overlapping time-           software (TreeStar, Ashland, OR).
points were tested using the same set of treatments, always including
naïve and/or placebo or free rapamycin controls), mice were                 Cell Proliferation and Cytokine
euthanized, livers and/or spleens harvested and rendered into               Secretion In Vitro
single cell suspensions via collagenase 4 (Worthington                      LSEC were purified as described above and KC were purified using
Biochemical, Lakewood, NJ) enzymatic digest according to                    positive selection F4/80 microbeads (Miltenyi Biotec) with >80%
manufacturer’s recommended protocol. Next, a red blood cell                 purity of either population confirmed by flow cytometry. For cell
lysis step was performed for 5 min at room temperature in 150               proliferation studies LSEC isolated from ImmTOR-treated or
mM NH4Cl, 10 mM KHCO3, 10 mM Na2-EDTA; washed in PBS,                       naïve mice were cultured in limiting dilutions (starting at 1.25 x
2% bovine serum; then filtered on a 70 µm nylon mesh. LSECs were             105 cells/well) with a fixed number of OT-II splenocytes (2.5 x 10⁴
isolated via CD146 positive selection with immunomagnetic beads             cells/well) stimulated with OVA323-339 peptide (Anaspec, Fremont,
according to manufacturer’s instructions (Miltenyi Biotec, San              CA) at 1 µg/ml. Cultures were carried out in triplicates in 96-well
Diego, CA). To prevent non-specific antibody binding, cells were             round-bottomed plates and cell proliferation was evaluated 72
incubated 20 min. on ice with anti-CD16/32 then stained with                hours after initiating the cultures using two separate methods,
antibodies (all from BioLegend, San Diego, CA) for given cell               namely resazurin-based fluorescence (17) with PrestoBlue™ HS
surface phenotype. Analysis was performed via FACSCanto flow                 cell viability reagent (Thermo Fisher, Waltham, MA) according to
cytometer (BD Biosciences) with subsequent data analysis using              manufacturer’s instructions and via intracellular flow cytometry
FlowJo software (TreeStar, Ashland, OR).                                    using labeling with anti-Ki-67 (Alexa Fluor® 647, BioLegend), a
                                                                            protein known to be absent in non-dividing cells (18) and to
Characterization of Liver                                                   positively correlate with mouse T cell proliferation (19).
Cell Subpopulations                                                             Serum cytokine levels were analyzed with Meso Scale
Flow cytometry was used for the phenotyping of hepatocytes,                 Discovery (MSD) 96-Well MULTI-SPOT® Ultra-Sensitive
LSEC, KC, hepatic stellate cells (HSC) and liver T cells from liver         Human Immunoassay Kits, using electrochemiluminescence
cell suspension and of LSEC post CD146 positive selection. Dead             detection on an MESO® QuickPlex SQ 120 with Discovery
cells were always excluded from analysis. Phenotypic changes were           Workbench software (version 3.0.18) (MSD®, Gaitherburg,
assessed as percentage of parent population as shown; measuring             MD). Cytokines were measured using the U-PLEX TH1/TH2
of absolute mean fluorescent intensity (MFI) gave essentially the            combo (ms) 10-plex kit and the U-PLEX TGF-b Combo (ms) 3-
same results. Gating strategies for all the major hepatic cell              plex kit. Assays were performed according to manufacturer’s
populations assessed in the study are shown in Supplementary                instructions, and without alterations to the recommended
Figure S1. All antibodies to cell surface markers were from                 standard curve dilutions. OR).
BioLegend (San Diego, CA), with the exception of that against
LRP-1 (A2MR-a2) being from Thermo Fischer (Waltham, MA).                    Concanavalin A Challenge Model
The following primary antibodies were used to identify liver                Concanavalin A (Con A) induced liver toxicity model was
parenchyma cells: anti-LRP-1 (conjugated with R-PE using                    employed essentially as earlier described (20, 21). Briefly, mice
SiteClick R-PE labeling kit (Thermo Fischer) according to                   were injected (i.v., r.o.) Con A at 12 mg/kg and then terminally
manufacturer’s instructions), F4/80 (BV510), anti-CD68 (APC/                bled at 6, 8, 12 or 24 hours post-challenge with cytokine levels in
Cy™7), anti-CD11b (PE/Cy7), anti-mannose receptor (MR) (BV-                 serum determined by MSD as described above and liver tissues
eFlour450), anti-CD146-FITC, anti-CD38 (APC/Cy7) and anti-                  collected simultaneously for single-cell suspension analysis by
GFAP (BV421). To confirm the purity of the LSEC population                   flow cytometry as described above or for hematoxylin-eosin
after CD146 positive selection anti-MR (BV eFlour450), anti-F4/             staining followed by microscopic evaluation.
80 (BV 510) and anti-CD68 (APC/Cy7) were used. For LSEC and
KC phenotyping, the following antibodies were utilized: anti-               Statistical Analysis
MHCII (Alexa Flour® 488), anti-CD80 (PE), anti-CD86 (PE/                    Statistical analyses were performed using GraphPad Prism 8.0.2. To
Cy7) and anti-PD-L1 (PerCP-Cy5.5), all from BioLegend. The                  compare the mouse experimental groups pairwise either multiple t
following antibodies were used for T cell differentiation and               test (for several time-points) or Mann-Whitney two-tailed test (for a
characterization; anti-CD127 (PE), anti-PD-1 (PerCP-Cy5.5),                 single time-point; individual comparison of two groups presented
anti-CD4 (PE/Cy7), anti-CD25 (APC/Cy7), anti-CD3 (BV421),                   within the same graph) were used. Significance is shown for each
anti-CD8a (BV510), anti-CD62L (Alexa Flour® 488), anti-CD44                 figure legend (* – p < 0.05, ** – p < 0.01; *** – p < 0.001; **** – p <
(PE) and anti-NK1.1 (APC-Fire). Annexin B was used to evaluate              0.0001; not significant – p > 0.05). All data for individual
cell apoptosis. Additionally, anti-CD11c (BV510), anti-PDCA1                experimental groups is presented as mean ± SD (error bars).
(Alexa Flour® 488), anti-CD45 (APC/Cy7), anti-CD152(PE/Cy5)
and anti-MHCI (PerCP-Cy5.5) were used to analyze dendritic                  RESULTS
cells (DC) and their activation status. Cells were incubated with
anti-CD16/32 antibodies to prevent non-specific binding, then                ImmTOR Trafficking to Liver Cell Populations
incubated with primary antibodies for 30 min at 4°C and washed.             ImmTOR has been previously shown to preferentially
Analysis of cells were carried out on BD FACSCanto™ II flow                  accumulate in the liver and spleen after intravenous delivery

Frontiers in Immunology | www.frontiersin.org                           3                                     May 2021 | Volume 12 | Article 637469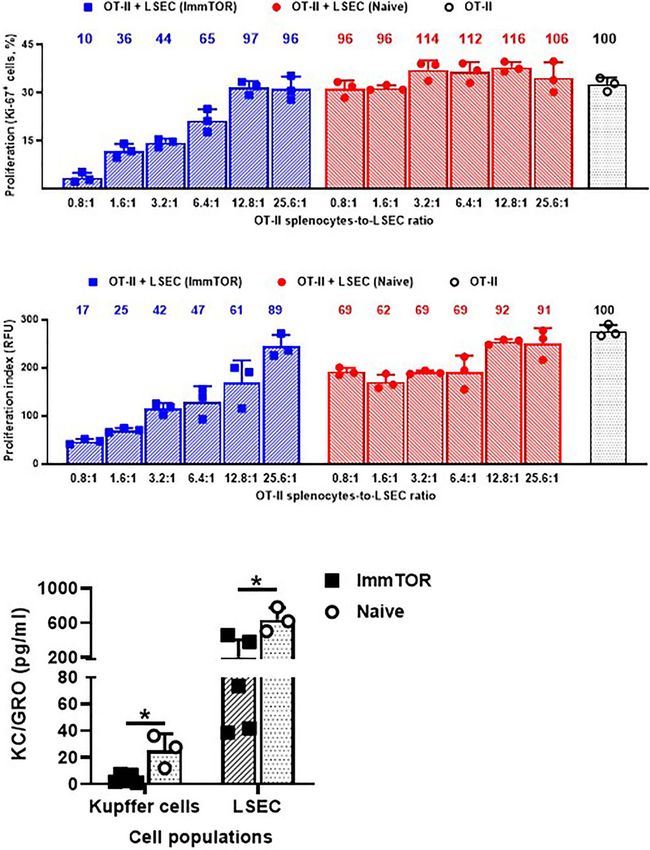
Ilyinskii et al. ImmTOR Enhances Hepatic Tolerogenic Phenotype
(7). In order to discern its hepatic trafficking in more detail, we II, CD80 and especially, CD86 was detected as early as one day
analyzed individual liver cell populations by flow cytometry after after ImmTOR treatment and then maintained throughout the
injection of fluorescent-labeled ImmTOR (Figure 1). Not first week after ImmTOR administration (Figures 3A–C). Of
surprisingly, there was a massive uptake of ImmTOR by these, CD80 was downregulated early, but then gradually
Kupffer cells, especially those with a phagocytic phenotype increased over the first week (Figure 3B), while MHC-II was
(Figures 1A, B). Moreover, there was significant ImmTOR modestly downregulated over days 1-10 post injection
uptake by hepatocytes (Figure 1C) and LSECs (Figure 1D). (Figure 3A). CD86 expression was profoundly suppressed for
Similar results were seen at earlier and later time-points, at least two weeks after ImmTOR treatment (Figure 3C). None
spanning from one day to two weeks post injection (not of these effects were observed if placebo nanoparticles (NP-
shown). Collectively, intravenous injection of ImmTOR led to Empty) were used (not shown).
its simultaneous uptake by all major resident liver cell In contrast, expression of PD-L1 was markedly elevated on
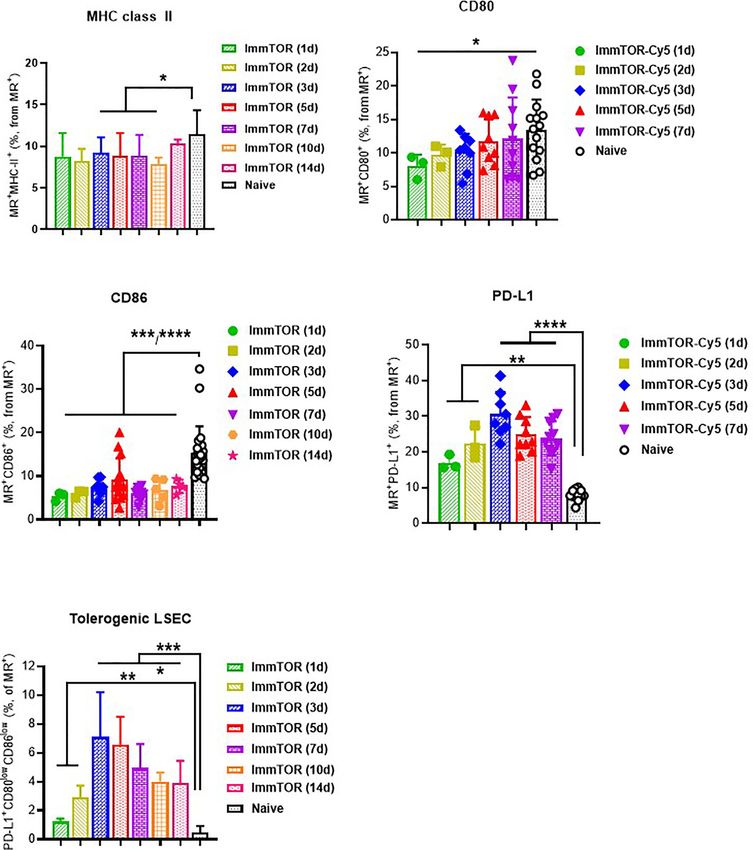
populations tested. LSECs at 1 day after ImmTOR administration and peaking around
days 3-5 post-treatment (Figure 3D). When combined with analysis
Induction of a Tolerogenic Profile in of CD80/86 expression, a profound increase in LSEC with a
Professional and Non-Professional tolerogenic phenotype (PD-L1+CD80lowCD86low) was apparent
Liver APC during the first week after ImmTOR administration, which was
Expression of cell surface molecules on phagocytic KCs that play maintained through at least day 14 (Figure 3E). By this time CD80
key roles in antigen presentation and immune co-stimulation and MHC class II (Figures 3A, B) expression was gradually restored
were affected as early as 1-3 days after ImmTOR treatment to baseline levels, while CD86 expression remained suppressed
(Figure 2). Specifically, expression of the immune checkpoint (Figure 3C). A similar phenotype of LSEC was observed if a
ligand, PD-L1, was already elevated at day 1 (Figure 2A), while purified LSEC population selected for CD146 expression was used
expression of MHC class II and the co-stimulatory CD80 (not shown) and this tolerogenic LSEC surface phenotype was the
molecule were decreased by day 3 (Figures 2B, C). All of these same irrespective of whether MR or CD146 was used for LSEC
effects peaked around days 5-7 post-ImmTOR administration identification (Supplementary Figure S3). As with professional
and returned to baseline levels by day 10. Other populations of hepatic APC, no effect on LSEC surface expression of CD80, CD86
professional APC, such as myeloid DC, showed similar increases and MHC class II molecules was seen when NP-Empty was used
in PD-L1 and decreases in CD80 expression, while plasmacytoid (see Supplementary Figure S3 for representative images).
DC and cytokine-producing KC showed modest but significant There was little or no difference in expression of PD-L1 or
decreases in CD80 and CD86 expression (Supplementary MHC class II when comparing total hepatocytes from mice
Figure S2). treated with ImmTOR vs naïve controls (Supplementary
A broad effect of ImmTOR was detected when analyzing the Figure S4). However, those hepatocytes that took up
surface molecule expression profile of LSECs, which have been ImmTOR, as evidenced by use of fluorescent-labeled
shown to play a major role in tolerogenic immune responses in ImmTOR, showed a profound upregulation of PD-L1 and
the liver (16). Specifically, a consistent suppression of MHC class down-regulation of MHC class II expression. Specifically, such
A B C D
FIGURE 1 | ImmTOR traffics to major liver cell populations after intravenous inoculation. Cy5-labeled ImmTOR particles (200 µg) were administered into the venous
circulation via the retro-orbital venous sinus. Livers were harvested at day 7 and processed to single-cell suspensions, which were stained with antibodies to markers
indicated and analyzed by flow cytometry. Fractions of Cy5-positive cytokine-producing (A) and phagocytic (B) Kupffer cells (F4/80+CD11b+ and F4/80+CD68+,
respectively) as well as of hepatocytes (C) (LRP-1+F4/80–CD11b–) and LSEC (D) (MR+F4/80–CD68–) are shown (% of total). Summaries of three independent
experiments in which identical time-points were assessed are shown (n = 9-13 mice/group). Background fluorescence in naïve mice is also shown. Statistical
difference in the size Cy5-positive fractions vs. that in naïve mice is shown (**** – p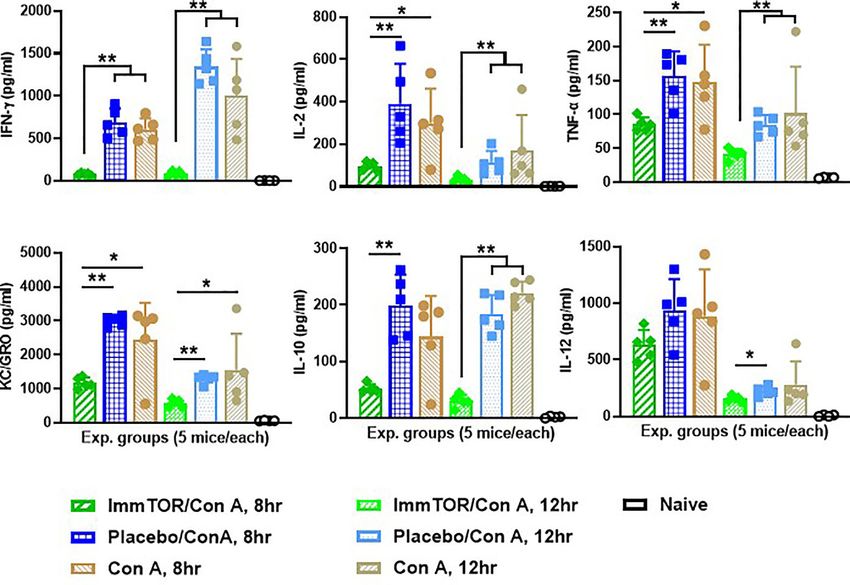
Ilyinskii et al.                                                                                                   ImmTOR Enhances Hepatic Tolerogenic Phenotype

                     A                                   B                                  C

  FIGURE 2 | Induction of a tolerogenic phenotype in Kupffer Cells (KC) by ImmTOR. KC were stained in liver cell suspensions following treatment of mice with 200
  µg ImmTOR (i. v.) Fractions of PD-L1+ (A), CD80+ (B) and MHC-II+ (C) phagocytic Kupffer cells (KC, identified as F4/80+CD68+) are shown. Summaries of four
  independent experiments in which different and overlapping time-points were assessed are shown (n = 3-12 mice/group). Statistical difference in the size of
  respective fractions at different time-points vs. that in naïve mice is shown (* – p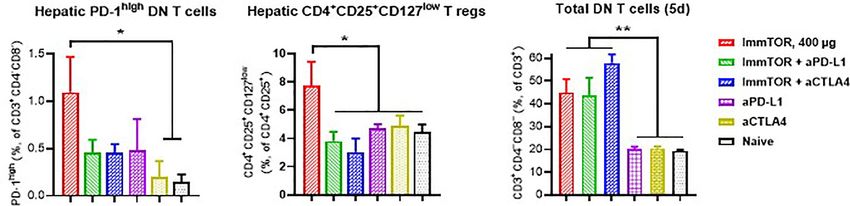
Ilyinskii et al.                                                                                                        ImmTOR Enhances Hepatic Tolerogenic Phenotype

                   A                                                              B

                   C                                                              D

                   E

  FIGURE 3 | ImmTOR induces a tolerogenic phenotype in LSECs. LSEC were isolated from liver at different time-points after i.v. injection of ImmTOR at 200 µg and
  analyzed by flow cytometry. Fractions of MHC-II+ (A), CD80+ (B), CD86+ (C), and PD-L1+ (D) liver sinusoid endothelial cells (LSEC, identified as MR+F4/80–CD68–)
  are shown. The fraction of tolerogenic LSEC (identified as PD-L1+CD80lowCD86low) is also shown (E). Summaries of five independent experiments are shown in
  which different and overlapping time-points were assessed (n=3-20 mice per group). Statistical difference in the size of respective fractions at different time-points vs.
  that in naïve mice is shown (* – p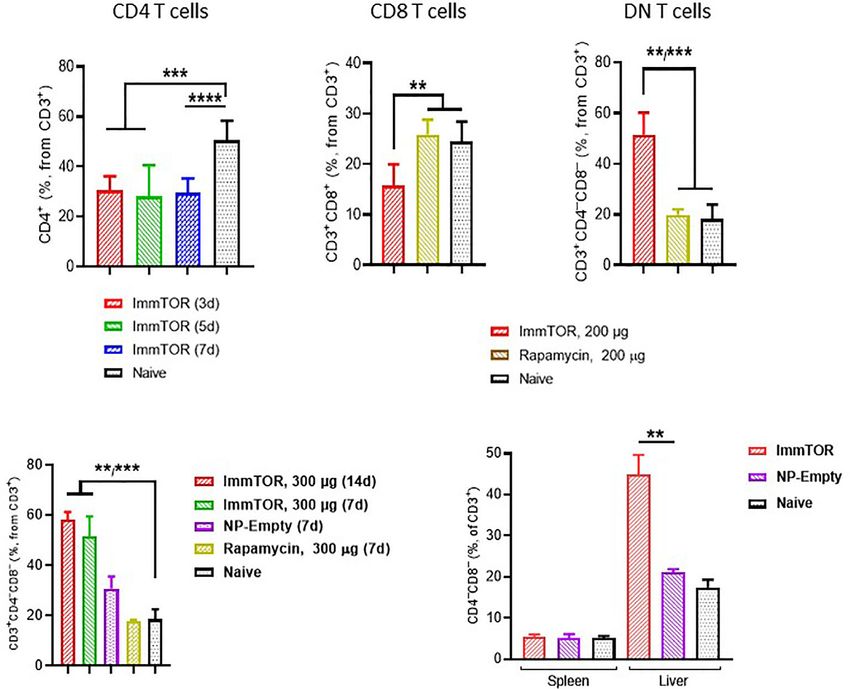
Ilyinskii et al.                                                                                                           ImmTOR Enhances Hepatic Tolerogenic Phenotype

                         A                                         B                                      C

                         D                                                                  E

  FIGURE 4 | ImmTOR treatment leads to the emergence of double-negative T cells in the liver but not spleen. Livers and/or spleen were processed and analyzed
  after i.v. injection of ImmTOR at 200 (A–C) or 300 µg (D, E) or the same dose of free rapamycin or empty nanoparticles (NP-Empty). Fractions of CD4+ (A), CD8+
  (B) and double-negative or CD4–CD8– (C, D) hepatic or hepatic and splenic (E) T cells (identified as CD3+ cells within lymphocyte gate) are shown. Timing of cell
  analysis is indicated in (A, D) analysis shown in other panels was done at either five (E) or seven (B, C) days post injection. Summaries of three (A) or two (B, C)
  independent experiments are shown (n=5-13 or 4-8 mice/group, respectively), or representative results of individual studies (n=3-6 mice/group) repeated at least
  twice (D, E). Data shown in A result from analysis of different and overlapping time-points. Statistical difference in the size of respective fractions at different time-
  points vs. that in naïve mice or mice injected with free rapamycin or NP-Empty is shown (** – p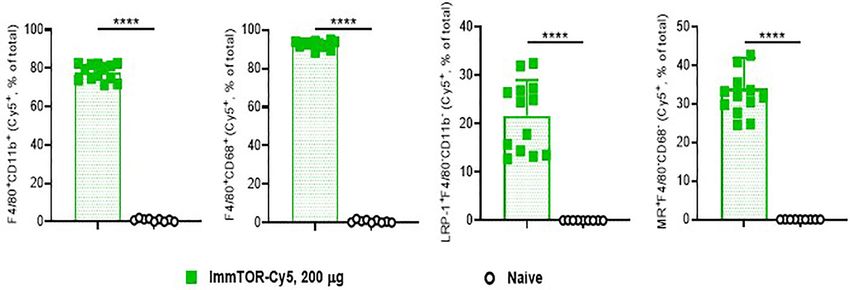
Ilyinskii et al.                                                                                                        ImmTOR Enhances Hepatic Tolerogenic Phenotype

                       A                                                         B                                C

                           D                                      E                                        F

  FIGURE 5 | ImmTOR treatment leads to upregulation of PD-1 expression on hepatic T cells and regulatory T cells. T cells were directly stained in liver cell
  suspensions and analyzed after i.v. injection of ImmTOR at 200-400 µg or the same dose of free rapamycin or NP-Empty. Fractions of PD-1+ hepatic T helpers or
  CTL (identified as CD3+CD4+ or CD3+CD8+, correspondingly) is shown (A–C) as well as fractions of PD-1+ T effectors (D, E), identified as CD3+CD4+CD25+) and
  ‘classic’ Tregs (F), CD3+CD4+CD25+CD127–). Summaries of three (A) or two (D) independent experiments are shown (n=4-13 or 4-9 mice/group, respectively), or
  representative results of individual studies (n=3-5 mice/group) repeated at least twice (B, C, E, F). Data shown in (A) result from analysis of different and overlapping
  time-points. Statistical difference in the size of respective fractions from ImmTOR-treated animals vs. that in naïve mice or those treated with NP-Empty or free
  rapamycin is shown (* – p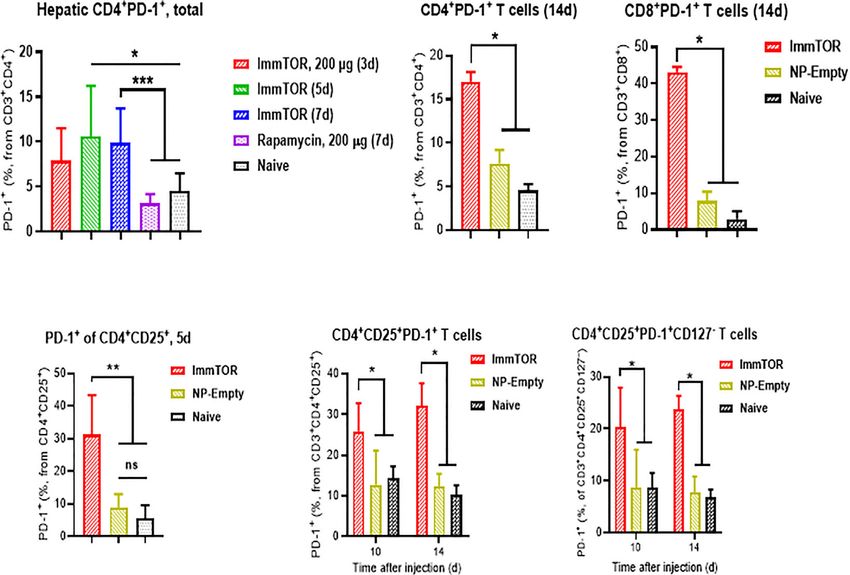
Ilyinskii et al.                                                                                                       ImmTOR Enhances Hepatic Tolerogenic Phenotype

                                    A

                                    B

                                    C

  FIGURE 7 | LSEC from ImmTOR-treated mice inhibit T cell proliferation in vitro and together with Kupffer cells, exhibit diminished KC/GRO secretion. LSEC were
  isolated from ImmTOR-treated (300 µg, 7 days) and intact animals and co-incubated at limiting dilutions with splenic derived OT-II cells and OVA323-339 (1 µg/ml).
  Cell proliferation index was measured by the percentage of Ki-67-positive cells (A) or by intensity of PrestoBlue fluorescent staining (B) as described in Materials and
  Methods with relative proliferation at each LSEC-to-splenocyte ratio also shown vs. positive (no LSEC) OT-II control as 100%. Experiment was performed twice with
  the same outcome and representative results are shown. (C) – LSEC and KC were purified from ImmTOR-treated (7 days) and intact animals, their purity confirmed
  by FACS and then were plated at 200,000 cells/well with cytokine concentration in supernatants assayed at 7 days. Levels of KC/GRO secretion are shown with
  statistical significance indicated (* – p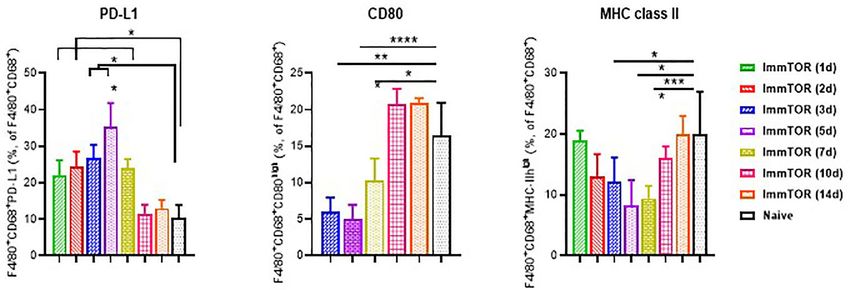
Ilyinskii et al.                                                                                                    ImmTOR Enhances Hepatic Tolerogenic Phenotype

                       A                                        B                                       C

                       D                                        E                                       F

  FIGURE 8 | ImmTOR pretreatment diminishes systemic inflammatory cytokines after Con A challenge. Six groups of nice (5 each) which were either untreated or
  injected with ImmTOR or NP-Empty particles (300 µg) were challenged with concanavalin A (12 mg/kg, i.v.) 7 days after the treatment, sacrificed 8 or 12 hours later
  and levels of serum cytokines determined. (A–F) – serum levels of IFNg, IL-2, TNFa, KC/GRO, IL-10, and IL-12 correspondingly, are shown for both post-challenge
  time-points for all experimental groups vs. that of naïve (no ImmTOR, no Con A) mice with statistical significance indicated (* – p
Ilyinskii et al. ImmTOR Enhances Hepatic Tolerogenic Phenotype
FIGURE 10 | ImmTOR pretreatment diminishes hepatic cytotoxicity after Con A challenge. Mice which were either untreated or pre-injected with ImmTOR particles
(300 µg) were challenged with concanavalin A (12 mg/kg, i.v.), sacrificed 24 hours later, livers fixed and processed to tissue slides, stained by hematoxylin-eosin, and
analyzed microscopically. The areas of leukocyte infiltration adjacent to vessels (blue arrows) and necrotic areas (red arrows) are indicated. Samples from two
representative animals are shown for both groups vs. naïve controls (no treatment, no Con A) as indicated.
been shown to exhibit tolerogenic properties and have the ability to features of this model of immune-mediated liver toxicity (20,
strongly suppress activated CD8+ and CD4+ T cells and impair their 21, 26), were diminished by ImmTOR pretreatment (Figure 9).
metabolism (44–48). Consistent with these observations, DN T cells This was also true for other hallmarks of Con A-induced liver
are known to play a role in suppressing the immune response in pathology such as leukocyte-induced cell death and systemic
transplantation (49) and graft versus host (GvHD) disease, with cytokine induction (Figures 8 and 10). Some of these effects have
severity of GVHD in recipients of allogeneic hematopoietic stem been observed earlier in a small study using free rapamycin
cells being in inversely correlated with the number of circulating DN which was systemically administered shortly before Con A
T cells (50). Interestingly, the effect of ImmTOR on the emergence challenge (54). However, the action of ImmTOR has a much
of DN T cells was not dependent on the PD-L1/PD-1 axis or CTLA- broader window of efficacy and seems to affect many other
4, in contrast to the effect of ImmTOR on PD-1 expression cytokines in addition to those earlier reported (54), especially
(Figure 5) and CD25 + , CD127 low , CD4 + , CD3 + T cells. interesting being those, which were not seen previously as
Conversely, there have been reports of DN T cells exhibiting significant actors in this system, specifically KC/GRO.
inflammatory functions in a number of autoimmune diseases Previous studies have demonstrated that ImmTOR is capable
(reviewed in 51), but these seem to be associated with of inducing durable immune tolerance in vivo to model antigens,
systemically active DN T cells as opposed to those induced locally such as ovalbumin and KLH, against a broad range of biologic
with no similar data with respect to liver-specific DN T cells. therapies, and to autoantigens (2–8, 55). As reported earlier,
We sought to overcome an initial limitation of this research, ImmTOR particles are 150 nm in diameter and have a surface
which confined it to studying phenotypic changes in liver cell charge of 8.9 ± 0.1 mV (55) with rapamycin load within 8-25%
populations by conducting functional studies ex vivo. Indeed, LSEC weight and release rate up to 60% at 1 hour or 25-80% at 24 hours.
from ImmTOR-treated animals were capable of suppressing A role for the spleen in the mechanism of action of ImmTOR was
proliferation of stimulated T cells and they (as well as KC) also inferred by the appearance of splenic antigen-specific regulatory T
expressed much lower amounts of neutrophil chemokine KC/GRO cells; however, whether those Tregs arose in the spleen or migrated
(Figure 7), which is known to play a key role in several models of there was not addressed (2, 6, 7). Splenectomy substantially, but
inflammatory response (24, 25, 52) and hepatic production of incompletely, negated the tolerogenic effects of ImmTOR (2).
which has been shown to correlate with hepatic infiltration by However, there was no major effect of ImmTOR on dendritic
neutrophils in a model of experimental sepsis (53). There is also cell phenotype, including MHC class II and co-stimulatory
some evidence of KC/GRO directly affecting T cells leading to molecule expression, or total T cell sub-populations in the
preferential naïve CD4 T-cell differentiation to Th17 (52). spleen (2). Indeed, the phenotypic changes induced by
Therefore, it was not surprising that hepatic infiltration by ImmTOR are considerably more pronounced in the liver than
activated neutrophils as well as activation of liver-resident the spleen. In particular, the emergence of a large population of
macrophages and T cells after Con A challenge, typical DN T cells was observed in the liver but not the spleen
Frontiers in Immunology | www.frontiersin.org 11 May 2021 | Volume 12 | Article 637469Ilyinskii et al. ImmTOR Enhances Hepatic Tolerogenic Phenotype
(Figure 4E). Future research will focus on developing genetically AUTHOR CONTRIBUTIONS
modified mouse models to further dissect the role of the liver in
immune tolerance induction induced by ImmTOR. PI, CR and GR designed the experiments, CR, JL and GR
While the liver environment favors the induction and executed the studies, PI, CR, JL, GR and TK analyzed the data,
maintenance of immune tolerance, tolerance can be broken leading PI and TK wrote the manuscript. All authors contributed to the
to liver specific autoimmune diseases, such as autoimmune hepatitis, article and approved the submitted version.
primary biliary cholangitis, and primary sclerosing cholangitis. The
biodistribution of ImmTOR nanoparticles to the liver and its
multipronged effects on promoting a tolerogenic phenotype in FUNDING
antigen-presenting cells and T cells suggest that ImmTOR may be
This work was funded by Selecta Biosciences. The funder was not
beneficial in the treatment of liver autoimmune diseases, either alone
involved in the study design, collection, analysis, interpretation
or combined with autoantigens, such as PDC-E2, to restore immune
of data, the writing of this article or the decision to submit it
tolerance to autoantigens.
for publication.
DATA AVAILABILITY STATEMENT ACKNOWLEDGMENTS
The original contributions presented in the study are included in The authors thank Drs. Arlene Sharpe and Uli von Andrian for
the article/Supplementary Material. Further inquiries can be helpful discussions.
directed to the corresponding author.
SUPPLEMENTARY MATERIAL
ETHICS STATEMENT
The Supplementary Material for this article can be found online at:
The animal study was reviewed and approved by Institutional https://www.frontiersin.org/articles/10.3389/fimmu.2021.637469/
Animal Care and Use Committee (IACUC) of Selecta Biosciences. full#supplementary-material
REFERENCES Endothelial Cells Enables Control of Autoimmunity in Mice. J Hepatol (2015)
62(6):1349–56. doi: 10.1016/j.jhep.2015.01.006
1. Kishimoto TK. Development of ImmTOR Tolerogenic Nanoparticles for the 10. Zheng M, Tian Z. Liver-Mediated Adaptive Immune Tolerance. Front
Mitigation of Anti-Drug Antibodies. Front Immunol (2020) 11:969. Immunol (2019) 10:2525. doi: 10.3389/fimmu.2019.02525
doi: 10.3389/fimmu.2020.00969 11. Racanelli V, Rehermann B. The Liver as an Immunological Organ. Hepatology
2. Kishimoto TK, Ferrari JD, LaMothe RA, Kolte PN, Griset AP, O’Neil C, et al. (2006) 43(2 Suppl 1):S54–62. doi: 10.1002/hep.21060
Improving the Efficacy and Safety of Biologic Drugs With Tolerogenic 12. Calne RY, Sells RA, Pena JB, Davis DR, Millard PR, Herbertson BM, et al.
Nanoparticles. Nat Nanotechnol (2016) 11(10):890–9. doi: 10.1038/nnano. Induction of Immunological Tolerance by Porcine Liver Allografts. Nature
2016.135 (1969) 223:472–6. doi: 10.1038/223472a0
3. Lim HH, Yi H, Kishimoto TK, Gao F, Sun B, Kishnani PS. A Pilot Study on Using 13. Bartolo L, Li Chung Tong S, Chappert P, Urbain D, Collaud F, Colella P, et al.
Rapamycin-Carrying Synthetic Vaccine Particles (SVP) in Conjunction With Dual Muscle-Liver Transduction Imposes Immune Tolerance for Muscle
Enzyme Replacement Therapy to Induce Immune Tolerance in Pompe Disease. Transgene Engraftment Despite Preexisting Immunity. JCI Insight (2019) 4
Mol Genet Metab Rep (2017) 13:18–22. doi: 10.1016/j.ymgmr.2017.03.005 (11):e127008. doi: 10.1172/jci.insight.127008
4. Mazor R, King EM, Onda M, Cuburu N, Addissie S, Crown D, et al. 14. Londoño MC, Rimola A, O’Grady J, Sanchez-Fueyo A. Immunosuppression
Tolerogenic Nanoparticles Restore the Antitumor Activity of Recombinant Minimization vs. Complete Drug Withdrawal in Liver Transplantation.
Immunotoxins by Mitigating Immunogenicity. Proc Natl Acad Sci U S A J Hepatology (2013) 59(4):872–9. doi: 10.1016/j.jhep.2013.04.003
(2018) 115(4):E733–42. doi: 10.1073/pnas.1717063115 15. Karimi MH, Geramizadeh B, Malek-Hosseini SA. Tolerance Induction in
5. Zhang A-H, Rossi RJ, Yoon J, Wang H, Scott DW. Tolerogenic Nanoparticles to Liver. Int J Organ Transplant Med (2015) 6(2):45–54.
Induce Immunologic Tolerance: Prevention and Reversal of FVIII Inhibitor 16. Limmer A, Knolle PA. Liver Sinusoidal Endothelial Cells: A New Type of
Formation. Cell Immunol (2016) 301:74–81. doi: 10.1016/j.cellimm.2015.11.004 Organ-Resifent Antigen-Presenting Cell. Arch Immunol Ther Exp (Warsz)
6. Meliani A, Boisgerault F, Hardet R, Marmier S, Collaud F, Ronzitti G, et al. (2001) 49(Suppl 1):S7–11.
Antigen-Selective Modulation of AAV Immunogenicity With Tolerogenic 17. Präbst K, Engelhardt H, Ringgeler S, Hübner H. Basic Colorimetric
Rapamycin Nanoparticles Enables Successful Vector Re-Administration. Nat Proliferation Assays: Mtt, WST, and Resazurin. Methods Mol Biol (2017)
Commun (2018) 9(1):4098. doi: 10.1038/s41467-018-06621-3 1601:1–17. doi: 10.1007/978-1-4939-6960-9_1
7. Maldonado RA, LaMothe RA, Ferrari JD, Zhang A-H, Rossi RJ, Kolte PN, 18. Gerdes J, Lemke H, Baisch H, Wacker HH, Schwab U, Stein H. Cell Cycle
et al. Polymeric Synthetic Nanoparticles for the Induction of Antigen-Specific Analysis of a Cell Proliferation-Associated Human Nuclear Antigen Defined
Immunological Tolerance. Proc Natl Acad Sci U S A (2015) 112(2):E156–65. by the Monoclonal Antibody Ki-67. J Immunol (1984) 133(4):1710–5.
doi: 10.1073/pnas.1408686111 19. Motamedi M, Xu L, Elahi S. Correlation of Transferrin Receptor (Cd71) With
8. LaMothe RA, Kolte PN, Vo T, Ferrari JD, Gelsinger TC, Wong J, et al. Tolerogenic Ki67 Expression on Stimulated Human and Mouse T Cells: The Kinetics of
Nanoparticles Induce Antigen-Specific Regulatory T Cells and Provide Therapeutic Expression of T Cell Activation Markers. J Immunol Methods (2016) 437:43–
Efficacy and Transferrable Tolerance Against Experimental Autoimmune 52. doi: 10.1016/j.jim.2016.08.002
Encephalomyelitis. Front Immunol (2018) 9:281. doi: 10.3389/fimmu.2018.00281 20. Fullerton AM, Roth RA, Ganey PE. Pretreatment With Tcdd Exacerbates
9. Carambia A, Freund B, Schwinge D, Bruns OT, Salmen SC, Ittrich H, et al. Liver Injury From Concanavalin a: Critical Role for NK Cells. Toxicol Sci
Nanoparticle-Based Autoantigen Delivery to Treg-inducing Liver Sinusoidal (2013) 36(1):72–85. doi: 10.1093/toxsci/kft174
Frontiers in Immunology | www.frontiersin.org 12 May 2021 | Volume 12 | Article 637469Ilyinskii et al. ImmTOR Enhances Hepatic Tolerogenic Phenotype
21. Heymann F, Hamesch K, Weiskirchen R, Tacke F. The Concanavalin A Model Cells and Kupffer Cells. Gastroenterology (1996) 110(4):1175–81. doi: 10.1053/
of Acute Hepatitis in Mice. Lab Anim (2015) 49(1 Suppl):12–20. doi: 10.1177/ gast.1996.v110.pm8613007
0023677215572841 41. von Oppen N, Schurich A, Hegenbarth S, Stabenow D, Tolba R, Weiskirchen
22. Saison J, Demaret J, Venet F, Chidiac C, Malcus C, Poitevin-Later F, et al. Cd4 R, et al. Systemic Antigen Cross-Presented by Liver Sinusoidal Endothelial
+Cd25+Cd127- Assessment as a Surrogate Phenotype for FOXP3+ Regulatory Cells Induces Liver-Specific CD8 T-Cell Retention and Tolerization.
T Cells in HIV-1 Infected Viremic and Aviremic Subjects. Cytometry B Clin Hepatology (2009) 49(5):1664–72. doi: 10.1002/hep.22795
Cytom (2013) 84(1):50–4. doi: 10.1002/cyto.b.21047 42. Diehl L, Schurich A, Grochtmann R, Hegenbarth S, Chen L, Knolle PA.
23. Shen LS, Wang J, Shen DF, Yuan XL, Dong P, Li MX, et al. Cd4(+)Cd25(+) Tolerogenic Maturation of Liver Sinusoidal Endothelial Cells Promotes B7-
Cd127(Low/-) Regulatory T Cells Express Foxp3 and Suppress Effector T Cell Homolog 1-Dependent Cd8+ T Cell Tolerance. Hepatology (2008) 47(1):296–
Proliferation and Contribute to Gastric Cancers Progression. Clin Immunol 305. doi: 10.1002/hep.21965
(2009) 131(1):109–18. doi: 10.1016/j.clim.2008.11.010 43. Kruse N, Neumann K, Schrage A, Derkow K, Schott E, Erben U, et al. Priming
24. Shea-Donohue T, Thomas K, Cody MJ, Zhao A, Detolla LJ, Kopydlowski of CD4+ T Cells by Liver Sinusoidal Endothelial Cells Induces Cd25low
KM, et al. Mice Deficient in the CXCR2 Ligand, CXCL1 (Kc/Gro-Alpha), Forkhead Box Protein 3- Regulatory T Cells Suppressing Autoimmune
Exhibit Increased Susceptibility to Dextran Sodium Sulfate (Dss)-Induced Hepatitis. Hepatology (2009) 50(6):1904–13. doi: 10.1002/hep.23191
Colitis. Innate Immun (2008) 14(2):117–24. doi: 10.1177/17534259 44. Chen W, Ford MS, Young KJ, Zhang L. The Role and Mechanisms of Double
08088724 Negative Regulatory T Cells in the Suppression of Immune Responses. Cell
25. Paudel S, Baral P, Ghimire L, Bergeron S, Jin L, DeCorte JA, et al. Cxcl1 Mol Immunol (2004) 1(5):328–35.
Regulates Neutrophil Homeostasis in Pneumonia-Derived Sepsis Caused by 45. Zhang ZX, Young K, Zhang L. Cd3+Cd4-CD8- Alphabeta-Tcr+ T Cell as
Streptococcus Pneumoniae Serotype 3. Blood (2019) 133(12):1335–45. Immune Regulatory Cell. J Mol Med (Berl) (2001) 79(8):419–27. doi: 10.1007/
doi: 10.1182/blood-2018-10-878082 s001090100238
26. Hatada S, Ohta T, Shiratsuchi Y, Hatano M, Kobayashi Y. A Novel Accessory 46. Zhang D, Yang W, Degauque N, Tian Y, Mikita A, Zheng XX. New
Role of Neutrophils in Concanavalin a-Induced Hepatitis. Cell Immunol Differentiation Pathway for Double-Negative Regulatory T Cells That
(2005) 233(1):23–9. doi: 10.1016/j.cellimm.2005.03.003 Regulates the Magnitude of Immune Responses. Blood (2007) 109(9):4071–
27. Doherty DG. Immunity, Tolerance and Autoimmunity in the Liver: A 9. doi: 10.1182/blood-2006-10-050625
Comprehensive Review. J Autoimmun (2016) 66:60–75. doi: 10.1016/ 47. Kim EY, Juvet SC, Zhang L. Regulatory CD4(-)CD8(-) Double Negative T
j.jaut.2015.08.020 Cells. Methods Mol Biol (2011) 677:85–98. doi: 10.1007/978-1-60761-869-0_6
28. Jenne CN, Kubes P. Immune Surveillance by the Liver. Nat Immunol (2013) 48. Haug T, Aigner M, Peuser MM, Strobl CD, Hildner K, Mougiakakos D, et al.
14(10):996–1006. doi: 10.1038/ni.2691 Human Double-Negative Regulatory T-cells Induce a Metabolic and
29. Thomson AW, Knolle PA. Antigen-Presenting Cell Function in the Functional Switch in Effector T-Cells by Suppressing mTOR Activity. Front
Tolerogenic Liver Environment. Nat Rev Immunol (2010) 10(11):753–66. Immunol (2019) 10:883. doi: 10.3389/fimmu.2019.00883
doi: 10.1038/nri2858 49. Chen W, Zhou D, Torrealba JR, Waddell TK, Grant D, Zhang L. Donor
30. Crispe IN. Liver Antigen-Presenting Cells. J Hepatol (2011) 54(2):357–65. Lymphocyte Infusion Induces Long-Term Donor-Specific Cardiac Xenograft
doi: 10.1016/j.jhep.2010.10.005 Survival Through Activation of Recipient Double-Negative Regulatory T
31. Eckert C, Klein N, Kornek M, Lukacs-Kornek V. The Complex Myeloid Cells. J Immunol (2005) 175(5):3409–16. doi: 10.4049/jimmunol.175.5.3409
Network of the Liver With Diverse Functional Capacity at Steady State and 50. Ye H, Chang Y, Zhao X, Huang X. Characterization of CD3+CD4-CD8-
in Inflammation. Front Immunol (2015) 6:179. doi: 10.3389/fimmu. (Double Negative) T Cells Reconstitution in Patients Following
2015.00179 Hematopoietic Stem-Cell Transplantation. Transpl Immunol (2011) 25
32. Kinoshita M, Uchida T, Sato A, Nakashima M, Nakashima H, Shono S, et al. (4):180–6. doi: 10.1016/j.trim.2011.08.004
Characterization of Two F4/80-Positive Kupffer Cell Subsets by Their 51. Brandt D, Hedrich CM. Tcrab+Cd3+Cd4-CD8- (Double Negative) T Cells in
Function and Phenotype in Mice. J Hepatol (2010) 53(5):903–10. Autoimmunity. Autoimmun Rev (2018) 17):422–30. doi: 10.1016/
doi: 10.1016/j.jhep.2010.04.037 j.autrev.2018.02.001
33. Wiegard C, Frenzel C, Herkel J, Kallen KJ, Schmitt E, Lohse AW. Murine 52. Jin L, Batra S, Douda DN, Palaniyar N, Jeyaseelan S. Cxcl1 Contributes to Host
Liver Antigen Presenting Cells Control Suppressor Activity of CD4+CD25+ Defense in Polymicrobial Sepsis Via Modulating T Cell and Neutrophil Functions.
Regulatory T Cells. Hepatology (2005) 42(1):193–9. doi: 10.1002/hep.20756 J Immunol (2014) 193(7):3549–58. doi: 10.4049/jimmunol.1401138
34. Wu K, Kryczek I, Chen L, Zou W, Welling TH. Kupffer Cell Suppression of 53. Salkowski CA, Detore G, Franks A, Falk MC, Vogel SN. Pulmonary and
CD8+ T Cells in Human Hepatocellular Carcinoma is Mediated by B7-H1/ Hepatic Gene Expression Following Cecal Ligation and Puncture:
programmed Death-1 Interactions. Cancer Res (2009) 69(20):8067–75. Monophosphoryl Lipid A Prophylaxis Attenuates Sepsis-Induced Cytokine
doi: 10.1158/0008-5472.CAN-09-0901 and Chemokine Expression and Neutrophil Infiltration. Infect Immun (1998)
35. Whitehouse GP, Hope A, Sanchez-Fueyo A. Regulatory T-cell Therapy in 66(8):3569–78. doi: 10.1128/IAI.66.8.3569-3578.1998
Liver Transplantation. Transpl Int (2017) 30(8):776–84. doi: 10.1111/tri. 54. Zhang Y, Xiao X, Li X, Wei H. Rapamycin Prevents Concanavalin A-induced
12998 Liver Injury by Inhibiting Lymphocyte Activation. J Gastroenterol Hepatol
36. Breous E, Somanathan S, Vandenberghe LH, Wilson JM. Hepatic Regulatory (2009) 24(8):1457–62. doi: 10.1111/j.1440-1746.2009.05866.x
T Cells and Kupffer Cells are Crucial Mediators of Systemic T Cell Tolerance 55. Ilyinskii PO, Michaud AM, Roy CJ, Rizzo GL, Elkins SL, Capela T, et al.
to Antigens Targeting Murine Liver. Hepatology (2009) 50(2):612–21. Enhancement of Liver-Directed Transgene Expression at Initial and Repeat
doi: 10.1002/hep.23043 Doses of AAV Vectors Admixed With ImmTOR Nanoparticles. Sci Adv
37. Hsu SM, Mathew R, Taylor AW, Stein-Streilein J. Ex-Vivo Tolerogenic F4/80⁺ (2021) 7(9):eabd0321. doi: 10.1126/sciadv.abd0321
Antigen-Presenting Cells (Apc) Induce Efferent CD8⁺ Regulatory T Cell-
Dependent Suppression of Experimental Autoimmune Uveitis. Clin Exp Conflict of Interest: All authors are employees and shareholders in Selecta
Immunol (2014) 176(1):37–48. doi: 10.1111/cei.12243 Biosciences, Inc
38. Knolle PA, Wohlleber D. Immunological Functions of Liver Sinusoidal
Endothelial Cells. Cell Mol Immunol (2016) 13:347–53. doi: 10.1038/cmi.2016.5 Copyright © 2021 Ilyinskii, Roy, LePrevost, Rizzo and Kishimoto. This is an open-
39. Limmer A, Ohl J, Kurts C, Ljunggren HG, Reiss Y, Groettrup M, et al. Efficient access article distributed under the terms of the Creative Commons Attribution
Presentation of Exogenous Antigen by Liver Endothelial Cells to CD8+ T License (CC BY). The use, distribution or reproduction in other forums is permitted,
Cells Results in Antigen-Specific T-Cell Tolerance. Nat Med (2000) 6 provided the original author(s) and the copyright owner(s) are credited and that the
(12):1348–54. doi: 10.1038/82161 original publication in this journal is cited, in accordance with accepted academic
40. Lohse AW, Knolle PA, Bilo K, Uhrig A, Waldmann C, Ibe M, et al. Antigen- practice. No use, distribution or reproduction is permitted which does not comply with
Presenting Function and B7 Expression of Murine Sinusoidal Endothelial these terms.
Frontiers in Immunology | www.frontiersin.org 13 May 2021 | Volume 12 | Article 637469You can also read