Characterizing the tumor microenvironment of metastatic ovarian cancer by single-cell transcriptomics
←
→
Page content transcription
If your browser does not render page correctly, please read the page content below
Article

Characterizing the tumor microenvironment of
metastatic ovarian cancer by single-cell
transcriptomics
Graphical abstract                                                 Authors
                                                                   Susan Olalekan, Bingqing Xie,
                                                                   Rebecca Back, Heather Eckart,
                                                                   Anindita Basu

                                                                   Correspondence
                                                                   solalekan@uchicago.edu (S.O.),
                                                                   onibasu@uchicago.edu (A.B.)

                                                                   In brief
                                                                   Although molecular subtypes of ovarian
                                                                   cancer have been established from bulk-
                                                                   RNA sequencing, single-cell resolution is
                                                                   critical for developing personalized
                                                                   immunotherapies. Using Drop-seq data
                                                                   of single cells from ovarian tumors
                                                                   resected from omental metastases,
                                                                   Olalekan et al. reveal immune cell types
                                                                   and subsets with possible roles in the
                                                                   management of disease.

Highlights
d   Ovarian tumors separate into two groups: high T and low
    T cell infiltration groups

d   Granulysin-expressing CD4+ T cells are present in the high T
    infiltration cell group

d   MKI67-expressing plasmablasts are identified in high T cell
    infiltration tumors

d   Correlation of CD8 and Tox in this study with immunoreactive
    subtype in TCGA data

           Olalekan et al., 2021, Cell Reports 35, 109165
           May 25, 2021 ª 2021 The Author(s).
           https://doi.org/10.1016/j.celrep.2021.109165                                            ll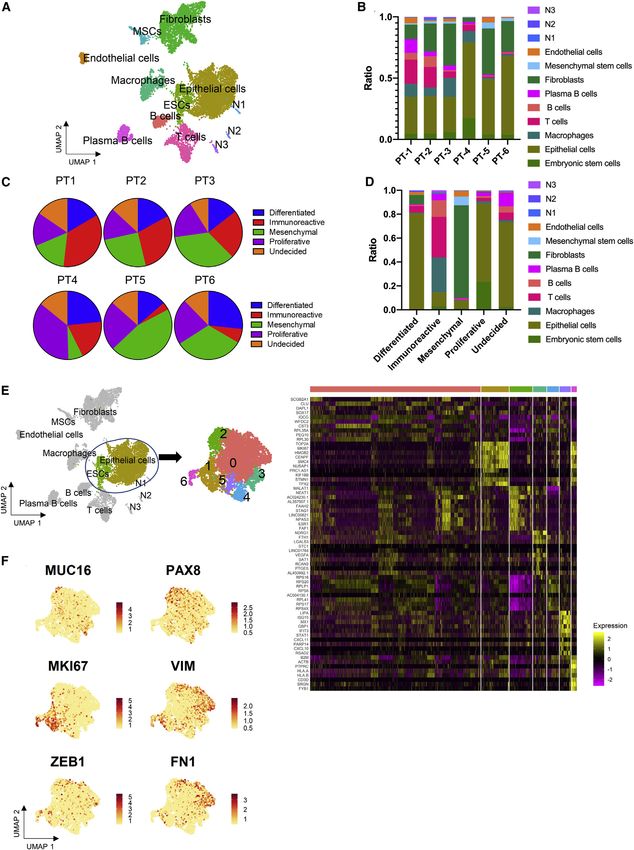
ll
                                                                                                                             OPEN ACCESS

Article
Characterizing the tumor microenvironment
of metastatic ovarian cancer
by single-cell transcriptomics
Susan Olalekan,1,* Bingqing Xie,1 Rebecca Back,1 Heather Eckart,1 and Anindita Basu1,2,*
1Section  of Genetic Medicine, Department of Medicine, University of Chicago, 5841 S. Maryland Avenue, Chicago, IL 60637, USA
2Lead  contact
*Correspondence: solalekan@uchicago.edu (S.O.), onibasu@uchicago.edu (A.B.)
 https://doi.org/10.1016/j.celrep.2021.109165

SUMMARY

Understanding the cellular composition of the tumor microenvironment and the interactions of the cells is
essential to the development of successful immunotherapies in cancer. We perform single-cell RNA
sequencing (scRNA-seq) of 9,885 cells isolated from the omentum in 6 patients with ovarian cancer and iden-
tify 9 major cell types, including cancer, stromal, and immune cells. Transcriptional analysis of immune cells
stratifies our patient samples into 2 groups: (1) high T cell infiltration (high Tinf) and (2) low T cell infiltration (low
Tinf). TOX-expressing resident memory CD8+ T (CD8+ Trm) and granulysin-expressing CD4+ T cell clusters are
enriched in the high Tinf group. Concurrently, we find unique plasmablast and plasma B cell clusters, and
finally, NR1H2+IRF8+ and CD274+ macrophage clusters, suggesting an anti-tumor response in the high Tinf
group. Our scRNA-seq study of metastatic tumor samples provides important insights in elucidating the im-
mune response within ovarian tumors.

INTRODUCTION                                                             associated with poor prognosis (Hu et al., 2020). So far, tran-
                                                                         scriptomic studies in ovarian cancer have focused on cancer
Ovarian cancer is the most lethal malignancy of the female repro-        cells. However, the tumor microenvironment contains other cell
ductive tract (Siegel et al., 2017). Conventional therapy involving      types that are relevant to patient stratification, targeted treat-
cytoreductive surgery and chemotherapy is 90% effective when             ment, and outcomes.
cancer is diagnosed at the early stage, when it is still restricted to     The omentum is a common metastatic site for peritoneal malig-
1 or both ovaries. Unfortunately, most ovarian cancer cases are          nancies, including ovarian cancer (Krist et al., 1998). It is mainly an
diagnosed at stage III or IV, when the cancer has metastasized           adipose tissue that contains aggregates of immune cells in areas
and the diagnosis in these patients results in a 30% 5-year sur-         called milky spots (Platell et al., 2000). These milky spots act
vival rate (Testa et al., 2018). To develop efficacious therapies for    similar to lymph nodes, collecting and responding to antigen
metastatic ovarian cancer, we need to define the cellular hetero-        within the peritoneal cavity. Interestingly, ovarian cancer cells
geneity and the transcriptional state within the tumor microenvi-        preferentially colonize adipose tissue with milky spots in the peri-
ronment. Immunohistochemical staining and flow cytometry                 toneal cavity (Clark et al., 2013). In addition, adipocytes provide
have been useful in categorizing the cell types based on specific        adipokines and act as a source of energy for ovarian cancer cells
cell surface markers but mask intra-cellular heterogeneity. Bulk         (Nieman et al., 2011). These factors prime the omentum as a pre-
RNA profiling has been used to categorize high-grade serous              metastatic niche for ovarian cancer. The initial presence of ovarian
ovarian carcinoma (HGSOC), the most common and lethal histo-             cancer cells in the omentum leads to a recruitment of macro-
type of ovarian cancer, into molecular subtypes (Tothill et al.,         phages into the milky spots without anti-tumor effects. Contrast-
2008; The Cancer Genome Atlas Research Network, 2011).                   ingly, the presence of tumor-infiltrating CD8+ T cells in both the
However, bulk RNA sequencing (RNA-seq) averages gene                     ovary and omentum is associated with significantly longer overall
expression and fails to identify the respective contribution of          survival (Santoiemma and Powell, 2015). However, checkpoint in-
cell subsets. Single-cell RNA-seq (scRNA-seq) has emerged                hibitors, a cancer immunotherapeutic approach, aimed at
as a powerful tool to interrogate tumor composition, revealing           restoring CD8+ T cell function have had a low response rate in
cellular heterogeneity and gene regulatory networks at single-           ovarian cancer patients (Santoiemma and Powell, 2015). We
cell resolution (Zheng et al., 2017b; Villani et al., 2017; Dixit        therefore need a better understanding of the tumor microenviron-
et al., 2016; Jaitin et al., 2016; Shalek et al., 2013; Zheng et al.,    ment to improve patient response to cancer immunotherapy.
2017a). Recently, a scRNA-seq study investigated the heteroge-             In the present study, we use Drop-seq, a high-throughput sin-
neity in the proposed cell of origin of HGSOC and revealed a high        gle scRNA-seq technique to examine the cells within omental tu-
epithelial-mesenchymal transition (EMT) prominent subtype                mors from 6 patients with different pathology-graded histotypes

                                                                        Cell Reports 35, 109165, May 25, 2021 ª 2021 The Author(s). 1
                      This is an open access article under the CC BY-NC-ND license (http://creativecommons.org/licenses/by-nc-nd/4.0/).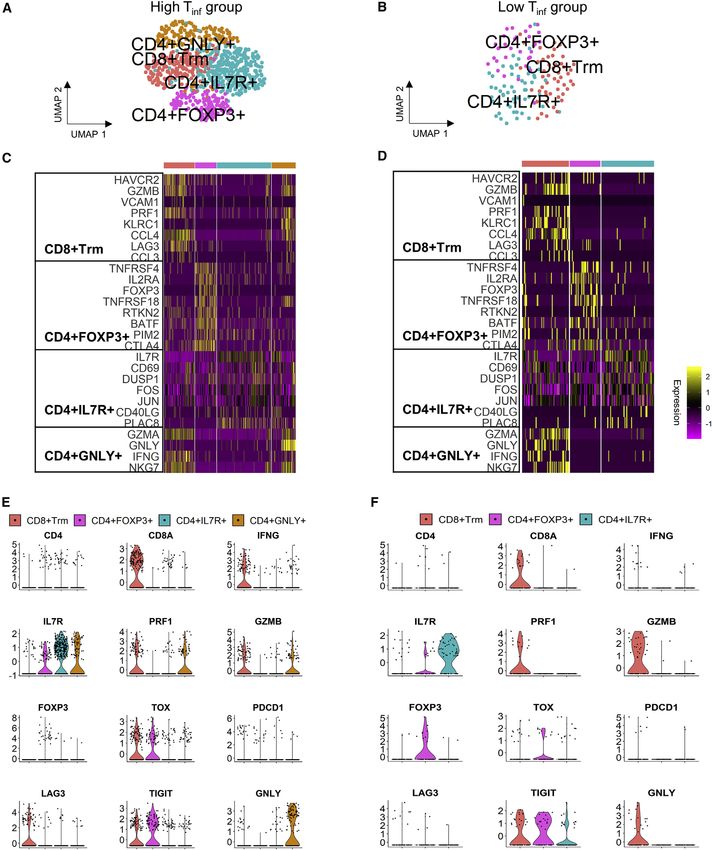
ll
OPEN ACCESS Article
Table 1. De-identified metadata for metastatic omental tumors from 6 ovarian cancer patients
Patient ID Age, y Race Origin Histologic type Histological grade Neoadjuvant therapy Stage (PMN/FIGO)
PT-1 62 white undetermined serous not applicable yes ypT3a Nx M1/IVb
PT-2 56 white left ovary high grade serous carcinoma high grade no pT3c Nx Mx/IIIc
PT-3 66 Black left fallopian (STIC) high grade serous carcinoma high grade yes ypT3c N1a/IIIc
PT-4 46 Asian left fallopian (STIC) high grade serous carcinoma high grade no pT3c Nx/IIIc
PT-5 71 Black left fallopian (STIC) high grade serous carcinoma high grade yes pT3c, N1, M1/IIIc
PT-6 66 Asian fallopian malignant mixed Mullerian tumor high grade yes ypT3c Nx/IIIc
of ovarian cancer. We identified 12 cell clusters among the pa- These data reveal patient variability in the cellular transforma-
tient cell population and stratified the patient samples into 2 tion of tumors in the late pathological stage.
groups based on immune signatures: (1) a high T cell infiltration
(high Tinf) group, and (2) a low T cell infiltration (low Tinf) group. We Generation of single-cell data, cell clustering, and cell-
also identified macrophage and B cell subsets that were unique type assignment
to the high Tinf group. This concurrent single-cell transcriptomic For Drop-seq experiments, each tumor sample was enzymati-
analysis of solid metastatic ovarian cancer tumors unravels the cally digested into a single-cell suspension and processed
genetic signatures of immune cell subsets within ovarian tumors (Macosko et al., 2015). We integrated all 6 omental samples
and can guide future immunotherapeutic approaches. into a gene expression matrix that contains the expression
values of 9,885 cells and 40,947 genetic features such as protein
RESULTS coding genes, pseudogenes, and long non-coding RNA
(lncRNA), mapped from the GENCODE (version GRCh38). Cells
Characteristics of the tumor microenvironment from all of the patient samples had an average of 4,296 unique
Ovarian cancer samples were collected from the omental met- molecular identifiers (UMIs), 1,742 genes, and 7.8% UMI counts
astatic site of 6 patients (Table 1). Four patients were diagnosed of mitochondrial origin per cell, as shown in Table 2. A minimum
with advanced HGSOC, 1 with serous carcinoma, and 1 with cutoff of 600 genes per cell was set. Hierarchical clustering was
malignant mixed Mullerian tumor (MMMT). The ages of the pa- performed using a resolution of 0.2, with 12 clusters detected
tients ranged from 46 to 71 years. Four of the patients received (Figure 2A). Cells from each patient were present in the major
neo-adjuvant therapy before surgery, including the patient clusters (Figure S2; Table S1). The cell types were assigned
diagnosed with MMMT. As metastasis progresses, there is an and curated using cell line correlation, canonical genes, and
inverse relationship between ovarian tumor growth (cancer functional categories according to significantly differentially ex-
and cancer-associated cell growth) and adipocytes within the pressed genes from the detected clusters. We were able to iden-
omentum (Nieman et al., 2011). Therefore, the area of tumor tify and assign a cell type to 9 major clusters with or without the
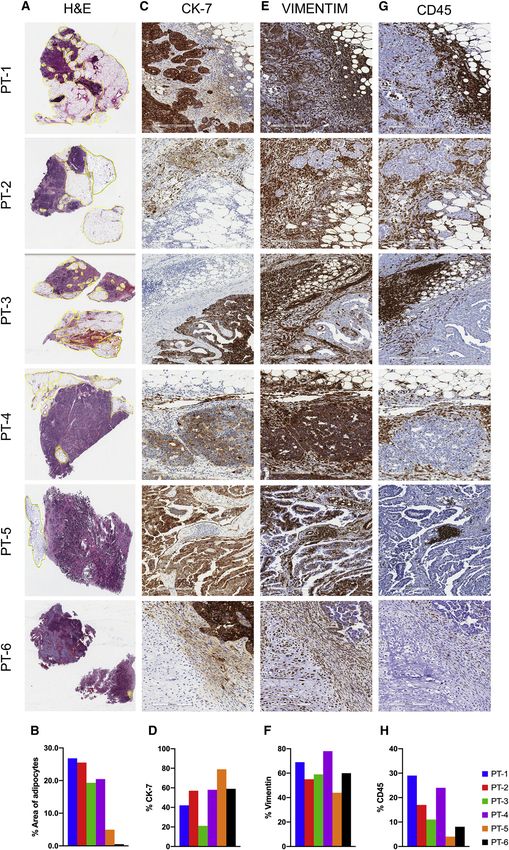
occupied by adipocytes decreases with disease score (Pearce MMMT sample (Figures 2A and S2). This included 1 cluster each
et al., 2018). The area of adipocytes shown using hematoxylin for epithelial cells, fibroblasts, mesenchymal stem cells (MSCs),
and eosin (H&E)-stained sections (Figure 1A) was reported as embryonic stem cells (ESCs), endothelial cells, and 4 clusters of
a percentage of the total surface area of the samples and immune cells. Three remaining unidentified clusters, marked N1,
used as a measure of disease score (Figure 1B), similar to N2, N3, contained relatively few cells (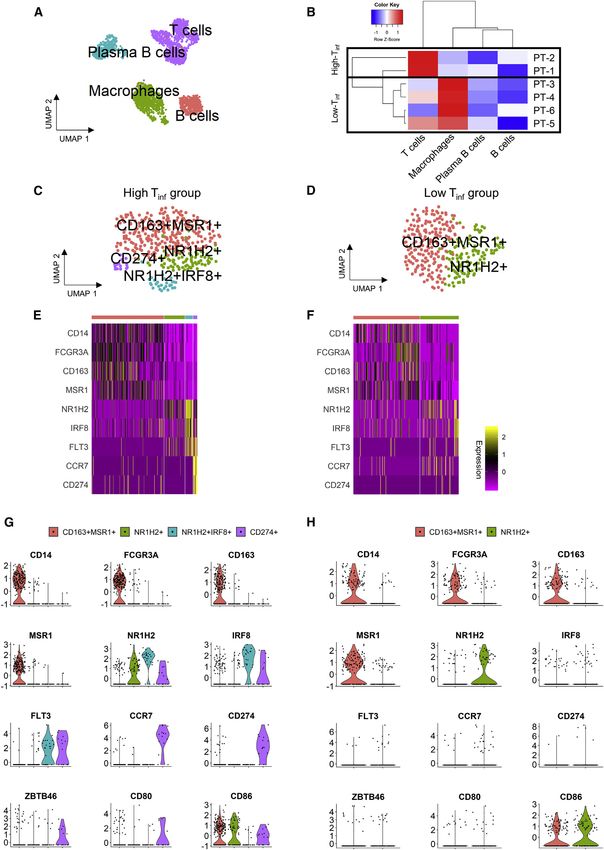
ll
Article                         OPEN ACCESS

                               (legend on next page)

          Cell Reports 35, 109165, May 25, 2021 3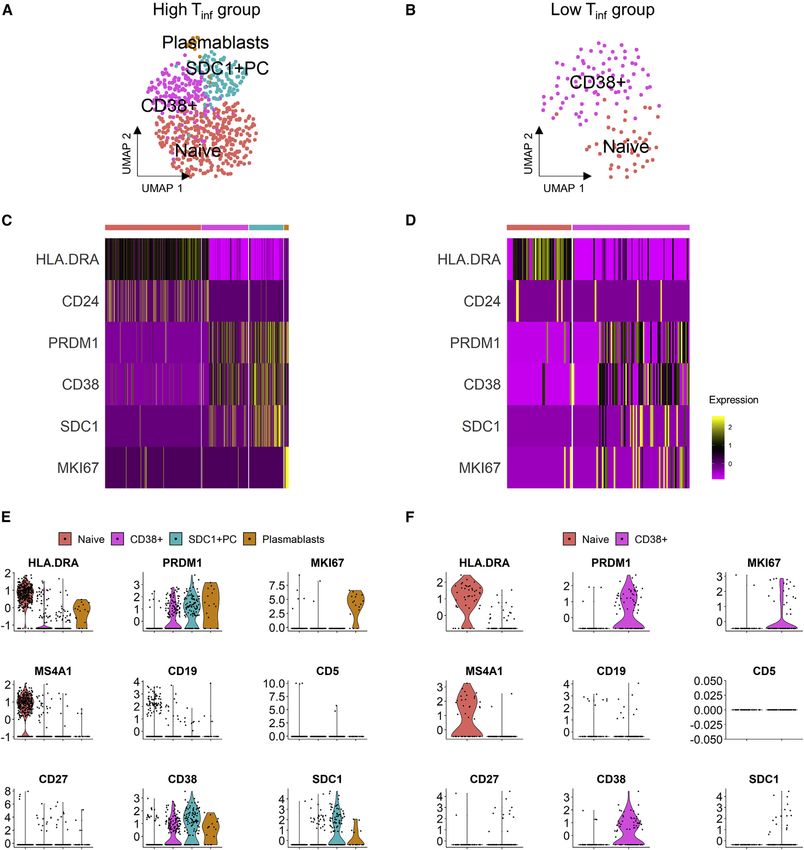
ll
       OPEN ACCESS                                                                                                                           Article

Table 2. Statistics and filter parameters applied to samples collected from 6 patients and the resulting number of cells, genes, and UMI
per sample
                                                                                Mean no.            Median no.         Mean no.           Median no.
Patient ID        Raw reads      Gene cutoff      No. genes       No. cells     genes per cell      genes per cell     UMIs per cell      UMIs per cell
PT-1              60,870,530     600              24,776          1,244         1,517               979                4,229              1,940
PT-2              308,036,080    800              32,024          3,451         1,894               1,391              4,802              2,796
PT-3              56,498,174     800              24,063          1,071         1,625               1,308              3,849              2,728
PT-4              144,287,737    700              19,297          1,102         1,830               1,391              5,235              3,034
PT-5              89,967,519     700              26,499          1,108         1,744               1,313              3,795              2,332
PT-6              77,505,171     800              26,221          1,909         1,624               1,387              3,425              2,595

mesenchymal subtype is very different from the other subtypes,                  markers of EMT. Ovarian cancer stem cells, marked by the co-
consisting of a high ratio of fibroblasts. These findings are                   expression of CD33, CD44, CD117, and CD24, were not
consistent with a recent study from Schwede et al. (2020) that                  observed (Klemba et al., 2018). These results reveal a snapshot
examined bulk mRNA-seq TCGA data and reported that ovarian                      of the heterogeneous transcriptional state of cancer cells during
cancer molecular subtypes reflect the proportion of cell types                  the later course of disease (International Federation of Gynecol-
within each tumor (Figure 2D).                                                  ogy and Obstetrics [FIGO] stages IIIc–IVb).
   We wanted to test whether the established molecular sub-
types could be useful in specifically categorizing cancer cells                 Immune cellular profile of patient samples
within a tumor. However, most of the epithelial cells belonged                  To investigate the immune population in our patient samples, we
to the differentiated, proliferative, and undecided subtypes                    performed clustering on the immune cells from the 6 patient
(Figure 2D). Based on the expression of WT1 and CD24, we refer                  samples; the cells clustered into 4 main populations: T cells, B
to this cluster as ‘‘cancer epithelial cells’’ (Figure S2) (Hylander            cells, plasma B cells, and macrophages (Figure 3A). Using a
et al., 2006; Kristiansen et al., 2002). We also integrated our                 dendrogram to group samples with similar cell populations, our
data with previously published ovarian cancer scRNA-seq                         cohort was separated into 2 groups based on their T cell popu-
data, and all of the cancer epithelial cells were co-localized                  lation: (1) the high T cell infiltration (high Tinf) group (PT-1 and PT-
(data not shown) (Shih et al., 2018; Izar et al., 2020). The chon-              2) and (2) low Tinf group (PT-3–PT-6) (Figure 3B). Interestingly, the
drosarcomatous elements of MMMT (PT-6) were confirmed by                        high Tinf group had the lowest disease scores (as determined by
our Drop-seq data (Figure S2; Table S1). Next, we extracted cells               IHC; Figure 1), while the low Tinf group showed relatively higher
from the central cluster, cancer epithelial cells, and ESCs that                disease scores. The results are consistent with and without the
cluster closely together and performed hierarchical clustering.                 MMMT sample (Figures 3B and S2); the MMMT sample (PT-6)
A total of 7 clusters were detected (Figure 2E, top). The heatmap               belongs to the low Tinf group (Figure 3B). Macrophages are re-
of the top 10 differentially expressed genes based on adjusted p                cruited from the peritoneal cavity during the initial phase of
value for all subclusters are shown in Figure 2E (bottom). The top              metastasis (Shimotsuma et al., 1992; Oosterling et al., 2006).
processes as revealed by Gene Ontology analysis are epithelial                  The presence of M1 (CD68+) and M2 (CD163+) macrophages
tube morphogenesis (cluster 2), epithelial cell differentiation                 were confirmed by IHC staining (Figure S3). To assess the differ-
(clusters 3 and 5), and epithelial cell proliferation (cluster 6) (Table        ences in the macrophage population, we performed unsuper-
S2). Epithelial ovarian cancer was the top disease for clusters 1,              vised clustering separately on macrophages from the high Tinf
3, and 6 (Table S2). Some previously described marker genes                     group and low Tinf group, respectively (Figures 3C and 3D).
that differentiate the subclusters are shown (Figure 2F and Table               Both groups had a CD163+CD204+ cluster that also highly ex-
S3). PAX8 and MUC16, indicative of advanced disease, were ex-                   pressed CD14 and FCGR3A reminiscent of tumor-associated
pressed by cluster 2 (adjusted p = 4.95 3 10 13 and 1.83 3                      macrophages (TAMs) (Figures 3E, 3F, and S4; Table S4). Closely
10 53) (Robertson et al., 1999; Thériault et al., 2011). MUC16                 associated with this cluster is the NR1H2+ cluster that is present
was also expressed by cluster 3 (adjusted p = 2.86 3 10 6). Clus-               in both high Tinf and low Tinf group. NR1H2 inhibits inflammatory
ters 1 and 6 expressed both MKI67 (adjusted p = 3.5 3 10 168                    genes in macrophages (Castrillo et al., 2003; A-González and
and 4.19 3 10 31) and VIM (adjusted p = 0.01 and 3.92 3                         Castrillo, 2011). The high Tinf group also included a NR1H2+ sub-
10 32), indicative of a proliferating population. Cluster 5 ex-                 cluster that expresses IRF8+ (adjusted p = 2.1 3 10 8). IRF8 is
pressed FN1 (adjusted p = 0.05) and ZEB1 (adjusted p = 0.01),                   induced in the presence of IFNG and promotes the formation

Figure 1. Immunohistochemical staining and sample description
(A and B) Hematoxylin and eosin (H&E)-stained sections (A) with (B) the histogram of the percentage area of adipocytes in the patient samples.
(C and D) Cytokeratin-7 (CK-7) staining on patient samples (C) with (D) the histogram of the percentage of CK-7+ cells.
(E and F) Vimentin staining on patient samples (E) with (F) the histogram of percentage of vimentin-positive cells.
(G and H) CD45 staining on patient samples (G) with (H) the histogram of the percentage of CD45+ cells.
Images were taken at (A) 403, and (C, E, and G) 4003.

4 Cell Reports 35, 109165, May 25, 2021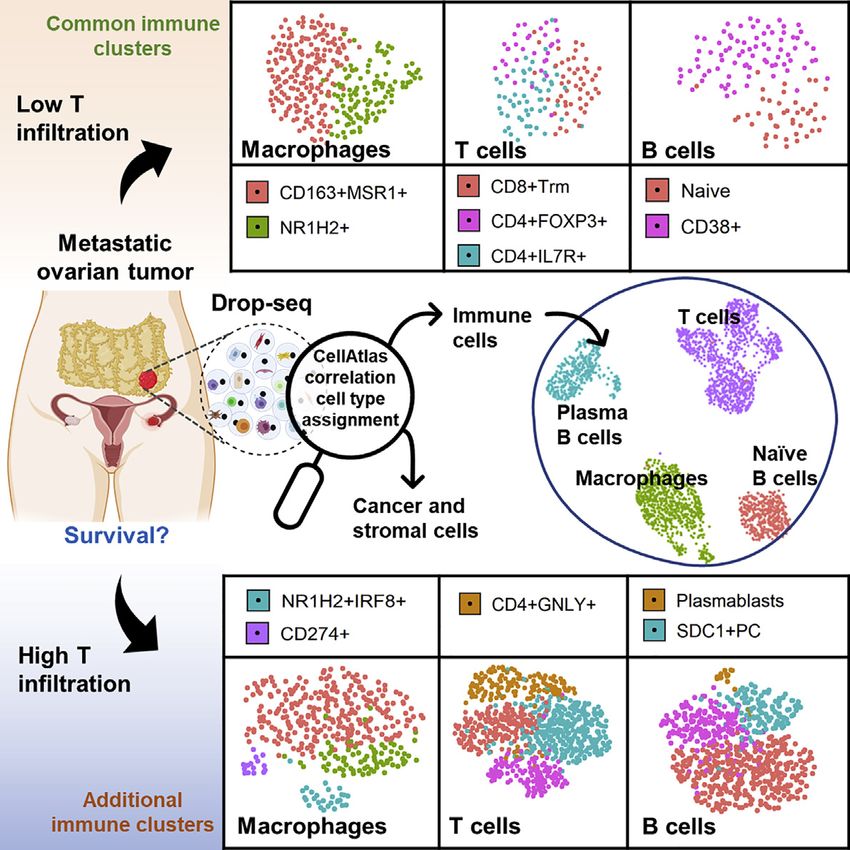
ll
Article                         OPEN ACCESS

                               (legend on next page)

          Cell Reports 35, 109165, May 25, 2021 5
ll
OPEN ACCESS Article
of autophagosomes (Figures 3E, 3F, and S4) (Gupta et al., 2015). that are reactivated in response to programmed death-ligand 1
Finally, the high Tinf group included a CD274+ cluster, suggesting (PD-L1) immunotherapy (Yao et al., 2019; Khan et al., 2019).
a regulatory population similar to myeloid-derived suppressor CD8+ Trm cluster in the high Tinf group (Figure 4A) expressed
cells (MDSCs). However, these CD274+ cells also express TOX, LAG3, and TIGIT (Figures 4E and 4F). The positive Pearson
CCR7 (adjusted p = 4.1 3 10 8), a marker for M1 macrophages correlation between TOX and markers of exhaustion suggests
that are positively associated with survival time in cancer (Yuan that TOX+ T are exhausted T cells (Table S5). Based on TCGA
et al., 2015, Ma et al., 2010). Both NR1H2+IRF8+ and CD274+ ovarian cancer data, the co-expression of CD8 and TOX was sta-
clusters express FLT3. FLT3+ progenitors can differentiate into tistically significant in the immunoreactive subtype (p = 6.123 3
osteoclasts, dendritic cells, microglia, and macrophages 10 7***), the mesenchymal subtype (p = 0.0018**), and positive
(Servet-Delprat et al., 2002). The CD274+ cluster also expressed but not significant in the differentiated subtype (p = 0.0603).
ZBTB46 and CD80 (Figures 3G and 3H). There is a positive Pear- The correlation between CD4 and GNLY was significant in the
son correlation (Table S4) between these markers, suggesting differentiated subtype (p = 3.383 3 10 5***), the mesenchymal
that the CD274+ cluster is similar to M1 macrophages. We as- subtype (p = 0.0280*), the proliferative subtype (p = 0.0013**),
sessed cluster N3 in our dataset, which closely resembles den- and positive but not significant in the immunoreactive subtype
dritic cells, albeit the few number of cells detected, for genes ex- (p = 0.0636; Table S6). According to the Mayo Clinic ovarian can-
pressed by macrophages. The N3 cluster (dendritic cells), mainly cer cohort, patients within the immunoreactive subtype followed
found in the high Tinf group (Figure S2; Table S1), also expressed by the differentiated subtype displayed the longest survival
IRF8, FLT3, and HLA.DRA (Figure S4). This analysis reveals tran- (Konecny et al., 2014). Our data provide insights into molecular
scriptionally distinct macrophages present in tumors, in addition markers that correlate and may be responsible for the increased
to the presence of established TAMs. overall survival displayed by patients in the immunoreactive
subtype.
Differences in T cell clustering and subtype analysis
To reveal the functional subtypes of T cells and differences in Transcriptionally distinct plasmablast and plasma cell
the high Tinf versus low Tinf groups, we clustered 820 and 136 cluster in high Tinf group
T cells, respectively (Figures 4A and 4B). To enable a fair com- To investigate the B cell subtypes in our samples, both naive and
parison between the 2 disease groups, we randomly sub- plasma B cells were clustered yielding 4 and 2 clusters in high Tinf
sampled the T cells within the high Tinf group to match the and low Tinf groups, respectively (Figures 5A and 5B). In the high
T cell numbers in the low Tinf group. The subsampling was per- Tinf and low Tinf groups, the naive cluster highly expressed major
formed 50 times for statistical confidence and the number of histocompatibility complex (MHC) class II genes (HLA.DRA,
T cell clusters in each group remained the same (data not HLA.DPA1, HLA.DQA1) (Figures 5C, 5D, and S5; Table S7). Tu-
shown). mor-associated B cell subpopulations have previously been
A total of 4 and 3 transcriptionally distinct clusters emerged defined; we assessed our dataset for these subsets using a com-
from high Tinf and low Tinf groups of T cells, respectively. The bination of gene expression and Pearson correlation (Griss et al.,
highest differentially expressed genes revealed clusters similar 2019). In the high Tinf group, there were 3 PRDM1+ clusters:
to previously described T cell phenotypes in breast cancer, SDC1+ plasma cells, CD38+ germinal center B cells, and the final
including CD4+IL7R+, CD4+FOXP3+, resident memory CD8+ cluster highly expressed MHC class II genes, as well as MKI67
T cells (CD8+ Trm cells), and 1 population described in lung can- (adjusted p = 2.16 3 10 6), suggesting a plasmablast population
cer and liver cancer with high granulysin expression, (Figures 5C, 5D, and S5; Table S7). Pearson correlation was
CD4+GNLY+ (Figures 4C–4F, S5, and S6) (Savas et al., 2018; used to confirm co-expression between PRDM1 and other
Guo et al., 2018; Zheng et al., 2017a). IFNG expressing CD8+ marker genes in each B cell subset (Table S7). The PRDM1+ clus-
Trm clusters were present in both groups. Both groups also ter in the low Tinf group expressed CD38, suggesting that they
had CD4+IL7R+ and CD4+FOXP3+ T cell clusters. The high Tinf are germinal center B cells. The presence of tertiary lymphoid
group had an extra CD4+GNLY+ (adjusted p = 6.09 3 10 18) structures was confirmed using H&E and CD19 IHC staining (Fig-
cluster. Contrastingly, GNLY was expressed in the low Tinf group ure S7). Activated B cells produce IFNG, so we assessed our
by CD8+ Trm cluster (adjusted p = 1.64 3 10 6) (Figures 4D, 4F, data for IFNG expression in the B cell subsets (Olalekan et al.,
and S6; Table S5). TOX was only significantly highly expressed 2015). Plasmablasts expressed IFNG in the high Tinf group, while
(adjusted p = 4.23 3 10 3) by the CD8+ Trm cluster in the high none of the B cell clusters in the low Tinf group expressed IFNG
Tinf group, but not differentially expressed in the low Tinf group (Figure S5). Together with the T cell data, these results suggest
clusters (Figures 4C and 4D; Table S5). TOX+ T cells persist dur- that B cells may contribute to the immune response within the tu-
ing chronic infection, and TOX is expressed by the CD8+ T cells mor microenvironment.
Figure 2. Cell-type and molecular subtype assignment using Drop-seq data
(A) UMAP of high-quality cells from all 6 metastatic ovarian cancer samples from the omentum, colored by clustering results.
(B) Ratio of cellular composition in each patient sample.
(C) Cancer subtype designation for each patient sample based on TCGA classification.
(D) Cancer subtype designation by cell type based on TCGA.
(E) UMAP and heatmap of top 10 genes per subcluster derived from epithelial cells and ESCs.
(F) Feature plots of relevant marker genes of 4,733 cells in the epithelial cell cluster, aggregated from all samples.
6 Cell Reports 35, 109165, May 25, 2021ll
Article OPEN ACCESS
(legend on next page)
Cell Reports 35, 109165, May 25, 2021 7ll
OPEN ACCESS Article
DISCUSSION T cells are the central players in most immunotherapeutic ap-
proaches in oncology (Sharma and Allison, 2015). In our study,
The transcriptomic data of the 9,885 cells (not including adipo- we identified GNLY expressing CD4+ T cells and TOX express-
cytes; see Method details) collected from omental tumor sam- ing CD8+ Trm cells in our high Tinf group. Previous T cell
ples in this study provide a holistic insight into the tumor micro- profiling studies have identified CD4+GNLY+ T cells in lung
environment of metastatic ovarian cancer. Mapping our cells to and liver cancer (Zheng et al., 2017a; Guo et al., 2018). These
curated cell types from the CellAtlas along with Gene Ontology cells are suggested to have cytotoxic function similar to cyto-
and pathway-based enrichment allowed robust cell-type assign- toxic CD8+ T cells and may provide a viable approach to cancer
ment compared to cell markers alone. Our approach allowed us therapy. Advances in personalized medicine have revealed
to simultaneously analyze the cancer and stromal compartments TOX as a transcription factor expressed by T cells that respond
of the tumor microenvironment with an emphasis on the different to immune checkpoint blockade (Yao et al., 2019; Siddiqui
immune cell types and subsets. We identified unique subpopu- et al., 2019). In our tumor samples, TOX was mainly expressed
lations such as CD274+ and IRF8+ macrophages, CD4+GNLY+ by the CD8+ Trm cluster in the high Tinf group. IFNG from cells of
T cells, plasmablasts, and plasma B cells. This comprehensive the CD8+ Trm cluster in the high Tinf may be responsible for the
approach helps unravel the interactions between the cells within induction of IRF8 in macrophages. Interestingly, GNLY was ex-
metastatic ovarian tumors at single-cell resolution. pressed by the CD4+GNLY+ cluster in the high Tinf group and
The largest cluster of cells was cancer epithelial cells, which CD8+ Trm cluster in the low Tinf group. The differences in the ef-
composed 50% of the cells analyzed. Cells of the epithelial fect of granulysin from CD4+ T cells and CD8+ T cells on cancer
subclusters expressed various genes associated with metastatic cells need to be investigated. Tumors can be categorized
disease, including MUC16 and PAX8, while other subclusters based on their immunoscore (the basal immune response
highly expressed EMT marker, vimentin. Of particular interest within the tumor) from cold tumors to hot tumors to help guide
was the presence of cancer stem cells (CSCs), a potentially use- the personalization of cancer therapy (Galon and Bruni, 2019).
ful therapeutic approach to target ovarian cancer (Bast et al., Future scRNA-seq analysis of T cells sampled from different re-
2009). Like previous studies, we were unable to identify cells gions of tumors of different immunoscores will be informative in
that co-expressed known markers of stem cells (Shah and guiding immunotherapeutic approaches. Our scRNA-seq data
Landen, 2014; Burgos-Ojeda et al., 2012). However, we identi- (high Tinf group), bulk RNA-seq from TCGA and Mayo Clinic
fied a cell population closely resembling ESCs and adjacent to data (immunoreactive and differentiated molecular subtypes),
the epithelial cell cluster that highly expressed proliferative taken together reveal that a high infiltration of CD8+TOX+ and
marker, MKI67. Successful identification, isolation, and interro- CD4+GNLY+ T cells may be a good indicator of patient survival
gation of putative ESCs may provide useful insights about in ovarian cancer.
CSCs in ovarian cancer. Tertiary lymphoid structures were detected in almost all tumor
Our data revealed a positive correlation between the presence samples, albeit to varying extents. The high Tinf and low Tinf
of adipocytes (by IHC) and immune cells (by Drop-seq). Howev- groups had germinal center B cells (PRDMI+CD38+). Interest-
er, infiltration of immune cells into the omentum during metasta- ingly, the high Tinf group also had unique B cell subsets, including
tic cancer does not always elicit anti-tumor responses (PRDMI+SDC1+) plasma cells and IFNG expressing plasma-
(Oosterling et al., 2006). To this end, we sought to transcription- blasts (PRDMI+CD38+MKI67+). Previous study of tumor-induced
ally characterize the immune cells within our samples. Our pa- plasmablast-like B cell population supports the presence of
tient samples stratified into 2 groups: high Tinf and low Tinf, based these cells in patients who respond to immune checkpoint
on similar T cell populations. In addition, our data revealed tran- blockade (Griss et al., 2019). In addition, these plasmablast-
scriptionally distinct subclusters unique to macrophage and B like cells increase PD-1+ T cell activation (Griss et al., 2019). It
cell clusters in the high Tinf group. For macrophages, in addition will be useful to investigate the role of antigen-cognate plasma-
to the 2 clusters present in both groups, there were 2 clusters, blasts in the generation and/or maintenance of TOX+ T cells.
NR1H2+IRF8+ and CD274+ clusters, present only in the high Furthermore, these plasmablast-like cells expressed macro-
Tinf group. IRF8 and CD274 are upregulated in an activation- phage chemo-attractants and correlated positively with the
dependent manner, suggesting that the high Tinf group may be presence of CD8a (Griss et al., 2019). These studies, combined
mounting an anti-tumor immune response. NR1H2+IRF8+ and with our current data, suggest an association between plasma-
CD274+ clusters share similar gene expression, closely resem- blast-like B cells, CD8+TOX+ and CD4+GNLY+ T cells, and
bling M1 macrophages. It could be that the macrophages in NR1H2+IRF8+ and CD274+ macrophages. A mechanistic study
the NR1H2+IRF8+ cluster are in a transitionary state; therefore, of these plasmablast-like and plasma B cells within the tumor
stimulating them to becoming M1 macrophages may be another microenvironment is necessary to improve patient’s response
approach for cancer immunotherapy. to immune checkpoint inhibitors.
Figure 3. scRNA-seq data of annotated immune population from all 6 patient samples
(A) UMAP of immune cells showing the 4 main immune cell types based on correlation with CellAtlas cell type.
(B) Heatmap of immune cell types (T cell, B cell, plasma B cell, and macrophage) in each patient sample with dendrograms on cell types (columns) and patients
(rows), dividing the samples into high and low T cell infiltration (Tinf) groups.
(C and D) UMAP plots of unsupervised clustering of annotated macrophages from (C) high Tinf (383 cells) and (D) low Tinf (312 cells) groups.
(E and F) Heatmaps from immune cells showing differentially expressed markers between clusters in (E) high Tinf and (F) low Tinf groups.
(G and H) Feature plots of expression in relevant genes in macrophages in high and low Tinf groups, respectively.
8 Cell Reports 35, 109165, May 25, 2021ll
Article OPEN ACCESS
Figure 4. Characterization of annotated T cell population
(A and B) UMAP of T cells in (A) high Tinf (820 cells) and (B) low Tinf (136 cells) groups.
(C and D) Heatmaps of key genes in different clusters in (C) high Tinf and (D) low Tinf groups. Clusters in heatmaps are indicated by the same color as in the UMAP
plots.
(E and F) Violin plots showing scaled log-normalized expression values of key genes in (E) high Tinf and (F) low Tinf groups.
Cell Reports 35, 109165, May 25, 2021 9ll
OPEN ACCESS Article
Figure 5. Identification of B cell clusters across all patient samples
(A and B) UMAP plot for B cells in (A) high Tinf (396 cells) and (B) low Tinf (124 cells) groups.
(C and D) Heatmaps of key genes in different clusters in (C) high Tinf and (D) low Tinf groups. Clusters in heatmap are indicated by the same color as in the UMAPs.
(E and F) Violin plots showing scaled log-normalized expression values of key genes in (E) high Tinf and (F) low Tinf groups.
In addition to the major cell types analyzed, there were other (FGF18) expressed by the cancer epithelial cells in our dataset
clusters, including 1 each of endothelial cell, mesenchymal may enhance tumor angiogenesis (Figure S7) (Wei et al., 2013).
stem cell, and fibroblast, and 3 clusters of undecided cell types The MSCs were transcriptionally closest to the fibroblasts. In-
(N1, N2, N3). Endothelial cells line the luminal side of blood ves- flamed omentum contains stem cells displaying similar surface
sels and are necessary for the metastasis of ovarian cancer cells markers to MSCs (Shah et al., 2012; Friedenstein et al., 1968).
(Hanahan and Folkman, 1996). Fibroblast growth factor 18 These stem cells are capable of differentiating into fat, cartilage,
10 Cell Reports 35, 109165, May 25, 2021ll Article OPEN ACCESS or bone, depending on the secreted factors present (Shah et al., d EXPERIMENTAL MODEL AND SUBJECT DETAILS 2012; Friedenstein et al., 1968). Finally, there was a distinct fibro- d METHOD DETAILS blast cluster in our samples. Metastatic transformation of the B Immunohistochemistry omentum changes the cellular composition from mainly adipo- B Tissue digestion, red blood cell lysis and dead cell cytes to cancer cells, immune cells, and fibroblasts (Pearce removal et al., 2018). Cancer-associated fibroblasts (CAFs) mainly func- B Drop-seq experiments tion to remodel the extracellular matrix in the tumor microenvi- B Data processing, alignment and clustering analysis ronment (Kalluri, 2016). Recently, a scRNA-seq study of CAFs B Cancer subtype classification and correlation with The in pancreatic cancer revealed a LRRC15+ CAF population that Cancer Genome Atlas correlated with poor response in patients treated with anti- B Cell type classification and correlation with CellAtlas PD-L1 therapy (Dominguez et al., 2020). We identified LRRC15 B Classification with cluster markers, canonical genes, expressing fibroblasts in our dataset (Figure S7). However, and genetic functions their function in ovarian cancer immunotherapy needs to be B Marker identification for subtypes of various cell popu- investigated. lations The undecided clusters, from mapping to the CellAtlas cell B Comparison and validation with bulk sequencing data types, best correlate with astrocytes (N1), common myeloid pro- from The Cancer Genome Atlas (TCGA) program genitor (CMP)/bone marrow progenitor (N2), and plasmacytoid d QUANTIFICATION AND STATISTICAL ANALYSIS dendritic cells (N3), respectively. Although we were interested in the dendritic cell population, we were restricted from further SUPPLEMENTAL INFORMATION analysis due to low cell count (
ll
       OPEN ACCESS                                                                                                                                       Article
Burgos-Ojeda, D., Rueda, B.R., and Buckanovich, R.J. (2012). Ovarian cancer            Izar, B., Tirosh, I., Stover, E.H., Wakiro, I., Cuoco, M.S., Alter, I., Rodman, C.,
stem cell markers: prognostic and therapeutic implications. Cancer Lett. 322,          Leeson, R., Su, M.J., Shah, P., et al. (2020). A single-cell landscape of high-
1–7.                                                                                   grade serous ovarian cancer. Nat. Med. 26, 1271–1279.
Butler, A., Hoffman, P., Smibert, P., Papalexi, E., and Satija, R. (2018). Inte-       Jaitin, D.A., Weiner, A., Yofe, I., Lara-Astiaso, D., Keren-Shaul, H., David, E.,
grating single-cell transcriptomic data across different conditions, technolo-         Salame, T.M., Tanay, A., van Oudenaarden, A., and Amit, I. (2016). Dissecting
gies, and species. Nat. Biotechnol. 36, 411–420.                                       Immune Circuits by Linking CRISPR-Pooled Screens with Single-Cell RNA-
Castrillo, A., Joseph, S.B., Marathe, C., Mangelsdorf, D.J., and Tontonoz, P.          Seq. Cell 167, 1883–1896.e15.
(2003). Liver X receptor-dependent repression of matrix metalloproteinase-9            Kalluri, R. (2016). The biology and function of fibroblasts in cancer. Nat. Rev.
expression in macrophages. J. Biol. Chem. 278, 10443–10449.                            Cancer 16, 582–598.
Chen, J., Bardes, E.E., Aronow, B.J., and Jegga, A.G. (2009). ToppGene Suite           Khan, O., Giles, J.R., McDonald, S., Manne, S., Ngiow, S.F., Patel, K.P.,
for gene list enrichment analysis and candidate gene prioritization. Nucleic           Werner, M.T., Huang, A.C., Alexander, K.A., Wu, J.E., et al. (2019). TOX tran-
Acids Res. 37, W305–W311.                                                              scriptionally and epigenetically programs CD8+ T cell exhaustion. Nature
Chen, M., Zhan, Q., Mu, Z., Wang, L., Zheng, Z., Miao, J., Zhu, P., and Li, Y.I.       571, 211–218.
(2021). Alignment of single-cell RNA-seq samples without overcorrection us-            Klemba, A., Purzycka-Olewiecka, J.K., Wcis1o, G., Czarnecka, A.M., Lewicki,
ing kernel density matching. Genome Res. 31, 698–712.                                  S., Lesyng, B., Szczylik, C., and Kieda, C. (2018). Surface markers of cancer
Clark, R., Krishnan, V., Schoof, M., Rodriguez, I., Theriault, B., Chekmareva,         stem-like cells of ovarian cancer and their clinical relevance. Contemp. Oncol.
M., and Rinker-Schaeffer, C. (2013). Milky spots promote ovarian cancer met-           (Pozn.) 22 (1A), 48–55.
astatic colonization of peritoneal adipose in experimental models. Am. J.              Konecny, G.E., Wang, C., Hamidi, H., Winterhoff, B., Kalli, K.R., Dering, J.,
Pathol. 183, 576–591.                                                                  Ginther, C., Chen, H.W., Dowdy, S., Cliby, W., et al. (2014). Prognostic and
Dixit, A., Parnas, O., Li, B., Chen, J., Fulco, C.P., Jerby-Arnon, L., Marjanovic,     therapeutic relevance of molecular subtypes in high-grade serous ovarian can-
N.D., Dionne, D., Burks, T., Raychowdhury, R., et al. (2016). Perturb-Seq: Dis-        cer. J. Natl. Cancer Inst. 106, dju249.
secting Molecular Circuits with Scalable Single-Cell RNA Profiling of Pooled           Krist, L.F., Kerremans, M., Broekhuis-Fluitsma, D.M., Eestermans, I.L., Meyer,
Genetic Screens. Cell 167, 1853–1866.e17.                                              S., and Beelen, R.H. (1998). Milky spots in the greater omentum are predom-
Dobin, A., Davis, C.A., Schlesinger, F., Drenkow, J., Zaleski, C., Jha, S., Batut,     inant sites of local tumour cell proliferation and accumulation in the peritoneal
P., Chaisson, M., and Gingeras, T.R. (2013). STAR: ultrafast universal RNA-seq         cavity. Cancer Immunol. Immunother. 47, 205–212.
aligner. Bioinformatics 29, 15–21.                                                                                       €ns, K., Dahl, E., Pilarsky, C., and Haupt-
                                                                                       Kristiansen, G., Denkert, C., Schlu
Dominguez, C.X., Mu  €ller, S., Keerthivasan, S., Koeppen, H., Hung, J., Gierke,       mann, S. (2002). CD24 is expressed in ovarian cancer and is a new indepen-
S., Breart, B., Foreman, O., Bainbridge, T.W., Castiglioni, A., et al. (2020). Sin-    dent prognostic marker of patient survival. Am. J. Pathol. 161, 1215–1221.
gle-Cell RNA Sequencing Reveals Stromal Evolution into LRRC15+ Myofibro-               Ma, J., Liu, L., Che, G., Yu, N., Dai, F., and You, Z. (2010). The M1 form of tu-
blasts as a Determinant of Patient Response to Cancer Immunotherapy. Can-              mor-associated macrophages in non-small cell lung cancer is positively asso-
cer Discov. 10, 232–253.                                                               ciated with survival time. BMC Cancer 10, 112.
Frankish, A., Diekhans, M., Ferreira, A.M., Johnson, R., Jungreis, I., Loveland,       Mabbott, N.A., Baillie, J.K., Brown, H., Freeman, T.C., and Hume, D.A. (2013).
J., Mudge, J.M., Sisu, C., Wright, J., Armstrong, J., et al. (2019). GENCODE           An expression atlas of human primary cells: inference of gene function from
reference annotation for the human and mouse genomes. Nucleic Acids                    coexpression networks. BMC Genomics 14, 632.
Res. 47 (D1), D766–D773.                                                               Macosko, E.Z., Basu, A., Satija, R., Nemesh, J., Shekhar, K., Goldman, M., Tir-
Friedenstein, A.J., Petrakova, K.V., Kurolesova, A.I., and Frolova, G.P. (1968).       osh, I., Bialas, A.R., Kamitaki, N., Martersteck, E.M., et al. (2015). Highly Par-
Heterotopic of bone marrow. Analysis of precursor cells for osteogenic and he-         allel Genome-wide Expression Profiling of Individual Cells Using Nanoliter
matopoietic tissues. Transplantation 6, 230–247.                                       Droplets. Cell 161, 1202–1214.
Galon, J., and Bruni, D. (2019). Approaches to treat immune hot, altered and           Mcinnes, L., Healy, J., and Melville, J. (2018). UMAP: Uniform Manifold
cold tumours with combination immunotherapies. Nat. Rev. Drug Discov.                  Approximation and Projection for Dimension Reduction. J. Open Source
18, 197–218.                                                                           Softw. 29, 861.
Griss, J., Bauer, W., Wagner, C., Simon, M., Chen, M., Grabmeier-Pfisters-             Nieman, K.M., Kenny, H.A., Penicka, C.V., Ladanyi, A., Buell-Gutbrod, R., Zill-
hammer, K., Maurer-Granofszky, M., Roka, F., Penz, T., Bock, C., et al.                hardt, M.R., Romero, I.L., Carey, M.S., Mills, G.B., Hotamisligil, G.S., et al.
(2019). B cells sustain inflammation and predict response to immune check-             (2011). Adipocytes promote ovarian cancer metastasis and provide energy
point blockade in human melanoma. Nat. Commun. 10, 4186.                               for rapid tumor growth. Nat. Med. 17, 1498–1503.
Guo, X., Zhang, Y., Zheng, L., Zheng, C., Song, J., Zhang, Q., Kang, B., Liu, Z.,      Olalekan, S.A., Cao, Y., Hamel, K.M., and Finnegan, A. (2015). B cells express-
Jin, L., Xing, R., et al. (2018). Publisher correction: global characterization of     ing IFN-g suppress Treg-cell differentiation and promote autoimmune experi-
T cells in non-small-cell lung cancer by single-cell sequencing. Nat. Med.             mental arthritis. Eur. J. Immunol. 45, 988–998.
24, 1628.                                                                              Oosterling, S.J., van der Bij, G.J., Bögels, M., van der Sijp, J.R., Beelen, R.H.,
Gupta, M., Shin, D.M., Ramakrishna, L., Goussetis, D.J., Platanias, L.C.,              Meijer, S., and van Egmond, M. (2006). Insufficient ability of omental milky
Xiong, H., Morse, H.C., 3rd, and Ozato, K. (2015). IRF8 directs stress-induced         spots to prevent peritoneal tumor outgrowth supports omentectomy in mini-
autophagy in macrophages and promotes clearance of Listeria monocyto-                  mal residual disease. Cancer Immunol. Immunother. 55, 1043–1051.
genes. Nat. Commun. 6, 6379.                                                           Pearce, O.M.T., Delaine-Smith, R.M., Maniati, E., Nichols, S., Wang, J., Böhm,
Hanahan, D., and Folkman, J. (1996). Patterns and emerging mechanisms of               S., Rajeeve, V., Ullah, D., Chakravarty, P., Jones, R.R., et al. (2018). Decon-
the angiogenic switch during tumorigenesis. Cell 86, 353–364.                          struction of a Metastatic Tumor Microenvironment Reveals a Common Matrix
                                                                                       Response in Human Cancers. Cancer Discov. 8, 304–319.
Hu, Z., Artibani, M., Alsaadi, A., Wietek, N., Morotti, M., Shi, T., Zhong, Z., San-
tana Gonzalez, L., El-Sahhar, S., KaramiNejadRanjbar, M., et al. (2020). The           Platell, C., Cooper, D., Papadimitriou, J.M., and Hall, J.C. (2000). The omen-
Repertoire of Serous Ovarian Cancer Non-genetic Heterogeneity Revealed                 tum. World J. Gastroenterol. 6, 169–176.
by Single-Cell Sequencing of Normal Fallopian Tube Epithelial Cells. Cancer            Robertson, D.M., Cahir, N., Burger, H.G., Mamers, P., McCloud, P.I., Petters-
Cell 37, 226–242.e7.                                                                   son, K., and McGuckin, M. (1999). Combined inhibin and CA125 assays in the
Hylander, B., Repasky, E., Shrikant, P., Intengan, M., Beck, A., Driscoll, D.,         detection of ovarian cancer. Clin. Chem. 45, 651–658.
Singhal, P., Lele, S., and Odunsi, K. (2006). Expression of Wilms tumor gene           Santoiemma, P.P., and Powell, D.J., Jr. (2015). Tumor infiltrating lymphocytes
(WT1) in epithelial ovarian cancer. Gynecol. Oncol. 101, 12–17.                        in ovarian cancer. Cancer Biol. Ther. 16, 807–820.

12 Cell Reports 35, 109165, May 25, 2021
ll
Article OPEN ACCESS
Savas, P., Virassamy, B., Ye, C., Salim, A., Mintoff, C.P., Caramia, F., Salgado, Stuart, T., Butler, A., Hoffman, P., Hafemeister, C., Papalexi, E., Mauck, W.M.,
R., Byrne, D.J., Teo, Z.L., Dushyanthen, S., et al. (2018). Single-cell profiling of 3rd, Hao, Y., Stoeckius, M., Smibert, P., and Satija, R. (2019). Comprehensive
breast cancer T cells reveals a tissue-resident memory subset associated with Integration of Single-Cell Data. Cell 177, 1888–1902.e21.
improved prognosis. Nat. Med. 24, 986–993. Testa, U., Castelli, G., and Pelosi, E. (2018). Genetic Abnormalities, Clonal Evo-
Schwede, M., Waldron, L., Mok, S.C., Wei, W., Basunia, A., Merritt, M.A., Mit- lution, and Cancer Stem Cells of Brain Tumors. Med. Sci. (Basel) 6, 85.
siades, C.S., Parmigiani, G., Harrington, D.P., Quackenbush, J., et al. (2020). The Cancer Genome Atlas Research Network (2011). Integrated genomic an-
The Impact of Stroma Admixture on Molecular Subtypes and Prognostic alyses of ovarian carcinoma. Nature 474, 609–615.
Gene Signatures in Serous Ovarian Cancer. Cancer Epidemiol. Biomarkers
Thériault, C., Pinard, M., Comamala, M., Migneault, M., Beaudin, J., Matte, I.,
Prev. 29, 509–519.
Boivin, M., Piché, A., and Rancourt, C. (2011). MUC16 (CA125) regulates
Selewa, A., Dohn, R., Eckart, H., Lozano, S., Xie, B., Gauchat, E., Elorbany, R.,
epithelial ovarian cancer cell growth, tumorigenesis and metastasis. Gynecol.
Rhodes, K., Burnett, J., Gilad, Y., et al. (2019). Systematic Comparison of
Oncol. 121, 434–443.
High-throughput Single-Cell and Single-Nucleus Transcriptomes during Car-
diomyocyte Differentiation. Sci. Rep. 10, 1535. Tirosh, I., Izar, B., Prakadan, S.M, Wadsworth, M.H., 2nd, Treacy, D., Trom-
betta, J.J., Rotem, A., Rodman, C., Lian, C., Murphy, M., et al. (2016). Dissect-
Servet-Delprat, C., Arnaud, S., Jurdic, P., Nataf, S., Grasset, M.F., Soulas, C.,
ing the multicellular ecosystem of metastatic melanoma by single-cell RNA-
Domenget, C., Destaing, O., Rivollier, A., Perret, M., et al. (2002). Flt3+ macro-
seq. Science 352, 189–196.
phage precursors commit sequentially to osteoclasts, dendritic cells and mi-
croglia. BMC Immunol. 3, 15. Tothill, R.W., Tinker, A.V., George, J., Brown, R., Fox, S.B., Lade, S., Johnson,
D.S., Trivett, M.K., Etemadmoghadam, D., Locandro, B., et al.; Australian
Shah, M.M., and Landen, C.N. (2014). Ovarian cancer stem cells: are they real
Ovarian Cancer Study Group (2008). Novel molecular subtypes of serous
and why are they important? Gynecol. Oncol. 132, 483–489.
and endometrioid ovarian cancer linked to clinical outcome. Clin. Cancer
Shah, S., Lowery, E., Braun, R.K., Martin, A., Huang, N., Medina, M., Sethupa- Res. 14, 5198–5208.
thi, P., Seki, Y., Takami, M., Byrne, K., et al. (2012). Cellular basis of tissue
Villani, A.C., Satija, R., Reynolds, G., Sarkizova, S., Shekhar, K., Fletcher, J.,
regeneration by omentum. PLoS ONE 7, e38368.
Griesbeck, M., Butler, A., Zheng, S., Lazo, S., et al. (2017). Single-cell RNA-
Shalek, A.K., Satija, R., Adiconis, X., Gertner, R.S., Gaublomme, J.T., Ray-
seq reveals new types of human blood dendritic cells, monocytes, and pro-
chowdhury, R., Schwartz, S., Yosef, N., Malboeuf, C., Lu, D., et al. (2013). Sin-
genitors. Science 356, eaah4573.
gle-cell transcriptomics reveals bimodality in expression and splicing in im-
mune cells. Nature 498, 236–240. Waltman, L., and Eck, N.J.V. (2013). A smart local moving algorithm for large-
scale modularity-based community detection. Eur. Phys. J. B 86, 471.
Sharma, P., and Allison, J.P. (2015). Immune checkpoint targeting in cancer
therapy: toward combination strategies with curative potential. Cell 161, Wei, W., Mok, S.C., Oliva, E., Kim, S.H., Mohapatra, G., and Birrer, M.J. (2013).
205–214. FGF18 as a prognostic and therapeutic biomarker in ovarian cancer. J. Clin.
Invest. 123, 4435–4448.
Shih, A.J., Menzin, A., Whyte, J., Lovecchio, J., Liew, A., Khalili, H., Bhuiya, T.,
Gregersen, P.K., and Lee, A.T. (2018). Correction: identification of grade and Yao, C., Sun, H.W., Lacey, N.E., Ji, Y., Moseman, E.A., Shih, H.Y., Heuston,
origin specific cell populations in serous epithelial ovarian cancer by single E.F., Kirby, M., Anderson, S., Cheng, J., et al. (2019). Single-cell RNA-seq re-
cell RNA-seq. PLoS ONE 13, e0208778. veals TOX as a key regulator of CD8+ T cell persistence in chronic infection.
Nat. Immunol. 20, 890–901.
Shimotsuma, M., Simpson-Morgan, M.W., Takahashi, T., and Hagiwara, A.
(1992). Activation of omental milky spots and milky spot macrophages by intra- Yuan, A., Hsiao, Y.J., Chen, H.Y., Chen, H.W., Ho, C.C., Chen, Y.Y., Liu, Y.C.,
peritoneal administration of a streptococcal preparation, OK-432. Cancer Res. Hong, T.H., Yu, S.L., Chen, J.J., and Yang, P.C. (2015). Opposite Effects of M1
52, 5400–5402. and M2 Macrophage Subtypes on Lung Cancer Progression. Sci. Rep. 5,
Siddiqui, I., Schaeuble, K., Chennupati, V., Fuertes Marraco, S.A., Calderon- 14273.
Copete, S., Pais Ferreira, D., Carmona, S.J., Scarpellino, L., Gfeller, D., Pra- Zheng, C., Zheng, L., Yoo, J.K., Guo, H., Zhang, Y., Guo, X., Kang, B., Hu, R.,
dervand, S., et al. (2019). Intratumoral Tcf1+PD-1+CD8+ T Cells with Stem- Huang, J.Y., Zhang, Q., et al. (2017a). Landscape of Infiltrating T Cells in Liver
like Properties Promote Tumor Control in Response to Vaccination and Check- Cancer Revealed by Single-Cell Sequencing. Cell 169, 1342–1356.e16.
point Blockade Immunotherapy. Immunity 50, 195–211.e10. Zheng, G.X., Terry, J.M., Belgrader, P., Ryvkin, P., Bent, Z.W., Wilson, R., Zir-
Siegel, R.L., Miller, K.D., and Jemal, A. (2017). Cancer Statistics, 2017. CA aldo, S.B., Wheeler, T.D., McDermott, G.P., Zhu, J., et al. (2017b). Massively
Cancer J. Clin. 67, 7–30. parallel digital transcriptional profiling of single cells. Nat. Commun. 8, 14049.
Cell Reports 35, 109165, May 25, 2021 13ll
OPEN ACCESS Article
STAR+METHODS
KEY RESOURCES TABLE
REAGENT or RESOURCE SOURCE IDENTIFIER
Antibodies
Anti-CD4 Abcam Cat# Ab183685; RRID: AB_2686917
Anti-CD8a Abcam Cat# Ab237709
Anti-CD19 Abcam Cat# Ab227688
Anti-Vimentin Abcam Cat# Ab16700; RRID:AB_443435
Anti-CD45 Agilent Cat# M0701; RRID:AB_2314143
Anti-CD68 Abcam Cat# Ab783; RRID: AB_306119
Anti-CD163 Abcam Cat# Ab74604; RRID: AB_1280790
Anti-Cytokeratin-7 Thermo Scientific Cat# MA5-11986; RRID:AB_10989596
Anti-TOX Thermofisher Cat# PA5-53781; RRID:AB_2648830
Anti-GNLY Abcam Cat# Ab241511; RRID:AB_241511
Biological samples
Human omental tissue University of Chicago IRB18-0099
Human Tissue
Resource Center
Chemicals, peptides, and recombinant proteins
Penicillin-Streptomycin GIBCO Cat# 15140-122
Fetal Bovine Serum ATCC Cat# 302020
DMEM/F12- Dulbecco’s Modified Eagle Medium Thermo Fisher Cat# 11330032
Phosphate Buffered Saline Fisher bioreagents Cat# BP399-500
Formaldehyde solution 4%, buffered pH 6.9 Sigma-Aldrich Cat# 1004969010
Collagenase IV Sigma-Aldrich Cat# C5138
Hyaluronidase Sigma-Aldrich Cat# H3884-500MG
DNase I GoldBio Cat# D-301-100
HBSS Hank’s balanced salt solution Thermo Fisher Cat# 14175-103
Bovine Serum Albumin (BSA) 20 mg/ml New England Biolabs Cat# B9000S
1M DTT Solution Teknova Cat# D9750
10% Sarkosyl Solution Teknova Cat# S3376
20% Ficoll Solution Sigma Cat# F5415-50ML
Ethylenediamine tetraacetate acid (EDTA) 0.5M, pH 8.0 Fisher Cat# BP2482-500
Tris Hydrochloride 1M Solution, pH 7.5 Fisher bioreagents Cat# BP1757-500
Droplet Generation Oil for EvaGreen Bio-Rad Cat# 1864006
20X SSC Molecular Biology Grade Teknova Cat# S0282
Tris-EDTA, 1X Solution pH 8.0 Fisher bioreagents Cat# P2473-1
10% Tween-20 Solution Teknova Cat# T0710
10% SDS Solution Teknova Cat# S0288
Betaine Monohydrate Sigma-Aldrich Cat# 14300-500G
Magnesium Chloride Solution Sigma-Aldrich Cat# M1028-100ML
UltraPure PCR Deoxyncleotide Mix Takara Bio Cat# 639125
NxGen RNase Inhibitor Lucigen Cat# F83923
Maxima H Minus Reverse Transcriptase (200U/uL) Fisher Scientific Cat# EP0751
Exonuclease 1 (20U/uL) New England BioLabs Cat# M0293L
Kapa HiFi HotStart ReadyMix Fisher Cat# NC0465187
Absolute ethanol (200 Proof) Fisher Cat# BP2818-500
SPRI Select Beckman Coulter Cat# B23318
(Continued on next page)
e1 Cell Reports 35, 109165, May 25, 2021ll
Article OPEN ACCESS
Continued
REAGENT or RESOURCE SOURCE IDENTIFIER
UltraPure Distilled Water Invitrogen Cat# 10977-015
Perfluorooctanol Synquest Laboratories Cat# 2101-3-29
PhiX Control V3 Illumina Cat# FC-110-3001
Critical commercial assays
Agilent high sensitivity chip Agilent Cat# 5067-4626
Nextera XT DNA kit Illumina Cat# FC-131-1096
Qubit dsDNA HS Assay kit Thermo Scientific Cat# Q32854
Dead cell removal kit Miltenyi Biotec Cat# 130-090-101
Red blood cell lysis kit Miltenyi Biotec Cat# 130-094-183
Deposited data
Raw fastq and the Gene Expression Omnibus https://www.ncbi.nlm.
processed digital nih.gov/geo/query/acc.
gene expression matrix files cgi?acc=GSE147082
Oligonucleotides
Barcoded beads Chemgenes # CSO-2011 Bead–Linker –TTTTTTTAAGCAG
TGGTATCAACGCAGAGTACJJJ
JJJJJJJJJNNNNNNNNTTTTTT
TTTTTTTTTTTTTTTTTTTTTTTT
Template_Switch_Oligo IDT, HPLC AAGCAGTGGTATCAACG
CAGAGTGAATrGrGrG
TSO_PCR IDT, standard desalting AAGCAGTGGTATCAACGCAGAGT
P5_TSO_Hybrid IDT, HPLC AATGATACGGCGACCA
CCGAGATCTACACGCCTGTCC
GCGGAAGCAGTGGTAT
CAACGCAGAGT*A*C
Nextera_N701 IDT, standard desalting CAAGCAGAAGACGGCAT
ACGAGATTCGCCTTAGT
CTCGTGGGCTCGG
Read 1 Custom Primer IDT, standard desalting GCCTGTCCGCGGAAGCA
GTGGTATCAACGCAGAGTAC
Software and algorithms
GraphPad PRISM https://www.graphpad.com/ Version 8.4.3
Aperio Imagescope https://www.leicabiosystems.com NA
Seurat https://satijalab.org/seurat/ Version 3.1.4
R https://www.r-project.org/ Version 3.6.1
dmatch https://qzhan321.github.io/dmatch/ Version 0.1.8
RESOURCE AVAILABILITY
Lead contact
Further information and requests for resources and reagents should be directed to and will be fulfilled by the lead contact, Anindita
Basu (onibasu@uchicago.com)
Materials availability
This study did not generate new unique reagents.
Data and code availability
The single cell dataset generated during this study have been deposited to Gene Expression Omnibus (GEO) repository (https://www.
ncbi.nlm.nih.gov/geo/) with the dataset identifiers GSE147082.
Cell Reports 35, 109165, May 25, 2021 e2ll
OPEN ACCESS Article
EXPERIMENTAL MODEL AND SUBJECT DETAILS
Ovarian cancer tissue was collected from women undergoing debulking surgery at the University of Chicago Medical Center. Human
tissue acquisition after patient deidentification was approved by the University of Chicago Institutional Review Board for research.
Ovarian cancer tissue was histologically classified and staged by a pathologist according to tumor-node-metastasis (TMN) and/or
International Federation of Gynecology and Obstetrics (FIGO) classifications (Table 1).
METHOD DETAILS
Immunohistochemistry
Ovarian cancer tissues obtained fresh from surgery were fixed overnight in 4% formaldehyde at 4 C. After serial dehydration,
the tissues were embedded in paraffin and cut into 5 mm thick sections. Histological evaluation was done with hematoxylin and
eosin (H&E). Immunohistochemical staining was performed to confirm the presence of cytokeratin-7 (Thermo Scientific), TOX
(Thermofisher), pan-vimentin (DAKO), CD45 (Agilent), CD4, CD8a, CD68, CD163, CD19 and GNLY (Abcam) positive cells. Briefly,
sections were deparaffinized and rehydrated using xylene and serial dilutions of EtOH in distilled water. Tissue sections were incu-
bated in citrate buffer, pH 6 and heated in a microwave oven. Anti-cytokeratin-7 (1:1000), anti-vimentin (1:100), anti-CD45 (1:100),
anti-CD4 (1:50), anti-CD19 (1:200), anti-CD8 (1:400), anti-TOX (1:200), anti-CD163 (1:2), anti-CD68 (1:40) and anti-GNLY (1:2000)
antibodies were applied on tissue sections for one-hour incubation at room temperature in a humidity-controlled chamber. The
antigen-antibody bindings were detected with labeled polymer-HRP Envision system (DAKO, K4007) and DAB+ chromogen
(DAKO, K3468) system. Tissue sections were briefly immersed in hematoxylin for counterstaining and covered with cover glasses.
We used Imagescope, a digital histopathology software, to annotate and quantify the H&E and IHC staining.
Tissue digestion, red blood cell lysis and dead cell removal
Ovarian tumors were transported in DMEM/F12 containing 10% FBS and 1% P/S (10% DMEMF/12) on ice to the laboratory. The
tissue was minced manually with a scalpel and enzymatically digested using 1.5 mg/ml collagenase IV (Sigma-Aldrich), 1 mg/ml hy-
aluronidase (Sigma-Aldrich) and 500 mg/ml DNase I (GoldBio) in Hank’s balanced salt solution (HBSS) in a 37 C shaker (200 rpm) for
0.5 – 2 h. Following digestion, adipocytes were separated from the stromal vascular fraction (SVF) by centrifugation and discarded.
Note that the size and density of adipocytes make them unamenable to droplet based single-cell RNA-seq. SVF cells were resus-
pended in 10% DMEMF/12 and filtered serially through 70 mm and 40 mm strainers. Red blood cells were lysed by incubating the
cell pellet in RBC lysis buffer (Miltenyi Biotec, 130-094-183) for 2 minutes. Lysis was quenched by adding excess 10% DMEMF/
12. The number of live cells was enriched using the dead cell removal kit (Miltenyi Biotec, 130-090-101) according to manufacturer’s
instructions.
Drop-seq experiments
Drop-seq experiments were performed as previously described (Macosko et al., 2015). Briefly, cells were loaded at a concentration
of 100,000 cells/ml in PBS and 0.01% BSA (NEB, #B9000S) and the barcoded beads (Chemgenes) at 120,000 beads/ml were loaded
in Drop-seq lysis buffer consisting of 0.2% Sarkosyl (Teknova, #S3376), 6% Ficoll (Sigma, #F5415-50ml), 0.02 M EDTA (Fisher,
#BP2482-500), 0.2 M Tris-HCl pH7.5 (Fisher, #BP1757-500), and 0.05 M DTT (Teknova, #D9750) in water (Invitrogen, #10977-
015). Droplets were generated using a 125-micron Drop-seq microfluidic device and inert oil-surfactant mix (BioRad, #1864006)
at 16 mL/hr (oil), 4 mL/hr (cells) and 4 mL/hr (beads) with 15 minutes per collection. Following collection, drops were broken in
50 mL conical tubes using perfluorooctanol (Synquest, #2101-3-20) and spin down at 1000 xg for 1 min. Barcoded beads with
mRNA hybridized onto them were collected from the oil-water interface using a 1 mL pipette and transferred to a fresh 50 mL conical
tube. The mRNA-bound barcode beads were washed three times in 30 mL of 6x Saline-Sodium Citrate solution (Teknova, #S0282),
transferred to a 1.5 mL centrifuge tube and washed once in 500 mL of 1x Maxima H- RT buffer (Thermo, #EP0751). Reverse transcrip-
tion (RT) was performed on the beads in a modified RT recipe consisting of 1x Maxima H- RT buffer, 4% Ficoll PM-400 (GE Health-
care, #17-0300-05), 3 mM MgCl2 (Sigma, #M1028), 1 mM Betaine (Sigma, #14300), 1 mM dNTP (Clontech, #639125), 1 U/mL RNase
Inhibitor (Lucigen, #F83923), 2.5 mM Template-Switching Oligo (TSO) primer: AAGCAGTGGTATCAACGCAGAGTGAATrGrGrG (IDT),
and 10 U/mL Maxima H- RT enzyme (Thermo, #EP0751) in a total volume of 200 mL. RT was performed by a 30-minute incubation at
room temperature, followed by a 90-minute incubation at 50 C, both under end-over-end rotation.
Barcoded cDNA attached to the beads or STAMPs were generated by reverse transcription were thoroughly washed (in 0.5% SDS
and 0.02% Tween 20 each in Tris-EDTA buffer), treated with 1 U/mL exonuclease I (Fisher, #M0293L), rewashed and the number of
STAMPs was counted. 5000 STAMPs were aliquoted per well in a 96-well plate and the cDNA attached to the STAMPs were amplified
through 14 PCR cycles using 1x Kapa Hifi Hotstart Mastermix (Fisher, #NC0465187) and 2.5 mM PCR primer: AAGCAGTGGTAT
CAACGCAGAGT (IDT). Supernatant from each well was pooled and cleaned with 0.6X Ampure beads. Purified cDNA was quantified
using Qubit 3.0 (Invitrogen). 450-650 pg of each sample with standard Nextera P7 primer and custom P5-TSO hybrid oligo: AATGA
TACGGCGACCACCGAGATCTACACGCCTGTCCGCGGAAGCAGTGGTATCAACGCAGAGT*A*C and were used as input for Nex-
tera library preparation (12 PCR cycles; Illumina, #FC-131-1096). Tagmented libraries were quantified using Agilent BioAnalyzer
High Sensitivity chip before submission for sequencing on Illumina’s NextSeq 500, using 75 cycle v3 kits. Paired end sequencing
e3 Cell Reports 35, 109165, May 25, 2021You can also read