Channel Capacity Report 2022 Restoration Year - Technical Memorandum Public Draft
←
→
Page content transcription
If your browser does not render page correctly, please read the page content below
Technical Memorandum

Public Draft
Channel Capacity Report
2022 Restoration Year

                       Channel Capacity Report, 2022 Restoration Year
San Joaquin River Restoration Program

 1   Table of Contents
 2   1.0   Executive Summary ............................................................................................................. 1
 3   2.0   Introduction .......................................................................................................................... 3
 4   3.0   Completed Channel Capacity Studies and Related Work ............................................... 5
 5         3.1 Levee Capacity Update in the Middle Eastside Bypass .............................................................. 5
6          3.2 Bank Erosion Monitoring Report ................................................................................................. 8
 7   4.0   Recommended Then-existing Channel Capacities.......................................................... 12
 8   5.0   Program Actions ................................................................................................................ 15
 9   6.0   Future Program Studies and Monitoring ........................................................................ 15
10   7.0   References ........................................................................................................................... 18
11   Tables
12        Table ES-1. Current and Recommended Then-existing Channel Capacity…..……...….ES-2
13        Table 3-1. Results for Levee Capacity in Middle Eastside Bypass....................................…6
14        Table 3-2. Top 8 of 50 Sites with Detected Erosion…………….…..…....….….....….…...12
15        Table 4-1. Current and Recommended Then-existing Channel Capacity..........……………14

16   Figures

17         Figure 3-1. Middle Eastside Bypass Reaches with Levee Channel Capacities Less than
18              4,500 cfs …………......…………………………………………………………….…7
19         Figure 3-2. Example of a high threat erosion site in Reach 5……....………...……………10
20         Figure 3-3. San Joaquin River Hydrograph……………………..…………………………11
21   Appendices
22         Appendix A – PEIS/R Text Related to Channel Capacity
23         Appendix B – 2020 Levee Capacity Update in the Middle Eastside Bypass
24         Appendix C – Bank Erosion Monitoring Report
25

     Technical Memorandum                                                                                                         Public Draft
     Channel Capacity Report, 2022 Restoration Year                                                                          ii –October 2021
San Joaquin River Restoration Program

 1   List of Abbreviations and Acronyms
 2                    CCAG                 Channel Capacity Advisory Group
 3                    CCR                  Channel Capacity Report
 4                    CFS                  Cubic feet per second
 5                    CVFPB                Central Valley Flood Protection Board
 6                    DWR                  Department of Water Resources
 7                    GCR                  Geotechnical Conditions Report
 8                    LiDAR                Light Detecting And Ranging
 9                    LSJLD                Lower San Joaquin Levee District
10                    LSJRFC Project       Lower San Joaquin River Flood Control Project
11                    MNWR                 Merced National Wildlife Refuge
12                    NRDC                 Natural Resources Defense Council
13                    NOD                  Notice of Determination
14                    PEIS/R               Program Environmental Impact Statement/Environmental
15                                         Impact Report
16                    Reclamation          Bureau of Reclamation
17                    Restoration Area     San Joaquin River Restoration Program Restoration Area
18                    RM                   River mile
19                    ROD                  Record of Decision
20                    SJLE Project         San Joaquin Levee Evaluation Project
21                    SJRRP                San Joaquin River Restoration Program
22                    WSE                  Water Surface Elevation

     Technical Memorandum                                                                  Public Draft
     Channel Capacity Report, 2022 Restoration Year                                  iii –October 2021
San Joaquin River Restoration Program

 1   Definitions
 2   San Joaquin River Restoration Program (SJRRP): The SJRRP (also abbreviated as Program)
 3   was established in late 2006 to restore and maintain fish populations in good condition in the
 4   mainstem of the San Joaquin River (SJR) below Friant Dam to the confluence of the Merced
 5   River, while reducing or avoiding adverse water supply impacts.
 6
 7   Settlement: In 2006, the SJRRP was established to implement the Stipulation of Settlement in
 8   NRDC, et al., v. Kirk Rodgers, et al.
 9
10   Program Environmental Impact Statement/Environmental Impact Report (PEIS/R): The
11   Bureau of Reclamation (Reclamation), as the federal lead agency under the National
12   Environmental Policy Act (NEPA) and the California Department of Water Resources (DWR),
13   the state lead agency under the California Environmental Quality Act (CEQA), jointly prepared a
14   Program Environmental Impact Statement/Report (PEIS/R) and signed a Record of Decision and
15   Notice of Determination (ROD and NOD), respectively, in 2012 to implement the Settlement.
16
17   Channel Capacity Advisory Group (CCAG): The Channel Capacity Advisory Group provides
18   focused input to Reclamation’s determination of “then-existing channel capacity” within the
19   Restoration Area.
20
21   Then-existing channel capacity: The channel capacity within the Restoration Area that
22   correspond to flows that would not significantly increase flood risk from Restoration Flows in
23   the Restoration Area. This annual report will recommend updating then-existing channel
24   capacity based on recently completed evaluations.
25
26   In-channel capacity: The channel capacity at which the water surface elevation is maintained at
27   or below the elevation of the outside ground (i.e., along the landside levee toe).
28

     Technical Memorandum                                                                  Public Draft
     Channel Capacity Report, 2022 Restoration Year                                   iv –October 2021
San Joaquin River Restoration Program
1 1.0 Executive Summary
2 The San Joaquin River Restoration Program (SJRRP) was established in late 2006 and is a
3 comprehensive, long-term effort to restore flows to the San Joaquin River from Friant Dam to
4 the confluence of the Merced River and restore a self-sustaining Chinook salmon fishery in the
5 river while reducing or avoiding adverse water supply impacts. The first water releases from
6 Friant Dam in support of the SJRRP, called Interim Flows, began October 1, 2009, which later
7 became Restoration Flows beginning on January 1, 2014. The SJRRP has committed to reporting
8 annually the upper limit of Restoration Flows that will not significantly increase flood risk within
9 the Restoration Area. This Channel Capacity Report (CCR) is for the 2022 Restoration Year and
10 is part of a series of annual reports required to fulfill a commitment in the SJRRP’s
11 environmental document.
12 To determine the upper limit of Restoration Flows that can be conveyed in each channel, the
13 SJRRP has completed comprehensive evaluations of over 60 miles of levees which include a
14 drilling program and seepage and stability modeling to evaluate the risk of levee failure. For
15 those levees that have not been evaluated, the SJRRP keeps Restoration Flows within the
16 channel to prevent water on the levee itself which also reduces the risk of a levee failure. The
17 CCR details the channel capacities within the Restoration Area that correspond to flows that
18 would not significantly increase flood risk from Restoration Flows based on levee capacity,
19 which is referred to as “then-existing” channel capacity.
20 In the 2022 CCR, a recommended capacity change was made in the Middle Eastside Bypass to
21 consider the recently improved two miles of right levee in the Middle Eastside Bypass. The 2022
22 CCR also includes summaries describing the basis for the change in then-existing channel
23 capacity in the Middle Eastside Bypass, and a bank erosion monitoring report that will help the
24 SJRRP identify locations where erosion occurs and may cause impacts. The 2022 CCR also
25 provides updates on projects related to channel capacity, and upcoming studies and monitoring
26 that may be considered in updating channel capacities in future CCRs.
27 The previous and recommended then-existing channel capacities in the San Joaquin River and
28 flood bypasses are shown in Table ES-1. A complete discussion of the data and analysis
29 conducted to determine previous then-existing channel capacities can be found on the SJRRP
30 website:
31
32 http://www.restoresjr.net/restoration-flows/levee-stability-channel-capacity/
33
34
DRAFT Technical Memorandum Administrative Draft
Channel Capacity Report, 2022 Restoration Year ES-1 –September 2021San Joaquin River Restoration Program
1 Table ES-1.
2 Current and Recommended Then-existing Channel Capacity
Reach Current Then-existing Recommended Then-existing
Channel Capacity (cfs)1 Channel Capacity (cfs)1
Reach 2A 6,0002 6,0002
Reach 2B 1,210 1,210
Reach 3 2,8603 2,8603
Reach 4A 2,8404 2,8404
Reach 4B1 Not Analyzed Not Analyzed
Reach 4B2 4,300 4,300
Reach 5 2,350 2,350
Middle Eastside Bypass 1,070 2,600
Lower Eastside Bypass 2,890 2,890
Mariposa Bypass 1,800 1,800
3 1
Then-existing channel capacity shown in this table is based on levee stability only and does not consider Restoration Flow
4 limitations related to agricultural seepage.
5 2
Capacity not assessed for flows greater than 6,000 cfs. Restoration Flows are limited to approximately 2,140 cfs due to
6 agricultural seepage.
7 3
Restoration Flows are limited to approximately 720 cfs due to agricultural seepage.
8 4
Restoration Flows are limited to approximately 300 cfs due to agricultural seepage.
9
10
11
DRAFT Technical Memorandum Administrative Draft
Channel Capacity Report, 2022 Restoration Year ES-2 –September 2021San Joaquin River Restoration Program
1 2.0 Introduction
2 The San Joaquin River Restoration Program (SJRRP) was established in late 2006 to implement
3 a Stipulation of Settlement (Settlement) in NRDC, et al., v. Kirk Rodgers, et al. The U.S.
4 Department of the Interior, Bureau of Reclamation (Reclamation), the Federal lead agency under
5 the National Environmental Policy Act (NEPA), and the California Department of Water
6 Resources (DWR), the State lead agency under the California Environmental Quality Act
7 (CEQA), prepared a joint Program Environmental Impact Statement/Report (PEIS/R) to support
8 implementation of the Settlement. The Settlement calls for releases of Restoration Flows, which
9 were initiated in 2014 and are specific volumes of water to be released from Friant Dam during
10 different water year types, according to Exhibit B of the Settlement. Federal authorization for
11 implementing the Settlement is provided in the San Joaquin River Restoration Settlement Act
12 (Act) (Public Law 111-11). Reclamation signed the Record of Decision (ROD) on September 28,
13 2012. The PEIS/R and ROD committed to establishing a Channel Capacity Advisory Group
14 (CCAG) and determining and updating estimates of then-existing channel capacities as needed as
15 well as maintaining Restoration Flows at or below estimates of then-existing channel capacities.
16 Then-existing channel capacities in the Restoration Area (the San Joaquin River between Friant
17 Dam and the confluence of the Merced River) correspond to flows that would not significantly
18 increase flood risk from Restoration Flows. Sections of the PEIS/R applicable to the CCAG are
19 included in Appendix A of this report.
20 Then-existing channel capacities in the Restoration Area were determined for: Reach 2A, Reach
21 2B, Reach 3, Reach 4A, Reach 4B1, Reach 4B2, and Reach 5 of the San Joaquin River and the
22 flood bypasses. A Restoration Area map can be found on the SJRRP website:
23 http://www.restoresjr.net/wp-content/uploads/2020/11/20130325_SJRRPreaches--scaled.jpg
24
25 This Channel Capacity Report (CCR) for the 2022 Restoration Year (2022 CCR) is an annual
26 report required to fulfill the commitments in the ROD. For the 2022 Restoration Year, the
27 SJRRP is recommending an increase in then-existing channel capacity in the Middle Eastside
28 Bypass that considers the recent reinforcing of two miles of levee within the Eastside Bypass
29 (Reach O levee improvements). Then-existing channel capacities for other reaches in the
30 Restoration Area remain unchanged from the 2021 CCR. The 2022 CCR also includes a
31 summary of a bank erosion monitoring report that was completed in 2021 to help meet the need
32 identified in the PEIS/R to closely monitor erosion and avoid erosion-related impacts. The CCR
33 also includes a summary of studies and monitoring that will be completed the following year.
34 Previous CCRs include more information regarding CCAG roles and responsibilities, technical
35 factors when considering channel capacity, the criteria and evaluation process for determining
36 capacity, as well as the data and analytical tools used to determine channel capacity.
37 Previous CCRs can be found at the SJRRP website:
38 http://www.restoresjr.net/restoration-flows/levee-stability-channel-capacity/
Draft Technical Memorandum Public Draft
Channel Capacity Report, 2022 Restoration Year 3 –October 2021San Joaquin River Restoration Program
1 The 2022 CCR will be available for a 60-day public review and comment period beginning on
2 October 18, 2021. Comments are due on December 17, 2021 to Reclamation and DWR and may
3 be mailed (hard copy or electronic) to the following:
4 Alexis R. Phillips-Dowell, Senior Engineer
5 Department of Water Resources, South Central Region Office
6 3374 East Shields Avenue
7 Fresno, CA 93726
8 Alexis.Phillips-Dowell@water.ca.gov
9
10 OR
11
12 Regina Story, Civil Engineer
13 Bureau of Reclamation, San Joaquin River Restoration Program
14 2800 Cottage Way, W-1727
15 Sacramento, CA 95825
16 rstory@usbr.gov
Draft Technical Memorandum Public Draft
Channel Capacity Report, 2022 Restoration Year 4 –October 2021San Joaquin River Restoration Program
1 3.0 Completed Channel Capacity Studies and Related
2 Work
3 The following sections summarize new technical studies and related work that have been
4 completed at the time of publication of this report. This year’s report includes summaries for two
5 separate efforts. The first is a levee capacity update in the Middle Eastside Bypass to consider
6 the Reach O levee improvements, updated topography, and subsidence. The second is a bank
7 erosion monitoring report that includes the initial step in developing a methodology to define and
8 monitor critical erosion sites within the Restoration Area.
9 3.1 Levee Capacity Update in the Middle Eastside Bypass
10 The San Joaquin Levee Evaluation (SJLE) Project assists the SJRRP in assessing flood risks
11 associated with the release of Restoration Flows as it relates to levee seepage and stability. In
12 2015, DWR completed a Geotechnical Condition Report (GCR) that evaluated the Middle
13 Eastside Bypass levees based on geotechnical data collected from a series of borings. Using
14 seepage and stability models, the GCR identified the maximum allowable water surface
15 elevation (WSE) “that can be placed on the waterside levee slopes without exceeding
16 geotechnical criteria for stability and seepage” (URS, 2015). The GCR further split the Middle
17 Eastside Bypass into reaches based on the levee’s geotechnical characteristics.
18 DWR then completed a hydraulic study that evaluated the levee capacity of the Middle Eastside
19 Bypass (Tetra Tech, 2015) using the maximum allowable WSE. The study identified a two-mile
20 section of levee (Reach O) in the Middle Eastside Bypass that needed improvement for the
21 SJRRP to meet its Stage 1 of the Funding Constrained Framework objective of 2,500 cfs
22 channel capacity to convey Restoration Flows (SJRRP, 2018).
23 DWR completed the Reach O levee improvements in 2020 and subsequently performed a
24 hydraulic study that estimates a new channel capacity considering these improvements, recent
25 subsidence and topography, and geotechnical data. The study, 2020 Levee Capacity Update in
26 the Middle Eastside Bypass, dated August 2021, is included in Appendix B and is summarized
27 below.
28 3.1.1 Model Development
29 The study was conducted using validated 1-D steady state Hydrologic Engineering Center’s
30 River Analysis System (HEC-RAS) model of the Middle Eastside Bypass. The model geometry
31 is based on 2015 light detecting and ranging (LiDAR) that was further updated based on
32 subsidence that occurred between 2015 and 2020. In updating the model geometry for
33 subsidence, the 2015 cross-section elevations were adjusted by the total subsidence that was
34 measured between the 2015 LiDAR and the 2019 top of levee surveys completed by DWR. The
35 model geometry was further modified to reflect subsidence from 2019 to 2020 using
36 Reclamation’s bi-annual surveys. The maximum allowable WSE from the GCR were also
Draft Technical Memorandum Public Draft
Channel Capacity Report, 2022 Restoration Year 5 –October 2021San Joaquin River Restoration Program
1 adjusted to reflect subsidence through 2020. The total subsidence adjustment from 2015 to 2020
2 ranged from 0.5 ft to 2 ft depending on the location along the Middle Eastside Bypass. The
3 average subsidence for the reach was 1.0 ft.
4 3.1.2 Analysis and Results
5 The hydraulic model was used to compute the WSEs for a range of flows up to 4,500 cfs, the
6 maximum Restoration Flow capacity. The computed water-surface profiles in the Middle
7 Eastside Bypass were compared to the maximum allowable WSEs for each reach. Table 3-1
8 summarizes the maximum allowable WSEs, for each of the GCR reaches and station shown in
9 Figure 3-1, as well as the corresponding levee capacity.
10 Table 3-1.
11 Results for Levee Capacity in the Middle Eastside Bypass
Maximum
GCR Reach Station (ft) Levee Capacity (cfs)
Allowable WSE (ft)
A 102000 97.7 >4,500
B 106500 103.8 >4,500
C 111000 97.1 4,000
D 116400 99.1 4,500
E 136100 102.0 >4,500
F 144600 101.0 4,250
J 106000 94.4 3,700
K 111830 99.1 >4,500
L1 116800 98.0 2,600
L2 124500 99.7 4,050
M 126500 103.8 >4,500
N 134500 100.9 >4,500
O 140500 N/A1 >4,500
12 1
Not Applicable: The Reach O levee improvement project did not evaluate a maximum water surface elevation, only evaluated the
13 stability of the reach at 4,500 cfs after 25-years of subsidence.
14
15 Prior to the improvements of Reach O, the then-existing channel capacity for the Middle
16 Eastside Bypass was 1,070 cfs (Tetra Tech, 2015). The recent Middle Eastside Bypass
17 improvements increased Reach O capacity to greater than 4,500 cfs; however, the limiting
18 capacity is now 2,600 cfs for Reach L1, the downstream mile of Reach L. Figure 3-1 identifies
19 the reaches in red that exceed the maximum allowable WSE and therefore exceed the USACE
20 criteria for seepage and stability at flows greater than 4,500 cfs. In total, there are about 6.5 miles
21 of remaining levee within the Middle Eastside Bypass with a levee capacity of less than 4,500
22 cfs.
Draft Technical Memorandum Public Draft
Channel Capacity Report, 2022 Restoration Year 6 –October 2021San Joaquin River Restoration Program
2 Figure 3-1.
3 Middle Eastside Bypass Reaches with Levee Channel Capacities Less than 4,500 cfs
Draft Technical Memorandum Public Draft
Channel Capacity Report, 2022 Restoration Year 7 –October 2021San Joaquin River Restoration Program
1 3.1.3 Conclusion
2 The results of this hydraulic analysis show that capacities through the Middle Eastside Bypass
3 equal to or greater than 2,600 cfs. However, because subsidence continues, the capacity will
4 continue to be reduced over time. The SJRRP will need to determine if additional reaches will
5 need improvement over the next several years to maintain capacity for the Stage 1 objective of
6 2,500 cfs by 2024. Reach L, as well as other reaches, will be evaluated periodically to determine
7 if improvements will be needed over the next five to ten years.
8 3.2 Bank Erosion Monitoring Report
9 The PEIS/R described the need to “closely monitor erosion and perform maintenance and/or
10 reduce Interim or Restoration Flows as necessary to avoid erosion-related impacts” (SJRRP,
11 2012b). DWR is taking the lead to monitor bank erosion within the Restoration Area. The goal of
12 the monitoring effort is to identify the locations where erosion occurs and where there are threats
13 of erosion-related impacts. The effort can also be developed to identify causal mechanisms of
14 erosion at critical erosion sites. The results of the monitoring will assist the SJRRP with the
15 erosion monitoring and reporting that is in the PEIS/R and allow for the development of advance
16 measures to reduce erosion attributed to Restoration Flows. The Bank Erosion Monitoring
17 Report, which is included in Appendix C, describes the initial step in monitoring. This includes
18 developing a methodology to define critical erosion sites, and to develop a baseline for erosion
19 for future evaluations. A summary of the methodology, as well as initial identification of the
20 critical erosion sites are described below.
Draft Technical Memorandum Administrative Draft
Channel Capacity Report, 2022 Restoration Year 8 –August 2021San Joaquin River Restoration Program
1 3.2.1 Methodology
2 DWR used aerial imagery from 2015 and 2017 to identify locations of bank erosion and provide
3 baseline conditions for all future evaluations. DWR also identified the flow release types within
4 this two-year period to provide an understanding of the source of erosion. During this period,
5 flow releases included riparian flows, Restoration Flows, San Joaquin River Exchange
6 Contractor flows, and a significant flood flow release. In all, DWR evaluated 268 locations along
7 the San Joaquin River and flood bypass system for the presence of erosion, some of which were
8 previously located in other bank erosion studies (Tetra Tech, 2010; SJRRP, 2017). Results of this
9 study identify vulnerable areas where monitoring for erosion should be continued.
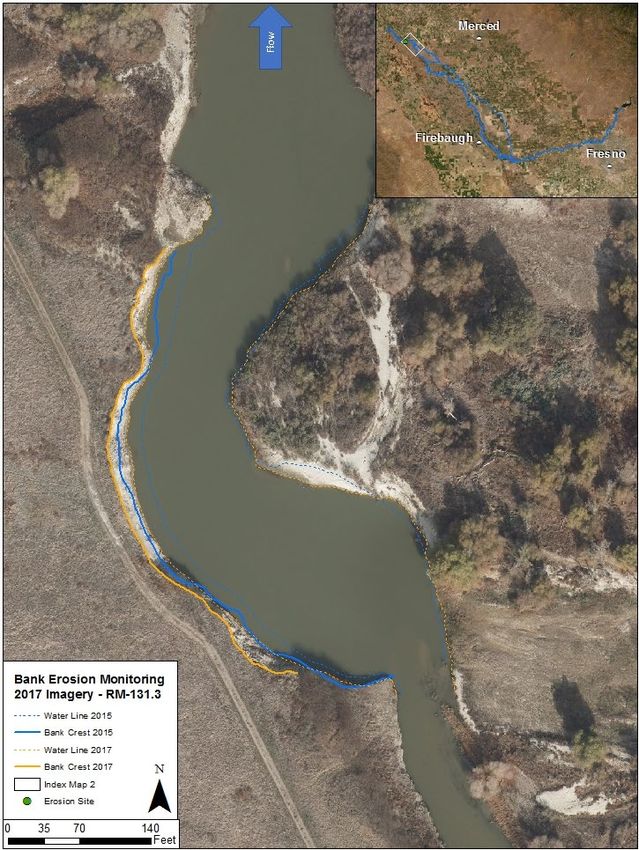
10 A remote sensing method was used to identify recent bank erosion that may be threatening levee
11 stability, flow conveyance, infrastructure, or property. Using high-resolution aerial imagery,
12 DWR evaluated bank erosion by delineating channel boundary features to compare spatially and
13 temporally. In general, the method of delineation is the process of outlining the bank crest or
14 waterlines on aerial photographs taken at different times and then comparing. Aerial
15 photography surveys of all SJRRP reaches were performed on February 24 - 26, 2015, and
16 December 7, 2017.
17 To quantify the threat from erosion at each site identified by bank delineation, DWR developed a
18 threat classification to quantify the risk of erosion to human-made structures within the study
19 area. A threat ratio was used that divides the distance to the nearest structure by the distance of
20 lateral erosion measured between the photoset dates (in this case, between 2015 and 2017). A
21 smaller threat-ratio value corresponds to a more significant threat from erosion at that site. Sites
22 with threat ratios lower than 3.0 were determined as critical and designated as a high threat. This
23 is based on the prediction that it could take 3 or fewer similar erosion events to cause damage to
24 the nearest structure. A threat ratio of 0.0 signifies that erosion is already present within a
25 structure. Sites that showed erosion but had a threat ratio between 3 and 10 were designated as a
26 medium threat. The sites that showed no perceptible erosion between 2015 and 2017 were
27 designated as a low threat. An example of a high threat from Reach 5 is shown in Figure 3-2. It is
28 a high threat because it has a threat ratio of 0.0 indicating that erosion has already occurred into a
29 structure. In this example, Figure 3-2 shows the river encroaching into a levee where an access
30 road veers away from the eroding bank escarpment.
Draft Technical Memorandum Public Draft
Channel Capacity Report, 2022 Restoration Year 9 –October 2021San Joaquin River Restoration Program
1 Figure 3-2.
2 Example of a high threat erosion site in Reach 5
3
4 Flow types were also identified to provide a basis for understanding the relative flow magnitudes
5 and durations present between the aerial photoset dates. This assessment can be used to help
6 inform attributing factors for any erosion-related impacts. DWR identified the timing of
Draft Technical Memorandum Public Draft
Channel Capacity Report, 2022 Restoration Year 10 –October 2021San Joaquin River Restoration Program
1 Restoration Flows, San Joaquin River Exchange Contractor deliveries, and flood flows between
2 January 1, 2015, and January 1, 2018. Flow-type release intervals and total discharge were
3 compared at two stream gauges: San Joaquin River below Friant (SJF) and San Joaquin River
4 near Dos Palos (SDP). The timing of each of these flows and aerial imagery dates are shown in
5 Figure 3-3. The timing, magnitude, and duration of flows within the hydrograph indicate energy
6 changes within the river, which can affect bank stability. Figure 3-3 illustrates the river flow
7 variability within the period when erosion occurred and can be used to understand how the river
8 channel responds to this flow regime.
10 Figure 3-3.
11 San Joaquin River Hydrograph
12 3.2.2 Results
13 After delineating each of the 268 sites, DWR determined that 50 sites show signs of erosion. Of
14 these 50 sites, eight exhibited the highest risk to infrastructure based on a threat ratio below 3.0.
15 This threat ratio is based on the prediction that it could take 3 or fewer erosion events to cause
16 damage to the nearest structure if conditions are similar. Two of the eroding sites: RM 258.5
17 (Reach 1A) and RM 131.3 (Reach 5) are currently experiencing erosion into a nearby structure
18 and have a threat ratio of 0.0. All eight of the high threat classification sites are located in the
Draft Technical Memorandum Public Draft
Channel Capacity Report, 2022 Restoration Year 11 –October 2021San Joaquin River Restoration Program
1 main stem of the San Joaquin River. There are also 22 medium threat sites that have a threat ratio
2 of between 3.0 and 10.0. The high threat sites are listed in Table 3-2. This study did not
3 determine the cause of erosion at these sites. Erosion sites are identified by reach.
4 Table 3-2.
5 Top 8 of 50 Sites with Detected Erosion
Distance
Lateral
San Joaquin Threat from Threat
Erosion
River Reach Level Structure Ratio
(feet)
(feet)
1A High 10 0 0.0
5 High 11 0 0.0
3 High 55 3 0.1
2A High 140 45 0.3
1A High 55 85 1.5
3 High 20 33 1.6
3 High 12 24 2.0
2A High 37 75 2.0
6 3.2.3 Conclusion
7 Based on the imagery included in this report, the erosion shown is most likely a response to flood
8 flows occurring between January and July 2017. It is less likely that Restoration Flows caused
9 erosion because those average daily discharges were small in comparison to the flood flows.
10 DWR recommends implementing a long-term erosion monitoring plan that would evaluate the
11 causal mechanisms by reach throughout the Restoration Area to reduce or avoid erosion-related
12 Restoration Flow impacts in the Restoration Area. This plan would apply the methods outlined in
13 this study by using remote sensing technology to monitor and detect erosion. When deemed
14 necessary, future studies may include separate investigations of the processes and flow schedules
15 that cause bank erosion. To continue delineation of aerial imagery and implement long-term
16 monitoring, a list of necessary actions are provided in the report in Appendix C and include:
17 prioritization of monitoring locations and alternative monitoring methods; determination of
18 monitoring and imagery frequency and timing; erosion response development; additional flow
19 evaluations; and a communication development system. Finally, continued monitoring is
20 recommended for the high threat sites identified in this study.
21 4.0 Recommended Then-existing Channel Capacities
22 To determine the upper limit of Restoration Flows that can be conveyed in each channel, the
23 SJRRP has completed comprehensive evaluations of over 60 miles of levees which include a
Draft Technical Memorandum Public Draft
Channel Capacity Report, 2022 Restoration Year 12 –October 2021San Joaquin River Restoration Program
1 drilling program and seepage and stability modeling to evaluate the risk of levee failure. For
2 those levees that have not been evaluated, the SJRRP keeps Restoration Flows within the
3 channel (in-channel) to prevent water on the levee itself which also reduces the risk of a levee
4 failure. This summary provides the upper limit of Restoration Flows, which is referred to as
5 “then-existing” channel capacity that can be conveyed in each reach based on levee capacity.
6 Then-existing channel capacities in the Restoration Area are identified for the following reaches:
7 Reach 2A, Reach 2B, Reach 3, Reach 4A, Reach 4B1, Reach 4B2, and Reach 5 of the San
8 Joaquin River and the Eastside Bypass flood bypasses.
9 This year’s CCR recommends a change to the 2021 then-existing channel capacity in the Middle
10 Eastside Bypass only. The remainder of the reaches will remain the same as those recommended
11 in the 2020 and 2021 CCRs. A summary of how then-existing channel capacity was determined
12 for each reach is described below based on whether geotechnical data was used or if Restoration
13 Flows are to remain in-channel (the water surface elevation in the river remains below the
14 levees). A complete discussion of the data and analysis conducted to determine previous then-
15 existing channel capacities can be found in the previous CCRs on the SJRRP website:
16
17 http://www.restoresjr.net/restoration-flows/levee-stability-channel-capacity/
18
19 For Reach 2A, the lower 2.5 miles of Reach 4A, Reach 4B2, Middle Eastside Bypass and
20 Mariposa Bypass adequate data was available to perform a geotechnical analysis and these
21 results were used to determine then-existing channel capacity. The study details used to
22 determine the then-existing channel capacity for Reach 2A, and the lower 2.5 miles of Reach 4A
23 are included in the 2018 CCR. The study details used to determine the then-existing channel
24 capacity for Reach 4B2 and the Mariposa Bypass are included in the 2020 CCR. For the Middle
25 Eastside Bypass, then-existing capacity was determined in the 2018 CCR, which was updated in
26 the 2020 CCR to consider the removal of the boards in the weirs in the Merced National Wildlife
27 Refuge. Based on the study described in Section 3.1, the 2022 CCR is recommending an
28 additional increase in then-existing channel capacity in this reach from the 1,070 cfs to 2,600 cfs.
29 The increase considers the Reach O levee improvements, as well as the geotechnical data and
30 subsidence to 2020. Then-existing channel capacity in this reach is now based on the capacity of
31 GCR Reach L.
32 In-channel capacities were the best estimate of then-existing channel capacities for Reach 2B,
33 Reach 3, portions of Reach 4A, Reach 5, and Lower Eastside Bypass. The studies used to
34 determine the capacities in these reaches are summarized in the 2017 and 2018 CCRs.
35
Draft Technical Memorandum Public Draft
Channel Capacity Report, 2022 Restoration Year 13 –October 2021San Joaquin River Restoration Program
1 Table 4-1 identifies current and recommended then-existing channel capacities, and the method
2 used to determine the capacity for each reach. Then-existing channel capacities in Table 4-1 do
3 not consider limitations to Restoration Flows as it relates to agricultural seepage. For the 2022
4 Restoration Year, releases of Restoration Flows in Reach 2A, Reach 3, and Reach 4A continue to
5 be limited by agricultural seepage, and not levee stability. Details of how these seepage limits are
6 determined and limit Restoration Flows are in the Seepage Management Plan, which can be
7 found on the SJRRP website:
8
9 https://www.restoresjr.net/restoration-flows/seepage-projects/
10
11 Table 4-1.
12 Current and Recommended Then-existing Channel Capacity
Recommended Then- Method used to
Current Then-existing existing Channel determine
Channel Capacity Capacity (cfs)1 Then-existing Channel
Reach (cfs)1 capacity
Geotechnical
Reach 2A 6,0002 6,0002
Assessment
Reach 2B 1,210 1,210 In-channel
Reach 3 2,8603 2,8603 In-channel
Geotechnical
Reach 4A 2,8404 2,8404 Assessment and In-
channel
Reach 4B1 Not Analyzed Not Analyzed --
Geotechnical
Reach 4B2 4,300 4,300
Assessment
Reach 5 2,350 2,350 In-channel
Geotechnical
Middle Eastside Bypass 1,070 2,600
Assessment
Lower Eastside Bypass 2,890 2,890 In-channel
Geotechnical
Mariposa Bypass 350 1,800
Assessment
13 1
Then-existing channel capacity shown in this table is based on levee stability only and does not consider limitations to Restoration Flows
14 related to agricultural seepage.
15 2
Capacity not assessed for flows greater than 6,000 cfs. Restoration Flows are limited to approximately 2,140 cfs due to agricultural
16 seepage.
17 3
Restoration Flows are limited to approximately 720 cfs due to agricultural seepage.
18 4
Restoration Flows are limited to approximately 300 cfs due to agricultural seepage.
19
Draft Technical Memorandum Public Draft
Channel Capacity Report, 2022 Restoration Year 14 –October 2021San Joaquin River Restoration Program
1 5.0 Program Actions
2 Throughout the implementation of the SJRRP, the maximum downstream extent and rate of
3 Restoration Flows to be released would be limited to then-existing channel capacity. As channel
4 or structure modifications are completed, corresponding maximum Restoration Flow releases
5 would be increased in accordance with then-existing channel capacity and the release schedule.
6 A summary of immediate, near-term, and long-term actions that can impact then-existing
7 channel capacity can be found in the 2020 CCR. The SJRRP is continuing to work on several
8 projects related to changing site-specific channel capacity. A status update on advancement of
9 the progress for some of these projects are as follows:
10 • Construct Mendota Pool Bypass and Reach 2B Improvements. The Compact Bypass
11 would route flows and fish around the Mendota Pool and would improve channel
12 capacity to at least 4,500 cfs in Reach 2B. A summary of the work completed can be
13 referenced at the following website:
14 http://www.restoresjr.net/projects/restoration/2b-and-mendota-reach-bypass/
15 • Construct levee and fish passage improvements in the Middle Eastside Bypass (the
16 Eastside Bypass between the Sand Slough Control Structure and Mariposa Bypass). The
17 Reach O levee improvements were completed in 2020 and strengthened what was
18 previously the weakest portion of the levees in the Middle Eastside Bypass. The
19 improvement included constructing a soil-bentonite cutoff wall that is approximately
20 30-40 feet deep along the center of the levee crown. The improvements also included the
21 replacement of six corrugated metal culverts with reinforced concrete culverts.
22 Information regarding the Reach O levee improvements can be referenced at the
23 following website:
24 http://www.restoresjr.net/program-prepares-for-reach-o-levee-work/
25 • Another improvement includes removing two weirs located in the Eastside Bypass and
26 operated by U.S. Fish and Wildlife Service within the MNWR to allow for fish passage.
27 Removal of the weirs began in 2019 and was completed in 2021. A time-lapse video of
28 the lower weir removal can be found at the following website:
29
30 https://www.restoresjr.net/projects/restoration/4b-and-eastside-bypass/
31 6.0 Future Program Studies and Monitoring
32 There are several factors that can impact and limit channel capacity including levee construction
33 or integrity (e.g., insufficient slope stability factor of safety or underseepage factor of safety);
34 flow duration and timing that could saturate the levee and cause instability; erosion of the stream
35 banks that could cause potential levee failure; sedimentation or scouring; ground subsidence; and
Draft Technical Memorandum Public Draft
Channel Capacity Report, 2022 Restoration Year 15 –October 2021San Joaquin River Restoration Program
1 increased roughness from vegetation. These factors, as well as others were considered in
2 developing SJRRP studies and monitoring to determine then-existing channel capacity. A
3 comprehensive list of studies and monitoring activities being completed by the SJRRP can be
4 found in the 2020 CCR. The SJRRP is continuing various monitoring activities for different
5 studies and purposes. These activities are described in the Physical Monitoring and Management
6 Plan (Appendix D of the PEIS/R), the Restoration Flow Guidelines, and the Seepage
7 Management Plan. Typical activities, including flow, sediment mobilization and erosion
8 monitoring, and water surface profile surveys are also described in previous channel capacity
9 reports and are conducted when needed. Updates on the ongoing monitoring activities are
10 described below.
11
12 The following describes the ongoing studies and monitoring activities that may be conducted
13 during the next Restoration Year and included in the following year’s CCR:
14
15 • Continuing the collection of aerial photography and topographic surveys. This
16 information is necessary to obtain information about the river stage, hydraulic roughness,
17 river width, and bed elevation to assist with scientific studies that would inform the
18 SJRRP about how physical changes in the system are impacting then-existing channel
19 capacities. DWR is in the process of collecting additional aerial photography and LiDAR
20 of the entire San Joaquin Valley, including the Restoration Area. The data should be
21 processed and available for use in early 2022. In addition to this effort, other surveys are
22 also being considered including monitoring for subsidence, collection of bathymetric data
23 to supplement the 2021 LiDAR, and to aid in the design of the Mendota Pool Compact
24 Bypass and Reach 2B setback levees.
25
26 • Ongoing updates and assessment of the modeling tools. The SJRRP has developed
27 hydraulic and sediment transport modeling tools to evaluate the flow, seepage, and
28 structural actions as part of meeting the Restoration Goal of the Settlement. Due to
29 continued subsidence some of the modeling tools should be updated to reflect the most
30 recent data, including the 2021 LiDAR. The updates depend on the location, and priority.
31 DWR and Reclamation plan to assess the 2021 LiDAR and the need for future modeling
32 tool updates.
33
34 • Continuing to monitor flow to ensure Restoration Flow releases do not exceed then-
35 existing channel capacity. Reclamation, DWR and the USGS currently maintain several
36 flow and staff gages along the San Joaquin River and tributaries between Friant Dam and
37 the Merced confluence. These gages are used to determine the flow along the river and
38 flood bypasses. All of the gages are available online at the California Data Exchange
39 Center (CDEC).
40
41 • Continuing and expanding vegetation surveys to obtain information on the density,
42 establishment and recruitment of vegetation. This information can be used by the SJRRP
43 to determine if actions need to be taken to address capacity issues because of increased
44 roughness from vegetation within the channel and helps inform availability of fish
Draft Technical Memorandum Public Draft
Channel Capacity Report, 2022 Restoration Year 16 –October 2021San Joaquin River Restoration Program
1 habitat. DWR, in coordination with SJRRP is currently working on a plan to expand the
2 existing monitoring program to better assess how new channel growth may affect channel
3 capacity to help inform the Lower San Joaquin Levee District (LSJLD) maintenance
4 activities.
Draft Technical Memorandum Public Draft
Channel Capacity Report, 2022 Restoration Year 17 –October 2021San Joaquin River Restoration Program
1 7.0 References
2 California Department of Water Resources, 2019. Evaluation of the Effects of Future Subsidence
3 on Capacity up to 2,500 cfs in Reach 4A and Middle Eastside Bypass
4 Reclamation Board, 1967; amended 1978, revised 1985. Lower San Joaquin River Flood Control
5 Project: Operation and Maintenance Manual for Levees, Irrigation and Drainage
6 Structures, Channels, and Miscellaneous Facilities.
7 San Joaquin River Restoration Program (SJRRP). 2012. San Joaquin River Restoration Program
8 Environmental Impact Statement/Report. Available from:
9 https://www.usbr.gov/mp/nepa/nepa_projdetails.cfm?Project_ID=2940. Accessed on
10 March 27, 2017.
11 ______. 2016. San Joaquin River Restoration Program Environmental Impact Statement/Report
12 – Mendota Pool Bypass and Reach 2B Improvement Project. Available from:
13 https://www.usbr.gov/mp/nepa/nepa_project_details.php?Project_ID=4032. Accessed on
14 September 20, 2019.
15 ______. 2017. Technical Memorandum, Channel Capacity Report, 2017 Restoration Year.
16 Available from: http://www.restoresjr.net/restoration-flows/levee-stability-channel-
17 capacity/
18 ______. 2018b. Technical Memorandum, Channel Capacity Report, 2018 Restoration Year.
19 Available from: http://www.restoresjr.net/restoration-flows/levee-stability-channel-
20 capacity/
21 ______. 2018b. Funding Constrained Framework: Viewed online at: Microsoft Word -
22 20180523_Framework_Funding Constrained_Final_For Final Review.docx (restoresjr.net).
23 Accessed: August 2021.
24 ______. 2020. Technical Memorandum, Channel Capacity Report, 2020 Restoration Year.
25 Available from: http://www.restoresjr.net/restoration-flows/levee-stability-channel-
26 capacity/
27 Tetra Tech, 2020. Levee Capacity Evaluation of Mariposa Bypass and Reach 4B2 Study.
28 U.S. Army Corps of Engineers. 2000. Design and Construction of Levees Engineering and
29 Design Manual. Manual No. 1110-2-1913. April 2000. Table 6-1b, page 6-5.
30 ______. 2003. Engineering and Design – Slope Stability. Manual No. 1110-2-1902. October
31 2003.
32 ______. 2005. Design Guidance for Levee Underseepage Engineering Technical Letter. ETL
33 1110-2-569. May 2005.
34
Draft Technical Memorandum Public Draft
Channel Capacity Report, 2022 Restoration Year 18 –October 2021You can also read