Brexit and the reduction in EU fishing quota shares, 2021 to 2023
←
→
Page content transcription
If your browser does not render page correctly, please read the page content below
BRIEFING
Brexit and the reduction in EU fishing
quota shares, 2021 to 2023
SUMMARY
The withdrawal of the United Kingdom from the European Union has reshaped fisheries relations in
the North-East Atlantic to an unprecedented degree, with far-reaching consequences for the fishing
sector in the region and beyond. Under the EU-UK Trade and Cooperation Agreement, EU vessels
retained full access to UK waters for an adjustment period lasting until 30 June 2026, after which
access will be subject to annual consultations.
One of the most significant changes introduced by the agreement on fisheries concerns the transfer
of EU fishing quotas to the UK. The agreement gradually reduces EU fishing opportunities for
55 shared stocks from 2021 to 2025, and specifies how the EU and the UK shares will change each
year for each stock. The transfer is considered to represent 25 % of the value of the EU landings from
UK waters.
Most of the total reduction in EU fishing quota shares comes from a limited number of fish stocks.
This briefing provides a detailed account of the quota reduction for some of the most affected
stocks, which together cover around three quarters of the total lost volume of EU fishing quotas. As
each Member State has a specific share for each stock, the loss of quota affects them to a greater or
lesser extent. This will depend on how big their share is for the stocks subject to significant
reduction. The briefing also illustrates the impact of the transfer on the Member States concerned.
IN THIS BRIEFING
Fishing quotas in the Trade and Cooperation
Agreement
Estimating the Brexit quota transfer
Quota reduction for the most affected fish
stocks
Methodology
EPRS | European Parliamentary Research Service
Authors: Irina Popescu and Frederik Scholaert
Members' Research Service
PE 739.253 – December 2022 EN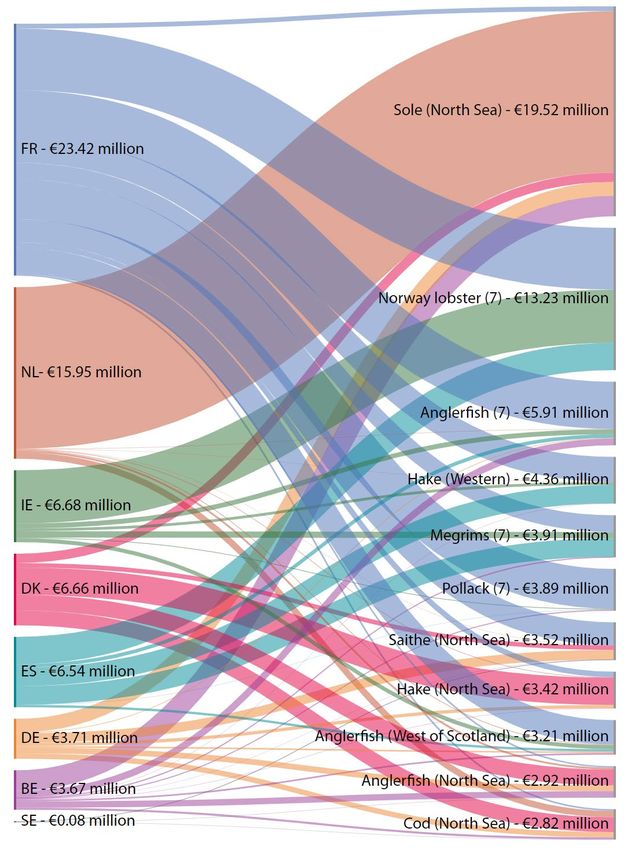
EPRS | European Parliamentary Research Service

Fishing quotas in the Trade and Cooperation Agreement
Since 1 January 2021, the United Kingdom has been an independent coastal state, with full
responsibility over fisheries resources in its waters. Most of the fish stocks in the region, managed
for decades under EU rules, have now become shared stocks jointly managed with the UK. The EU-
UK Trade and Cooperation Agreement (TCA), which was signed on 30 December 2020 and entered
into force on 1 May 2021, established the structure of the new fisheries relationship. The TCA
includes the fisheries chapter as Heading Five of Part Two. 1
The agreement maintains full reciprocal access to EU and UK waters until 30 June 2026 (Protocol on
access to waters in Annex 38).2 Part of the EU quota shares, considered to represent 25 % of the
value of EU landings from UK waters, is gradually being transferred to the UK during this period.
After 1 July 2026, access to waters will be decided in annual consultations. The quota shares
indicated in the agreement remain stable at the 2025 level, and cannot be changed without the
mutual consent of the parties. One party restricting access to waters may lead to compensatory
measures from the other, such as suspending tariff concessions for fisheries products. Further
remedial measures for breaches of the fisheries agreement may lead to the suspension of
preferential tarifs for other goods, and to partial or full suspension of the trade section.

 Allocation of fishing quotas in the EU
 Under the common fisheries policy (CFP), Member States have equal access to fisheries resources in EU
 waters. To manage these common resources, the EU establishes annually the maximum amount that can
 be fished from each stock. This amount, termed the total allowable catch (TAC), is decided by the Council,
 after considering scientific advice about the state of the stock. The TAC for each stock is shared among
 Member States in national quotas according to the 'relative stability' method, whereby a Member State
 receives the same percentage of the total catch of a stock every year. These fixed percentages are known
 as the relative stability keys. To counterbalance the rigidity of the fixed allocation keys, relative stability
 allows Member States to swap fishing quotas. Quota swapping is common practice, reaching an order of
 magnitude of 2 000 swaps per year in recent times.
 Since its introduction in 1983, relative stability has included a compensation system to the benefit of the
 United Kingdom and Ireland, known as 'the Hague preferences'. The system guaranteed these countries a
 minimum quota of certain stocks if the agreed TAC was very low. The Hague prefernces have been applied
 regularly over the years.

Estimating the Brexit quota transfer
The TCA indicates the specific EU and UK shares for 104 fish stocks. Of those, 87 are stocks that the
EU and the UK share bilaterally, trilaterally (with Norway) or with other coastal states (Annexes 35
and 36). For 55 of the shared stocks, the TCA gradually reduces EU fishing opportunities from 2021
to 2025, and specifies how the EU and UK shares will change each year for each stock. Most of the
EU quota reduction occured in 2021 (60 %), with the remainder phased in over the following years
(the cumulative reduction reaches 70 % in 2022, 80 % in 2023, 92 % in 2024 and 100 % in 2025).
The reduction in EU fishing quotas is not uniform across stocks. For 18 shared stocks, the EU share
drops by more than 10 percentage points between 2020 to 2025. 3 Examples of high reduction rates
include North Sea hake (-35.35 percentage points), Norway pout (-25 percentage points) and North
Sea sole (-12.72 percentage points, see Figure 1). For the stocks concerned, Member States' fishing
opportunities are reduced accordingly, in line with their relative stability shares. As different
Member States have different shares for each stock, they are affected to a greater or lesser extent,
depending on how big their share is for the stocks subject to significant reduction. For example, the
the EU share reduction in Irish Sea herring (a loss of 25 percentage points, from 26 % to 1 %), affects
Ireland exclusively.

2
Brexit and the reduction in EU fishing quota shares, 2021 to 2023

Figure 1 – Reduction in EU fishing quota shares for selected stocks between 2020 and 2025

                                 Norway pout (North Sea)                                                                  100%
                                        Sole (North Sea)
                                    Mackerel (North Sea)
                                             Megrims (7)                                                                  90%
                                       Saithe (North Sea)
                                          Hake (Western)
                                               Pollack (7)
                                            Anglerfish (7)
                                        Hake (North Sea)                                                                  80%
                                  Blue whiting (Northern)
                                      Herring (North Sea)
       EU quota share (%)

                                  Anglerfish (W Scotland)                                                                 70%
                                      Norway lobster (7)

                                                                                                                          60%

                                             Cod (North Sea)
                                                                                                                          50%

                                          Mackerel (Western)
                                                                                                                          40%

                                                                                                                          30%

                                    Anglerfish (North Sea)                                                                20%

                                                                                                                          10%

                                                                                                                          0%
                                                           2020       2021      2022       2023       2024      2025
                            Mackerel (Western)            41.68%     35.15%    34.06%     32.98%     31.67%    30.80%
                            Herring (North Sea)           75.91%     71.33%    70.42%     69.50%     68.41%    67.68%
                            Norway pout (North Sea) 100.00%          85.00%    82.50%     80.00%     77.00%    75.00%
                            Blue whiting (Northern)       80.19%     79.47%    79.35%     79.24%     79.09%    79.00%
                            Mackerel (North Sea)          94.67%     93.91%    93.78%     93.65%     93.50%    93.40%
                            Saithe (North Sea)            83.27%     77.71%    76.78%     75.85%     74.74%    74.00%
                            Sole (North Sea)              95.72%     88.09%    86.81%     85.54%     84.02%    83.00%
                            Anglerfish (7)                82.02%     78.78%    78.24%     77.70%     77.05%    76.62%
                            Hake (Western)                82.03%     80.33%    80.05%     79.77%     79.43%    79.20%
                            Norway lobster (7)            67.20%     61.68%    60.76%     59.84%     58.74%    58.00%
                            Megrims (7)                   85.67%     81.37%    80.65%     79.93%     79.07%    78.50%
                            Hake (North Sea)              81.98%     60.67%    57.11%     53.56%     49.29%    46.45%
                            Cod (North Sea)               53.08%     47.03%    46.02%     45.02%     43.81%    43.00%
                            Anglerfish (North Sea)        18.63%     13.74%    12.92%     12.11%     11.13%    10.48%
                            Anglerfish (W Scotland)       69.23%     60.99%    59.62%     58.25%     56.60%    55.50%
                            Pollack (7)                   82.56%     78.03%    77.27%     76.51%     75.61%    75.00%

Data sources for all figures are indicated in the methodology section. The stocks are listed with the common
names and geographical zones as defined in the annual fishing opportunities regulations. Area 7 refers mainly
to the southern Celtic Sea, the Irish Sea and the English Channel.

                                                                                                                                  3
EPRS | European Parliamentary Research Service

Estimating the precise amount of the quota transfer is a very complex exercise. The TAC for the
stocks affected by the reduction changes every year, and consequently the new sharing
arrangements for each year apply to a moving baseline. Additional changes may arise from the
Hague Preferences ceasing to apply to the UK, which alters the relative shares of the Member States
traditionally contributing to the transfer of quotas to or from the UK. Once established, the quotas
may be subject to in-year amendments or to quota swaps, or may be increased by carryovers from
the previous period. The quota uptake, indicating how much of the quota for each stock is used in
practice, is also a parameter in the evaluation of the actual economic impact on fishing fleets.
Moreover, calculating the value of the transfer also depends on the average price per tonne for each
species, which varies per year and per Member State in line with market fluctuations.
Several estimates of the Brexit quota transfer have been proposed by fisheries experts from
goverment or independent organisations, considering some of the parameters mentioned above in
various combinations. 4 Most often, the transfer is estimated by applying the TCA quota shares
(usually for 2021 and/or 2025) to the 2020 (pre-Brexit) fishing opportunities, or to an average quota
for several previous years. For instance, the UK's Marine Management Organisation (MMO) estimate
compared what the UK would have received each year between 2012 and 2020, had it held the final
TCA shares for 2026, with what it actually received.
On the EU side, the Scientific, Technical and Economic Committee for Fisheries (STECF) analysed the
quota-share impact of the TCA on the EU fishing fleet. The STECF report compared Member States'
quotas in 2020 with the equivalent quotas that result if the TCA shares for 2021 and 2025 are applied
to constant 2020 quotas. In addition to the direct transfer of quotas, the report analysed the indirect
impact of changes in the application of the Hague preferences. Indeed, following its withdrawal, the
UK lost the benefits of increased quotas from the Hague preferences (which applied chiefly to North
Sea haddock and whiting, and to West of Scotland saithe), and the Member States previously
providing these quotas now have higher shares. Conversely, the relative shares of Ireland decrease
for the stocks where it can invoke its own preferences, as they benefited from the UK's contribution.
Considering the cumulative impact of the changes from quota transfers and the Hague preferences,
the STECF report estimated the EU quota reduction attributable to the TCA at 73 697 tonnes in 2021,
and 122 893 in 2025.

Quota reduction for the most affected fish stocks
The 55 shared stocks with decreasing EU shares contribute to different extents to the total volume
and value of the lost quota at EU level. 5 Most of the total reduction comes from less than a third of
these stocks. This briefing focuses on 16 of the most affected stocks (5 pelagic fish, 10 demersal fish
and 1 shellfish), located mainly in the North Sea and the North Western waters (Figure 1). The
briefing illustrates the EU quota reduction due to the TCA for 2021, 2022 and 2023, based on a stock-
by-stock and country-by-country analysis of the quota transfers. The calculation method is similar
to the STECF estimate, but considers the annual TAC change (see Methodology). None of the
selected stocks is concerned by changes in the Hague preferences regime. The stocks considered
here cover around three quarters of the total EU quota reduction by volume.6
Table 1 – EU quota transfer for the selected stocks

                                2021                 2022                 2023                 Total

 Reduction by weight
                              -57 823               -11 164              -9 024               -78 011
 (tonnes)

 Reduction by value
                               -81.06               -13.93               -11.93               -106.92
 (€ million)
Data sources are indicated in the methodology section. The EU quota transfer in a given year is calculated by
applying the TCA share for that year to the TAC for the previous year.

4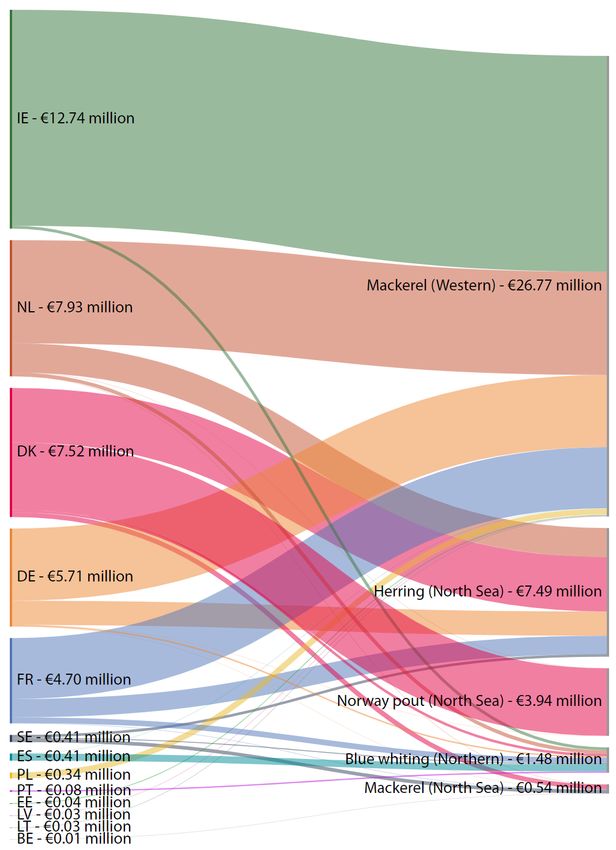
Brexit and the reduction in EU fishing quota shares, 2021 to 2023
The analysis of the selected stocks provides detailed insights into the magnitude of the quota
transfer over the first 3 years following Brexit (i.e. for 80 % of the total reduction).
The cumulative reduction for the 2021-2023 period reached an estimated 78 011 tonnes and
was worth approximately €107 million (Table 1).
Five Member States share 96 % of the quota reduction volume: Denmark (29 %), Ireland
(23 %), the Netherlands (18 %), France (14 %) and Germany (12 %) (Figures 2 and 3).
Figure 2 – Member States' shares in the loss in volume of EU fishing quotas (cumulative
volume 2021 to 2023)
5EPRS | European Parliamentary Research Service
The total lost value is shared almost entirely between seven Member States, which together
account for 99 % of the reduction: France (27 %), the Netherlands (22 %), Ireland (18 %),
Denmark (13 %), Germany (9 %), Spain (7 %) and Belgium (3 %). The different impact in terms of
volume and value is associated with Member States losing quotas of more or less valuable stocks
(Figure 4).
Figure 3 – Reduction of fishing quotas by Member State in 2021, 2022 and 2023, by
volume (tonnes)
FR NL IE DK DE ES BE SE PL PT EE LV LT
-575 -335 -45 -40 -29 -29
-704
-1 575
2023
2022
2021
-9 700
-11 149
-13 917
-17 602
-22 311
Figure 4 – Reduction of fishing quotas by Member State in 2021, 2022 and 2023 by value
(€ million)
FR NL IE DK DE ES BE SE PL PT EE LV LT
-0.49 -0.34 -0.08 -0.04 -0.03 -0.03
-3.68 2023
-6.95 2022
-9.41 2021
-14.17
-19.42
-23.88
-28.39
6Brexit and the reduction in EU fishing quota shares, 2021 to 2023
Pelagic stocks account for most of the quota reduction by volume. Western mackerel, along with
North Sea herring and Norway pout, cover 78 % of the volume transfer (Figure 5).
Western mackerel is the stock with by far the highest Brexit transfer, both in volume
(31 156 tonnes) and value (€26.77 million), which represents 40 % of the total weight of the
stocks analysed, and 25 % of the total value (Figures 5 and 6).
Demersal fisheries have a significant impact on the total loss by value. North Sea sole and
Norway lobster provide the biggest transfers (€19.52 and €13.23 million respectively, Figure 6).
Figure 5 – Reduction in EU fishing quotas in 2021, 2022 and 2023, by volume (tonnes)
0 -10 000 -20 000 -30 000
Mackerel (Western) -31 156
Herring (North Sea) -14 880
Norway pout (North Sea) -14 679
Blue whiting (Northern) -2 979
0 -1 000 -2 000 -3 000
Mackerel (North Sea) -320
Saithe (North Sea) -2 584
Sole (North Sea) -1 795
Anglerfish (7) -1 571
Hake (Western) -1 355
Norway lobster (7) -1 250
Megrims (7) -1 066
Hake (North Sea) -1 060
Cod (North Sea) -960 2021
Anglerfish (North Sea) -860 2022
Anglerfish (West of Scotland) -814 2023
Pollack (7) -684
Figure 6 – Reduction in EU fishing quotas in 2021, 2022 and 2023 by value (€ million)
0.00 -10.00 -20.00 -30.00
Mackerel (Western) -26.77
Herring (North Sea) -7.49
Norway pout (North Sea) -3.93
Blue whiting (Northern) -1.48
Mackerel (North Sea) -0.54
Saithe (North Sea) -3.52
Sole (North Sea) -19.52
Anglerfish (7) -5.91
Hake (Western) -4.36
Norway lobster (7) -13.23
Megrims (7) -3.91
Hake (North Sea) -3.42
2021
Cod (North Sea) -2.82
2022
Anglerfish (North Sea) -2.92 2023
Anglerfish (West of Scotland) -3.21
Pollack (7) -3.89
7EPRS | European Parliamentary Research Service
Member States are affected to differing extents by the lost value for different stocks
(Figure 7, detailed in Figure 8 for demersal stocks and in Figure 9 for pelagic stocks).
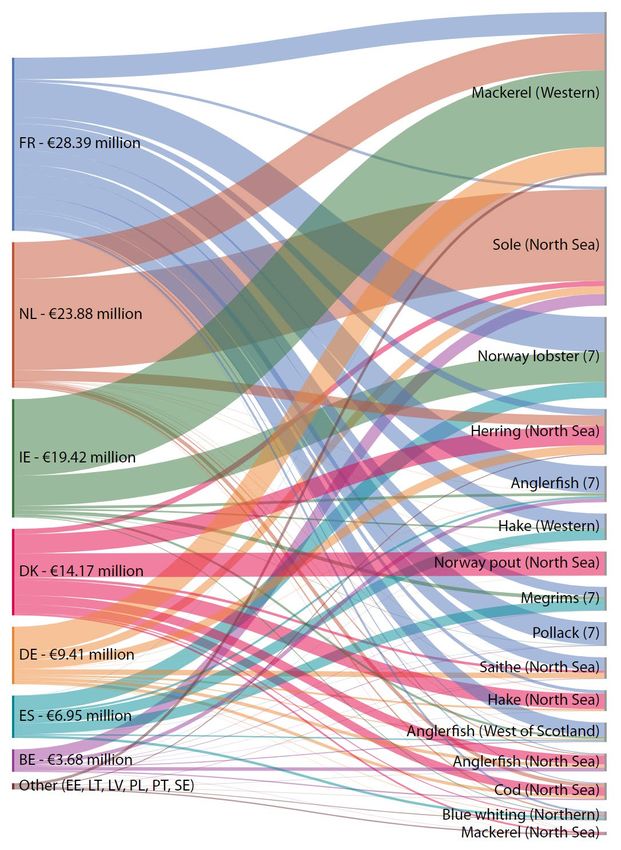
Figure 7 – Reduction in fishing quotas by Member State and distribution among fish
stocks (cumulative value 2021 to 2023, € million).
8Brexit and the reduction in EU fishing quota shares, 2021 to 2023
For France, most of the loss comes from a variety of demersal fisheries: Norway lobster,
anglerfish, pollack and megrims in Area 7, North Sea saithe and West of Scotland anglerfish.
For pelagic stocks, the main lost quota is for mackerel.
The Netherlands accounts for the vast majority of the EU reduction for North Sea sole. It also
accounts for important transfers of Western mackerel and North Sea herring.
Figure 8 – Reduction in fishing quotas by Member State and its distribution among
demersal fish stock (cumulative value 2021 to 2023, € million).
9EPRS | European Parliamentary Research Service Figure 9 – Reduction in fishing quotas by Member State and its distribution among pelagic fish stock (cumulative value 2021 to 2023, € million). 10
Brexit and the reduction in EU fishing quota shares, 2021 to 2023
Ireland suffers the brunt of the loss of Western mackerel quota, accounting for around half
of the EU total. It also accounts for a large part of the Norway lobster reduction.
Denmark's loss comes mainly from North Sea stocks, both pelagics – almost entirely Norway
pout and herring, and a variety of demersals – hake, anglerfish, cod and sole.
For Germany most of the lost quotas concern pelagic stocks – Western mackerel and North
Sea herring in particular. The demersal fisheries most affected are located in the North Sea
– sole, saithe, anglerfish and cod.
Spain's quota reduction is dominated by demersal fisheries, mostly Norway lobster and
megrims in Area 7, and Western hake.
For Belgium too, the reduced quotas concern predominantly demersal stocks, in particular
sole and anglerfish in the North Sea, and anglerfish in Area 7.
Sweden loses quotas mainly for pelagic stocks – mackerel and herring in the North Sea.
Poland, Estonia, Latvia and Lithuania have minor losses for Western mackerel.
Portugal has minor losses for Northern blue whiting.
Methodology
The estimate of the Brexit reduction is based on the initial fishing opportunities for 2020, 2021 and
2022, as indicated in Regulations 2020/123, 2021/1239 and 2022/109, and does not consider
subsequent changes. If the TAC remained constant from one year to the next, the change would be
due only to the Brexit transfer. Therefore, to separate the quota reduction due to the TCA from the
annual change in the TAC, the Brexit transfer in a given year is calculated by applying the EU share
for that year (according to the TCA) to the TAC for the previous year. For example, the Brexit transfer
in 2023 is obtained by comparing the EU quota in 2022 with the quota that results from applying
the 2023 TCA share to the 2022 TAC. The EU quota shares are taken from the EU-UK TCA,
Annexes 35 and 36.
The estimate of the value of the quota reduction is based on data published along with the STECF
annual report on the EU fishing fleet, as regards landings data submitted by Member States under
the data collection framework. To capture the latest market trends, this briefing uses the most recent
available prices, namely 2021 prices in the cases of BE, DE, DK, IE, LT, NL and SE and the 2020 prices
in the cases of ES, FR and PT. For mackerel landings by EE, LV and PL, owing to the unavailability of
data, the value is set at the average price of the other 10 countries. Please note that for certain stocks,
significant price differences may occur compared with the first sale prices published by the
European Market Observatory for Fisheries and Aquaculture Products (EUMOFA) or national sources
(which were used for the purposes of our preliminary 2021 analysis).
MAIN REFERENCES
Marine Management Organisation (MMO), Analysis of fishing quota shares in the EU-UK Trade and
Cooperation Agreement, September 2021.
Popescu I. and Scholaert F., EU-UK relations in fisheries, EPRS, European Parliament, February 2021.
Popescu I. and Scholaert F., Post-Brexit fishing quota changes: 2021, EPRS, European Parliament,
January 2022.
Scientific, Technical and Economic Committee for Fisheries (STECF), The 2021 Annual economic report
on the EU fishing fleet, November 2021.
11EPRS | European Parliamentary Research Service
ENDNOTES
1
For a detailed presentation of the TCA fisheries agreement, see I. Popescu and F. Scholaert, EU-UK relations in fisheries,
EPRS, European Parliament, February 2021.
2
The access rules concern the 12-200-mile exclusive economic zones, as well as the 6-12-mile waters in the coastal
zones of the southern UK (the southern North Sea, the English Channel, the northern Celtic Sea and the Bristol
Channel, corresponding to ICES areas 4c and 7d-g).
3
Marine Management Organisation, Analysis of fishing quota shares in the EU-UK Trade and Cooperation Agreement,
September 2021.
4
See, for instance, STECF 2021, op.cit., MMO, 2021 op.cit., ABP mer, EU-UK Trade and Cooperation Agreement,
Thoughts on fisheries from a UK perspective, January 2021; B. Caillart and P. Salz, Workshop on impacts of the EU-UK
Trade and Cooperation Agreement on fisheries and aquaculture in the EU, Part III: Fishing opportunities aspects,
Policy Department for Structural and Cohesion Policies, February 2022; Department of Agriculture, Food and the
Marine, Ireland, Preliminary analysis of reduction of fisheries quota shares under EU/UK Trade and Cooperation
Agreement, January 2021; National Federation of Fishermen's Organisations (NFFO), Brexit balance sheet, September
2021; B.D. Stewart, C. Williams, R. Barnes, S.F. Walmsley and G. Carpenter, 'The Brexit deal and UK fisheries – has reality
matched the rhetoric?', Maritime Studies, January 2022.
5
See for instance the analysis provided by ABP mer 2021, op.cit.
6
As it results by comparing our results for 2021 with the total amount estimated by the STECF for the same year.
DISCLAIMER AND COPYRIGHT
This document is prepared for, and addressed to, the Members and staff of the European Parliament as
background material to assist them in their parliamentary work. The content of the document is the sole
responsibility of its author(s) and any opinions expressed herein should not be taken to represent an official
position of the Parliament.
Reproduction and translation for non-commercial purposes are authorised, provided the source is
acknowledged and the European Parliament is given prior notice and sent a copy.
© European Union, 2022.
Photo credits: © A / Adobe Stock.
eprs@ep.europa.eu (contact)
www.eprs.ep.parl.union.eu (intranet)
www.europarl.europa.eu/thinktank (internet)
http://epthinktank.eu (blog)
12You can also read