Assessing Accessibility of Dockless Sharing-Bike Networks by the Social Network Analysis Method
←
→
Page content transcription
If your browser does not render page correctly, please read the page content below
Hindawi
Journal of Advanced Transportation
Volume 2021, Article ID 5584008, 13 pages
https://doi.org/10.1155/2021/5584008

Research Article
Assessing Accessibility of Dockless Sharing-Bike Networks by the
Social Network Analysis Method

 Pei Liu ,1 Junlan Chen ,1 Heyang Sun ,1 Xiucheng Guo ,1 Yan Wang ,2
 and Zhenjun Zhu 3
 1
 School of Transportation, Southeast University, No. 2 Dongnandaxue Road, Nanjing 211189, China
 2
 Chien-Shiung Wu College of SEU, Southeast University, No. 2 Dongnandaxue Road, Nanjing 211189, China
 3
 College of Automobile and Traffic Engineering, Nanjing Forestry University, No. 159 Longpan Road, Nanjing 211189, China

 Correspondence should be addressed to Xiucheng Guo; seuguo@163.com

 Received 26 February 2021; Accepted 21 June 2021; Published 1 July 2021

 Academic Editor: Luigi Dell'Olio

 Copyright © 2021 Pei Liu et al. This is an open access article distributed under the Creative Commons Attribution License, which
 permits unrestricted use, distribution, and reproduction in any medium, provided the original work is properly cited.
 Dockless sharing bikes play an increasingly significant role in transit transfer, especially for the first/last mile. However, it is not
 always accessible for users to find sharing bicycles. The objective of this paper is to assess the accessibility of dockless sharing bikes
 from a network perspective, which would provide a decision-making basis not only for potential bike users but also for urban
 planners, policymakers, and bicycle suppliers to optimize sharing-bike systems. Considering bicycle travel characteristics, a
 hierarchical clustering algorithm was applied to construct the dockless sharing-bike network. The social network analysis (SNA)
 method was adopted to assess the accessibility of the bike network. Then, a spatial interaction model was chosen to conduct a
 correlation analysis to compare the accessibility obtained from the SNA approach. The case study of Shanghai indicates a strong
 connection between the accessibility and the SNA indicators with the correlation coefficient of 0.779, which demonstrates the
 feasibility of the proposed method. This paper contributes to a deep understanding of dockless sharing-bike network accessibility
 since the SNA approach considers both the interaction barriers and the network structure of a bicycle network. The developed
 methodology requires fewer data and is easy to operate. Thus, it can serve as a tool to facilitate the smart management of sharing
 bikes for improving a sustainable transportation system.

1. Introduction key indicator to evaluate the effective functioning of dockless
 sharing bikes. Therefore, to improve the satisfaction of dockless
Dockless bike-sharing has been launched in many counties bike-sharing service, the accessibility of dockless sharing bikes
worldwide since 2015. A still-growing list of cities that provide should be assessed first to inform both suppliers and users.
such service can be found at the bike-sharing world map. This paper focuses on measuring the accessibility of
Dockless bike-sharing has sprung up in China since 2016, and dockless sharing bikes in a network perspective within
the scale of shared bicycle users in China reached 235 million in relatively available data. Furthermore, we apply the social
2018, indicating its extensive usage among urban trans- network analysis approach to the evaluation of the bicycle
portation. The dockless sharing bikes are one kind of public network, and a correlation analysis between accessibility and
transportation modes with unique strengths. However, there is SNA indicators is conducted to verify the effectiveness and
still some room for improvements reflected in the dockless reliability of the proposed method. According to these re-
sharing-bike satisfaction survey. The biggest problem is that search studies, the characteristics of accessibility can be
when passengers want to use sharing bikes to travel, it is summarized as follows: accessibility is a spatial-temporal
difficult to find sharing bikes within the acceptable range. This concept, which represents the difficulty extent of commu-
indicates that it is extremely important for dockless sharing nication between spatial entities to overcome the resistance
bikes to be accessible to the potential users, as accessibility is a of interactions. Accessibility includes three essential
2 Journal of Advanced Transportation

elements: origins, destinations, and the transportation sys- are spatial barrier model, cumulative opportunity model,
tem. This research could help city planners, policymakers, spatial interaction model, utility model, and space-time con-
and bicycle suppliers obtain information to identify areas straint model [16–19]. The spatial interaction model and utility
that need to improve infrastructure investment and bike- model comprehensively consider land use and traffic demand,
sharing to create a friendly environment for nonmotorized spatial barrier, and other factors, which can be widely used in
travel patterns and improve sustainable transport systems. the study of coordinated development of land use and traffic.
This is in line with the concept of green and sustainable The cumulative opportunity model is challenging to determine
development. the time threshold, and its application scope is relatively
 The rest of the paper is organized as follows: the next limited, so it is mostly used in the project location, economic
section is a literature review. Section 3 presents the meth- center node evaluation. The spatial barrier model and spatial-
odology, including dockless sharing-bike network genera- temporal constraint model cannot reflect other information
tion by a new clustering algorithm and accessibility such as land use and traffic demand, and the amount of data
assessment model construction based on the SNA approach. needed is large and difficult to obtain, so the application scope
In Section 4, the data availability is explained and a cor- is limited.
relation analysis is performed to explore the relationship Apart from these widespread models, some concepts from
between SNA indicators and accessibility. Finally, the paper social network analysis (SNA) also have been introduced to
finishes with some conclusions and proposals. quantify accessibility. SNA, also known as structural analysis, is
 a strategy for investigating social networks and structures using
2. Literature Review mathematical concepts abstracted from graph theory [20].
 Since the first appearance in 1960, SNA has been applied
Bike-sharing allows people a healthy, enjoyable, and emis- extensively in many social science areas. In the field trans-
sion-free way to commute across small distances free from portation, SNA techniques are first introduced to the business
the worries of owning a bike [1], which is the primary logistics and transportation community to study the dynamic
motivation for sharing-bike usage [2, 3]. Particularly, flows of communication between members of a social network
dockless sharing bikes could be used in addition to public [21]. Gehrke et al. believe that network connectivity can be used
transit, thus providing an efficient option for first-/last-mile as a measure of accessibility [22]. Graph theory, a useful tool of
trips [4]. Integrating bike-sharing into urban transport network analysis, is a branch of mathematics with broad and
systems is critical to mutually reinforcing sustainable practical applications, which can also be used to model
transport networks [5]. In order to enable people to use transportation systems [23]. Batty introduced graph theory to
shared bikes more, the improvement of accessibility is an measure accessibility with respect to the physical transportation
important aspect. In this way, users can be notified of the infrastructure [24]. Chen et al. selected several measures of the
best pick-up location in advance, and smart management as network topological structure to examine the accessibility of the
well as improvement of bike-sharing service can be realized metro network in Guangzhou [25]. More recently, Rubulotta
by urban planners, policymakers, and suppliers [6, 7]. et al. made comparisons between connectivity and traditional
 Defining and evaluating accessibility allows us to think traffic planning measurement methods, and the results dem-
about it systematically, as it relates to planning, trans- onstrated the correlation between SNA centrality calculation
portation, equity, and other aspects [8]. Accessibility (or just and traffic accessibility and closeness [26]. El-Adaway et al.
access) for transportation planning is broadly referred to as used SNA to analyze transportation networks, which proves its
the ease of reaching goods, services, activities, and desti- effectiveness as a supplementary tool for improving trans-
nations, which together are called opportunities [9]. Weibull portation planning [27]. Sarlas et al. proposed a new method by
defines accessibility as the freedom of individuals to par- combining the indicator of betweenness in social networks with
ticipate in activities [10]. The notion of accessibility relies on geographical accessibility to estimate real-life urban network
two core concepts: location (transport infrastructures, accessibility [28]. Chen and Chang illustrated the relationship
population, and economic activity) and distance. Accessi- between connectivity and accessibility and proved that SNA is
bility therefore takes into account a number of development valid for connectivity assessment [29]. From all the research
patterns, including density and land use [11]. Murray and studies, we could find a new perspective, that is, the SNA
Wu believed that accessibility comprised access and geo- approach, to assess transportation networks and detect the
graphic coverage in public transit planning. Access is the interconnectivity in transport networks. Conventional assess-
process of getting users from their origin to the trans- ment methods evaluate individuals and attributes in an isolated
portation network, and geographic coverage is the trans- manner, whereas SNA methods evaluate individuals and their
portation network across a spatial medium [12]. Zuo et al. relationships in the overall network, thus extracting the net-
defined bicycle-transit accessibility as the number of loca- work’s holistic patterns [30].
tions reachable within a time threshold [13]. Generally, most previous research studies have been
 In terms of quantitative evaluation of accessibility, nu- conducted on accessibility, although there still exist some
merous methods have been developed. Researchers have research gaps. First, there are no best methods for acces-
proposed several criteria to assess the usefulness and limitations sibility assessment. Among various accessibility assessment
of accessibility measures for different study purposes [14], such methods, challenges are noted arising primarily from
as reasonability, feasibility, interpretability, and usability [15]. problems such as data acquisition, data quality, determi-
The commonly used methods for accessibility measurement nation of model parameters, and network attributes
Journal of Advanced Transportation 3

ignorance. Different from traditional research, the SNA 3.2. Accessibility Model Based on Social Network Analysis
method emphasizes on structural features of networks rather
than on length and path within networks, which provides us 3.2.1. Node Generation. The registration points of dockless
a new overview in accessibility assessment. What’s more, sharing bikes present significant discontinuity and ag-
previous studies paid more attention to motorized modes, glomeration in space. A hierarchical clustering method
which could not apply to bicycles directly. Dockless sharing based on spatial distance was applied in this paper for two
bicycles are frequently chosen as an addition to public main reasons: the original dataset is too large to analyze as
transportation for the first/last mile. Thus, the trips are every bike could be a point on the map, and sharing bikes
mostly short distance. Consequently, the network of usually accumulate around POIs. Therefore, it will be
dockless sharing bikes is connected in a local rather than a convenient and reasonable to aggregate close locations in the
global manner compared with motorized networks. As same class. When it comes to the clustering criteria, the
stated by Ting Zuo, “the access to transit by bicycling is spatial distance was selected considering characteristics of
greatly determined by bike network connectivity” [31]. dockless sharing bikes. Bike users generally choose dockless
 To fill these knowledge gaps, we use the SNA method to sharing bicycles to travel within one kilometer (seen in
emphasize the structural characteristics of the network and Figure 1), and they are usually not willing to walk long
consider more local connections in the study of accessibility. distances to find a dockless sharing bike. Distance is the
This article defines the network accessibility of dockless primary factor that users might consider in bike usage. In
sharing bicycles as the difficulty of using sharing bikes to this way, the spatial distance was selected as the standard for
flow between origins and destinations in the network. the clustering of origins and destinations, and the criteria
 scope should be constrained within the range of passengers’
3. Methods acceptable walking distances.
 The iterative procedure of the distance-based clus-
A network comprises nodes (vertices) and links (edges). The tering algorithm is presented in Figure 2, which combines
dockless sharing bikes have no fixed locations, and they could the location of public transportation stations. Different
be parked anywhere, resulting in the difficulty in node de- from other clustering methods, there is no need to assign
termination. To abstract the dockless sharing-bicycle network, an exact number of final clusters in this paper. Circles with
a novel clustering algorithm based on riding distance was the same color denote bike origins and destinations that
proposed to generate nodes in a network, and the links were belong to the same group. Figure 2 represents the traversal
defined according to both the riding distance and the bike order of these points. In the first iteration, each point did
volume between two nodes. Based on the network, we con- not belong to a cluster since no clusters had been defined.
structed a model to assess accessibility stemmed from the SNA In every iteration, the algorithm searched for a point and
approach. To verify the proposed approach, we first calculated determined if it belonged to an existing group based on
the accessibility with the commonly used method (spatial the distance threshold. When the distance between this
interaction model, Section 3.1) and compared the results of the point and any center of existing clusters was less than the
two methods to check the efficiency of the new approach. distance threshold, it would be put in this cluster set, and
 the center point coordinates would be updated. Other-
 wise, the algorithm created a new group whose center was
3.1. Spatial Interaction Model. In order to verify the effec- the same as this point. After iterations, each point would
tiveness of the SNA method, this paper introduced the be defined in a cluster that consisted of some spatially
spatial interaction model as a control. In this model, ac- related points.
cessibility was defined as the potential for interaction be-
tween two points, indicating the impedance between nodes
and affected by the scale of traffic activities on the network. 3.2.2. Network Construction. The travel of dockless sharing
The calculation formula was based on the potential model bikes presents evident uneven and geographically aggrega-
proposed by Hansen [19]: tive distribution in spatial as bicycles will gather and flow
 Dj between different zones spontaneously. To be simplified, we
 Acci � , (1) assumed the clustering centers to be network nodes. After
 j
 dαij
 counting bike flow between clustering centers, reasonable
where Acci represents the accessibility of node i, dij rep- flow impedance function could be set up to calibrate links in
resents the impedance between two nodes in the network, the network. In this paper, a bicycle network based on flow
and Dj is the number of opportunities provided by node j relationships and distances between different traffic zones
within a specific impedance acceptable range. In this article, was established:
impedance was measured by the nonlinear distance between
network nodes, where Dj is the number of bicycles provided G � (V, E), (2)
(output) by node j (in other words, the number of bicycles
that start from node j), dij represents the impedance be- where V represents the center nodes of dockless sharing-bike
tween two nodes in the network, and α is a parameter traffic zone, and E represents the link of nonmotorized traffic
reflecting the degree of impedance influence, which could be network, that is, the connection between nodes, which re-
selected according to the empirical value. flects the connection between traffic zones.

4 Journal of Advanced Transportation

 7 ×10
 5

 6

 5

 Travel frequency
 4

 3

 2

 1

 0
 0 2 4 6 8 10 12 14
 Travel distance (km)
 Figure 1: Distribution of dockless sharing bikes: travel distance distribution.

 Iteration 1 Iteration 3 Iteration 5 Iteration 7 Iteration 9

 1 1 1 3 1 1
 2 3 2 3 2 2 3 2 3
 5 5 5 5 5
 4 4 4 4 4

 6
 6 6 6 6
 i=0 8 i=2 8 i=4 8 i=6 8 i=8 8
 m=0 7 m=1 7 m=2 7 m=3 7 m=4 7

 Iteration 2 Iteration 4 Iteration 6 Iteration 8

 1 1 1
 3 1
 2 3 2 2 3 2 3
 5 5 5 5
 4 4 4 4
 …………
 i=1 6 i=3 6 i=5 6 i=7 6 8
 m=1 8 m=2 8 m=2 8 m=3
 7 7 7 7

 Figure 2: Iterative procedure of the distance-based clustering algorithm.

 Since the traffic flow between two zones is usually ⎪
 ⎧ d
 ⎪
 ⎪ , d ≤ d0 ,
asymmetric, in other words, there is commonly a sig- ⎪
 ⎨q
nificant flow direction between the two zones. Thus, G is weight � ⎪ (3)
 ⎪
 ⎪
actually a directed weighted graph. There are several ⎪
 ⎩
unique features of a dockless sharing-bike network. First ∞, d > d0 ,
of all, a network is considered to be connected globally. In
 where d denotes the nonlinear distance of two nodes, which
contrast, the dockless sharing-bike network is locally
 equals to Euclidean distance multiples nonlinear parameter
connected as it consists of multiple connected subgraphs
 (which is 1.3 according to the Code for Design of Urban
responding to short-distance travel. Thus, the nodes far
 Road Engineering (CJJ37-2012)); d0 is the threshold of
away from others are not connected. Moreover, the weight
 dockless sharing-bike travel distance (6 km); and q denotes
of links in this network is calibrated for accessibility as-
 the bicycle flow of a link.
sessment, which differs from that of conventional auto-
mobile networks. The higher the bike flow between two
nodes is, the stronger the connection will be, while the 3.2.3. Model Index Selection. There are several reasons for
longer the distance is, the weaker the link will be. And the social network analysis to be applied to dockless sharing-bike
weight will be infinitely great if the distance between two accessibility assessment. First, substantial similarities could be
nodes exceeds the threshold of travel distance. According observed between dockless sharing-bike networks and social
to the characteristics of a dockless sharing-bike network, networks from a structural perspective. The three components
the weight of links should be considered in two facets. In of a social network are actors, ties, and boundaries. Similarly,
this paper, the weight of links was calculated as follows: the three elements also exist in the network of dockless sharing
Journal of Advanced Transportation 5

bikes in the form of nodes (cluster centers), links, and (4) Out-Closeness Centrality. The reciprocal of the sum of the
boundaries of research regions. Second, the purpose of social shortest distances from all other nodes to the node, showing
network analysis and accessibility analysis is consistent. The how easy it is for other nodes to reach the node.
most prominent objective of the two studies is to discover the 1
interdependence and connections between individuals (nodes) Cout � , (7)
 i
 nj�1 d(j, i)
and display these connections in a network. Therefore, we
assumed that it is reasonable to apply the approach of SNA in where d(j, i) represents the length of the shortest path from
the accessibility analysis of a dockless sharing-bike network. j to i.
 In social network analysis, different measures of cen-
trality are commonly introduced to reflect the degree of (5) Betweenness Centrality. The ratio of the shortest path
connectivity of nodes in the network. Some scholars have passing through this node to all shortest paths, which reflects
already applied the SNA method in transportation network the degree of the close connection between this node and
analysis, and “betweenness,” “connectivity,” and “centrality” other nodes (Equation 8).
are frequently selected as measurements. In this paper, the
accessibility of a dockless sharing-bicycle network is defined Pk (i, j)/P(i, j)
 Bk � , (8)
as the difficulty of using sharing bikes to flow between (i,j)∈E
 (n − 1)(n − 2)/2
origins and destinations in the network, which could be
evaluated when the following questions are addressed: where P(i, j) represents the shortest paths between node i
 and j, Pk (i, j) denotes the number of shortest paths between
 (i) To what extent is a node connected to other nodes?
 node i and j, including node k, and n is the number of nodes
 (ii) How far is the distance between the connected in the network. Visually, it can be found that the be-
 nodes? tweenness centrality reflects the importance of the node as
 (iii) What is the role of the node in a network (a hub to an intermediate bridge, which indicates the degree of
 connect other nodes or an endpoint)? closeness.
 The shortest path algorithm (Dijkstra algorithm) was
 On this basis, we chose the following five indexes to reflect
 involved in the index calculation. We determined a
the characteristics of a sharing-bike network. The first two
 threshold of the shortest path solution, considering the
indexes deal with the first question, while the second and the
 characteristics of dockless sharing-bicycle travel. Then, the
last could be addressed by index 3, 4, and 5 independently.
 nonlinear distance between the origins and destinations was
 calculated based on the shortest path. When the result was
(1) Out-Degree Centrality. The number of links out of the
 larger than the threshold value, the path would be invalid.
node in the directed graph, which represents the expansion
 The threshold was set to be 6 km, as shown in Figure 1.
force of the node, also known as integration.
 Dout
 i � outi,j , (4)
 j≠i∈E 3.2.4. Calculation of Accessibility. The five indexes dem-
 onstrate the centrality of every node conclusively and exert
where j represents any node except the node i, E represents different impacts on accessibility. In order to facilitate
the set of all network nodes, and outi,j represents whether comparison, it is necessary to fuse the five indicators into
there is a reachable edge from i to j, when it is yes, outi,j � 1, one indicator as a measure of accessibility. We simplified the
otherwise, outi,j � 0. accessibility model that was quantitatively expressed as
 follows:
(2) In-Degree Centrality. The number of links entering the
node in the directed graph, showing the attraction of a node, 5
or being expressed as radiality. Acci � wj Cij , (9)
 j�1
 Din
 i � ini,j , (5)
 j≠i∈E where Acci denotes the accessibility of sharing-bike clus-
 tering center i, wj denotes the weight of the jth indicator,
when there is a reachable edge from j to i, ini,j � 1; oth- and Cij denotes the jth indicator value of sharing-bike
erwise, ini,j � 0. clustering center i.
 The entropy method is usually employed to evaluate the
(3) In-Closeness Centrality. The reciprocal of the sum of the influence of various indicators on comprehensive mea-
shortest distances from a node to all other nodes, showing surement. Information theory claims that the value of en-
the difficulty of a node to other nodes. tropy is a measure of uncertainty. The entropy declines with
 1 the increasing amount of information, as well as the dis-
 Cin
 i � , (6)
 nj�1 d(i, j) persion degree of an index. Therefore, the entropy method
 was selected in this paper to determine the weight of each
where d(i, j) represents the length of the shortest path from i indicator (coefficient wj ). The calculation process consisted
to j. of three steps.
6 Journal of Advanced Transportation

(1) Normalization of Indicators. It is necessary to standardize temporal information of dockless sharing bicycles, which
the original data as the units and dimensions of various makes it possible to analyze the trajectory of dockless sharing
indexes are of differences. Moreover, the order of magnitude bicycles quantitatively.
of each index differs considerably. The maximum-minimum Due to the error of transmitting signal equipment of
standardization method was used to convert the initial dockless sharing bikes, there may be time vacancies in the
measurement values into nonunit variables (equation (10)). DATA_TIME field, and these records need to be removed to
 j ensure information integrity in subsequent processing.
 j Xi − min Xj Furthermore, the latitude and longitude data of sharing
 Ei � , (10)
 max Xj − min Xj bicycles may drift away from the actual data points because
 j
where Ei is the standardized value of the index jof research of the errors of the GPS. This could be solved by removing
 j
unit i, Xi is the initial value of the index j of research the records whose longitude and latitude are not located in
unit i, min Xj is the minimum value of the index j of all the Shanghai administrative region.
research units, and max Xj is the maximum value of the
index j of all research units. (2) Points of Interest (POIs) Data. POI data are obtained
 from Baidu Map. There are approximately 550,000 POI
 records in Shanghai, which could be divided into 12 cate-
(2) Index Entropy Calculation
 gories, containing catering, landscapes, public facilities,
 j
 j Ei transportation facilities, education, finance districts, busi-
 δi � j, ness residence, automobile services, sports, leisure, medical
 ni�1 Ei
 (11) services, and accommodation. POIs could be used to verify
 1 n j the reliability of node generation.
 j
 ej � − δ ln δi ,
 ln n i�1 i (3) Shanghai Administrative Division Data. The data of
 j Shanghai administrative divisions in Esri Shapefile format
where is the proportion of the index j in the research unit
 δi
 for 2018 include the boundary data of 16 municipal districts
i, n denotes the number of research units, and ej represents
 in Shanghai. This kind of data could be used in determining
the entropy value of index j.
 network boundaries.
(3) Weight Calculation of Indicators
 1 − ej 4.1.2. Characteristic of Dockless Sharing Bikes. The charac-
 wj � , (12)
 m − mj�1 ej
 teristics and distribution of dockless sharing-bicycle trips are
 shown in Figure 3. Figure 3(a) indicates that the travel
where wj is the weight value of indicator j, and m represents distance of sharing bicycles is mainly within 3 km (95.2%)
the number of indicators. and will not exceed 6 km. The highest frequency of travel
 distance ranks between 0.5 and 1.0 km, accounting for 38.3%
4. Case Study of total trips. Figure 3(b) shows that 85.5% of the bike travel
 time is within 20 minutes, of which 35.3% is 5–10 minutes,
4.1. Data Availability. Shanghai is an international me- corresponding to the travel distance of 0.5–1.0 km. It can be
tropolis where dockless sharing bikes gain broad popularity, concluded that sharing bicycles provide a new choice for the
and the network of sharing bikes is relatively stable. first/last mile of urban travel, and most users choose sharing
Therefore, we chose Shanghai as a case study. Data used in bikes for short-distance trips. In this case, sharing bikes are
this paper consisted of three types: dockless sharing-bike an essential part of the connection transportation method of
dataset of Shanghai, Shanghai administrative division data, subway and buses. The speed of sharing bicycles in
and points of interest (POI) data. Figure 3(c) approximately obeys a normal distribution with
 the mode of 7–8 km/h and relatively small discreteness.
 From Figure 3(d), a bimodal distribution of sharing bikes
4.1.1. Data Sources could be observed. The peak time of sharing-bike trips is at 9
 a.m. and 7 p.m., which coincides with the peak time of
(1) Dockless Sharing-Bike Dataset. The dockless sharing-bike commuting trips. It is worth mentioning that the duration of
data used in this paper have approximately 20 million pieces the morning peak and evening peak is different. The evening
of record in 14 days from August to September 2018 in peak of sharing-bicycle usage is about three hours, while the
Shanghai after decryption. The single-day data include bike morning peak is only one hour. This also reflects the di-
ID, data time, lock status, and location (longitude and versity of get-off work hours, and the freedom of travel in the
latitude) records of all dockless sharing bicycles in Shanghai. evening is relatively higher than morning. At the same time,
 Bike identification is used to identify bikes, and then the the usage of sharing bicycles in the morning peak is sig-
single-day running data record chain of a bicycle can be nificantly lower than that in the evening peak. This may be
detected. Lock status is the state quantity of shared bicycles, due to people’s higher requirements for time reliability when
which indicates whether the bike is in usage. Data generation traveling in the morning. There is a certain degree of ran-
times, as well as latitudes and longitudes, provide spatial and domness in finding sharing bicycles, and people tend to
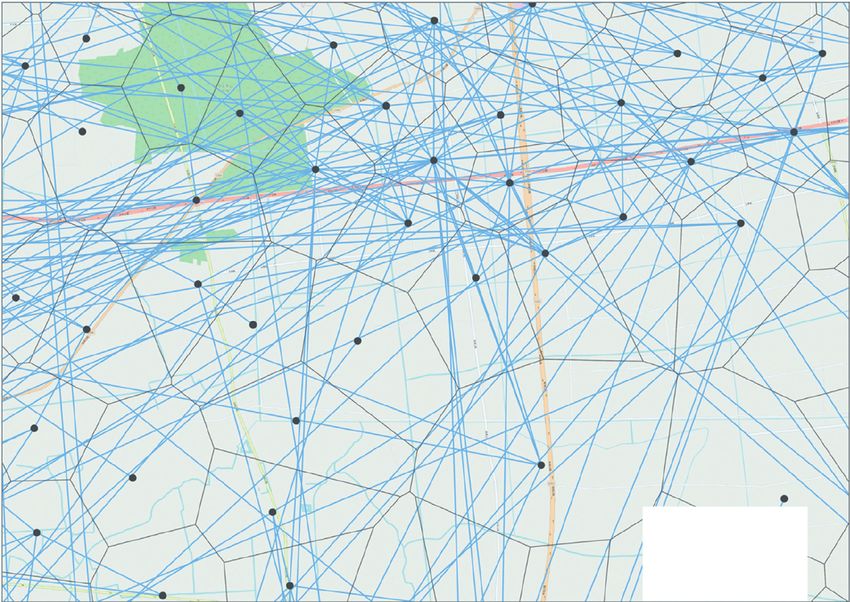
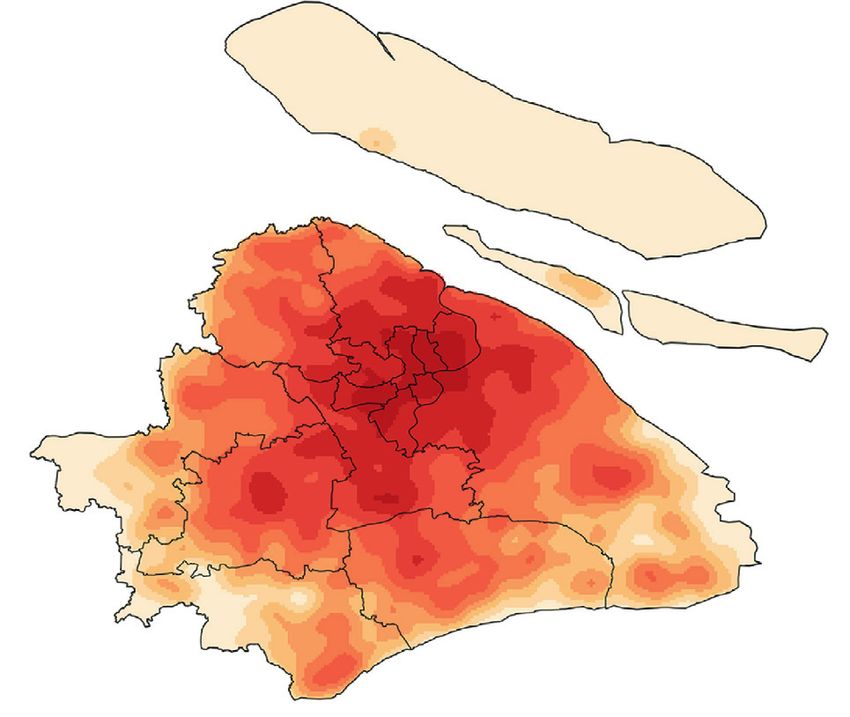
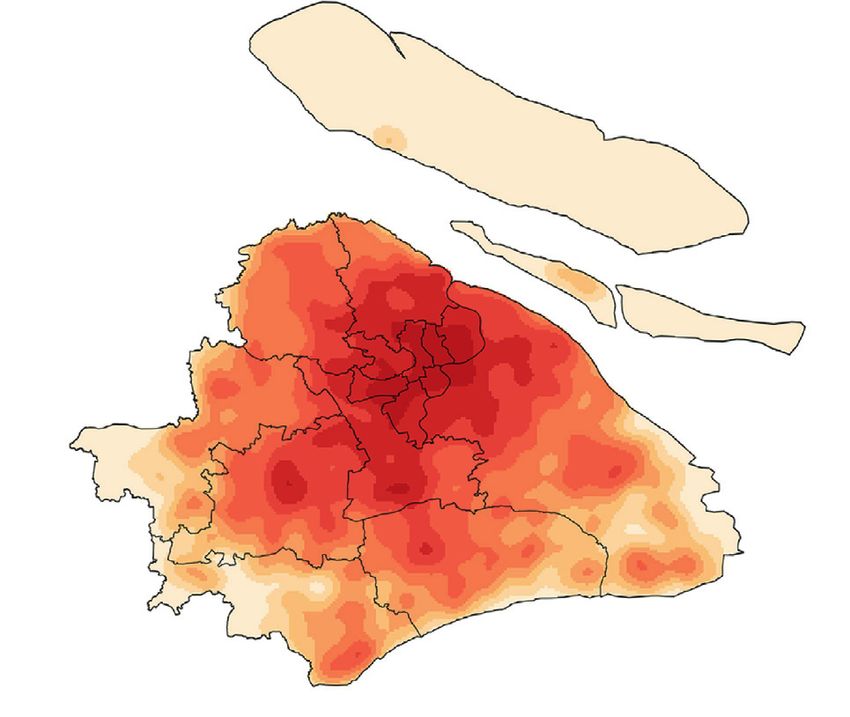
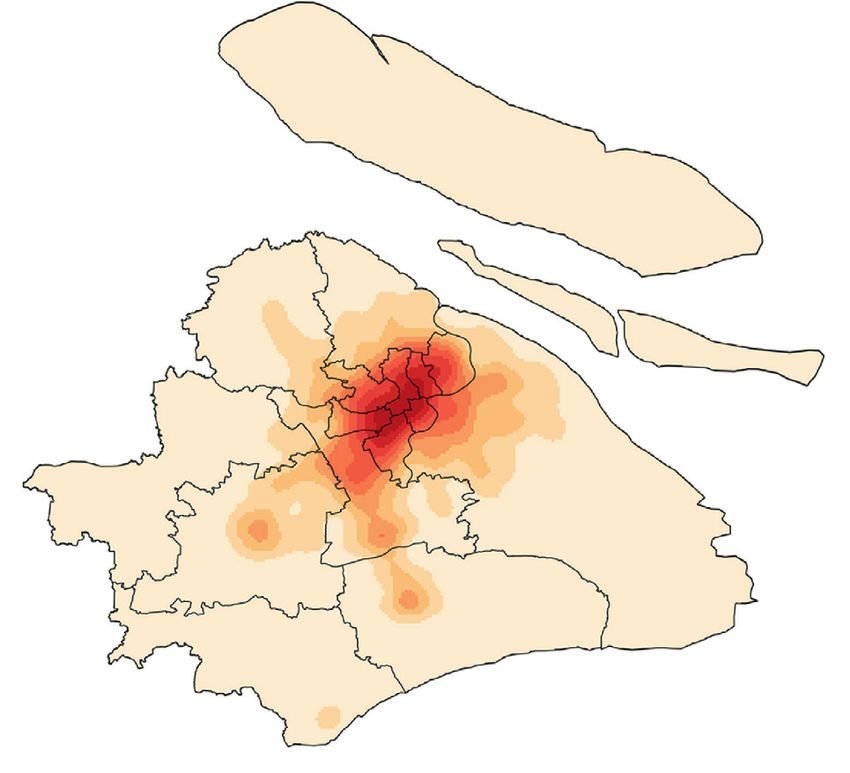
Journal of Advanced Transportation 7

 ×105 ×105
 7 6

 6 5
 5
 Travel frequency

 Travel frequency
 4
 4
 3
 3
 2
 2

 1 1

 0 0
 0 2 4 6 8 10 12 14 0 20 40 60 80 100 120 140
 Travel distance (km) Travel time (min)
 (a) (b)

 ×105 ×104
 2.5 18
 16
 2 14

 Travel frequency
 Travel frequency

 12
 1.5
 10
 8
 1
 6

 0.5 4
 2
 0 0
 0 5 10 15 20 25 30 35 0 5 10 15 20 25
 Travel speed (km/h) Time (h)
 (c) (d)

Figure 3: Distribution of dockless sharing bikes: (a) travel distance distribution, (b) travel time distribution, (c) travel speed distribution,
and (d) 24-hour travel distribution.

choose more reliable travel modes to avoid being late. It can applied to calculate the in-degree, out-degree, in-closeness
be inferred that most bicycle trips are commuting trips- centrality, out-closeness centrality, and betweenness cen-
connecting subways and buses in the first/last mile. These trality of each node before the entropy method was intro-
features of dockless sharing-bike travel can be applied to the duced to compute the weight of each index. On this basis, the
calibration of model parameters. accessibility of each sharing-bike traffic zone was obtained.
 The final model is in the format of equation (9) and could be
 expressed as equation (13). The in-closeness centrality and
4.2. Results and Discussion. The clustering algorithm was betweenness centrality indexes exerted a stronger influence
applied to cluster about 20 million origin and destination on the accessibility, which demonstrated that the difficulty of
points of dockless sharing-bike travel records in Shanghai reaching other nodes and closeness are the critical factors in
within two weeks, and approximately 8,000 sharing-bike accessibility assessment.
traffic zones were obtained. The information of this network
is displayed in Table 1. Each zone is a convex polygon with Accei � 0.160Dout in in out
 i + 0.172Di + 0.208Ci + 0.200Ci + 0.260Bi .
an area of about 0.25 km2 (Figure 4). Comparing these (13)
clustering centers with POIs, we could find that most of
them are coincident with POIs, indicating that bikes The five indicators and accessibility values of each clus-
spontaneously gather around POIs. The division of bike tering zone based on the SNA approach are displayed in
traffic zones not only lays a foundation for the follow-up Figure 5. The five indicators show a decreasing trend from the
research of this paper but also provides a new idea for city center to the periphery. In addition to the city center, there
dealing with the network distribution of nonmotorized are other subcenters, which also have relatively high centrality
traffic. and availability. Observing figures of the five indicators, we
 Based on the data of bike travel flow and travel district could discover that there was a big difference in the evaluation
division obtained by clustering analysis, a sharing-bike of the peripheral areas. The values of closeness centrality and
network was established. Afterward, the SNA method was betweenness centrality in the city periphery were almost close
8 Journal of Advanced Transportation

 Table 1: The information of the sharing-bike network.
Number of nodes Number of edges Mean closeness Mean betweenness Mean clustering coefficient
8061 106297 3.205 × 10⁻⁴ 7.179 × 10⁻⁴ 0.292

 Thiessen polygon
 Node
 Edge

 Figure 4: The sharing-bike network of Shanghai (part of the network).

 Accessibility Accessibility
 0.00 – 0.111 0.556 – 0.667 0.00 – 0.111 0.556 – 0.667
 0.111 – 0.222 0.667 – 0.778 0.111 – 0.222 0.667 – 0.778
 0.222 – 0.333 0.778 – 0.889 0.222 – 0.333 0.778 – 0.889
 0.333 – 0.444 0.899 – 1.00 0.333 – 0.444 0.899 – 1.00
 0.444 – 0.556 0.444 – 0.556
 (a) (b)
 Figure 5: Continued.
Journal of Advanced Transportation 9

 Accessibility Accessibility
 0.00 – 0.111 0.556 – 0.667 0.00 – 0.111 0.556 – 0.667
 0.111 – 0.222 0.667 – 0.778 0.111 – 0.222 0.667 – 0.778
 0.222 – 0.333 0.778 – 0.889 0.222 – 0.333 0.778 – 0.889
 0.333 – 0.444 0.899 – 1.00 0.333 – 0.444 0.899 – 1.00
 0.444 – 0.556 0.444 – 0.556
 (c) (d)

 Accessibility
 0.00 – 0.111 0.556 – 0.667
 0.111 – 0.222 0.667 – 0.778
 0.222 – 0.333 0.778 – 0.889
 0.333 – 0.444 0.899 – 1.00
 0.444 – 0.556
 (e)

Figure 5: The distribution of indicators from SNA for the dockless sharing-bike network in Shanghai: (a) out-degree centrality distribution,
(b) in-degree centrality distribution, (c) out-closeness centrality distribution, (d) in-closeness centrality distribution, and (e) betweenness
centrality distribution.

to zero, which may result from the relatively small supply of various indicators can evaluate the accessibility of the entire
bikes in the peripheral area and the longer distances between research area from multiple angles.
POIs. However, the connection function of nodes (the number To explore the relationship between different indicators,
of links of a node) in the network is ignored in those indexes. we conducted a Pearson correlation analysis (Table 2). As
Therefore, the accessibility calculation model that integrates shown in the table, there is a relatively strong correlation
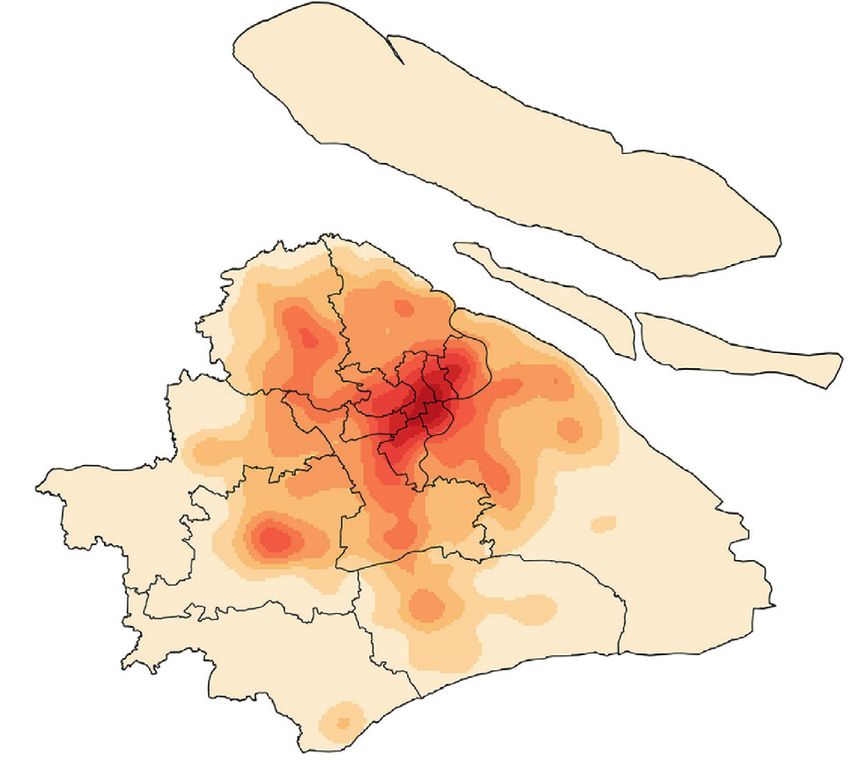
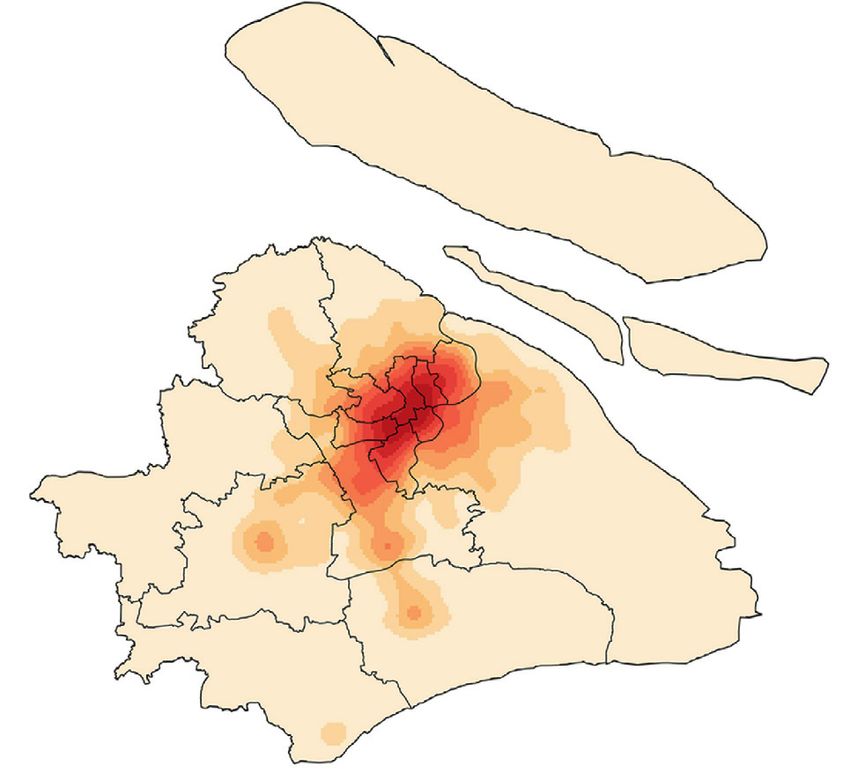
10 Journal of Advanced Transportation

 Table 2: Correlation matrix of accessibility measures.
 In-degree Out-degree In-closeness Out-closeness Betweenness
 Acc_SNA Acc_SIM
 centrality centrality centrality centrality centrality
In-degree
 1
centrality
Out-degree
 0.642∗∗ (0.000) 1
centrality
In-closeness
 0.302∗∗ (0.000) 0.328∗∗ (0.000) 1
centrality
Out-closeness
 0.289∗∗ (0.000) 0.329∗∗ (0.000) 0.982∗∗ (0.000) 1
centrality
Betweenness
 −0.023 (0.000) −0.003 (0.000) 0.754∗∗ (0.000) 0.760∗∗ (0.000) 1
centrality
 ∗∗ ∗∗ ∗∗ ∗∗ ∗∗
Acc_SNA 0.544 (0.000) 0.571 (0.000) 0.929 (0.000) 0.928 (0.000) 0.721 (0.000) 1
 0.779∗∗
Acc_SIM 0.319∗∗ (0.000) 0.350∗∗ (0.000) 0.847∗∗ (0.000) 0.841∗∗ (0.000) 0.502∗∗ (0.000) 1
 (0.000)
∗∗
 Correlation is significant at the 0.01 level (2-tailed). Acc_SNA represents that the accessibility is obtained by the SNA approach, while Acc_SIM represents
that the accessibility is by the spatial interaction model.

 Zha YangPu
 Hong ChongMing
 Bei
 Kou
 PuTuo
 JingAn
 ChangNing HuangPu

 BaoShan
 XuHui JiaDing

 QingPu
 PuDong xin
 MinHang
 SongJiang

 FengXian

 JinShan

 Accessibility
 0.289 – 0.289 0.332 – 0.351
 0.289 – 0.304 0.351 – 0.410
 0.304 – 0.314 0.410 – 0.593
 0.314 – 0.332 0.593 – 0.640
 Figure 6: Accessibility map of dockless sharing bikes in each administrative region of Shanghai.

between accessibility (measured by the spatial interaction centrality is the reciprocal of the sum of the shortest dis-
model) and the closeness centrality (correlation coef- tances between two nodes, the high correlation indicates that
ficient � 0.84). Accessibility (measured by spatial interaction accessibility primarily deals with the travel barrier, in other
model) is moderately correlated with betweenness centrality words, distance plays a vital role in accessibility assessment.
and poorly connected with node degrees. Since closeness The entropy value of accessibility based on SNA shows a
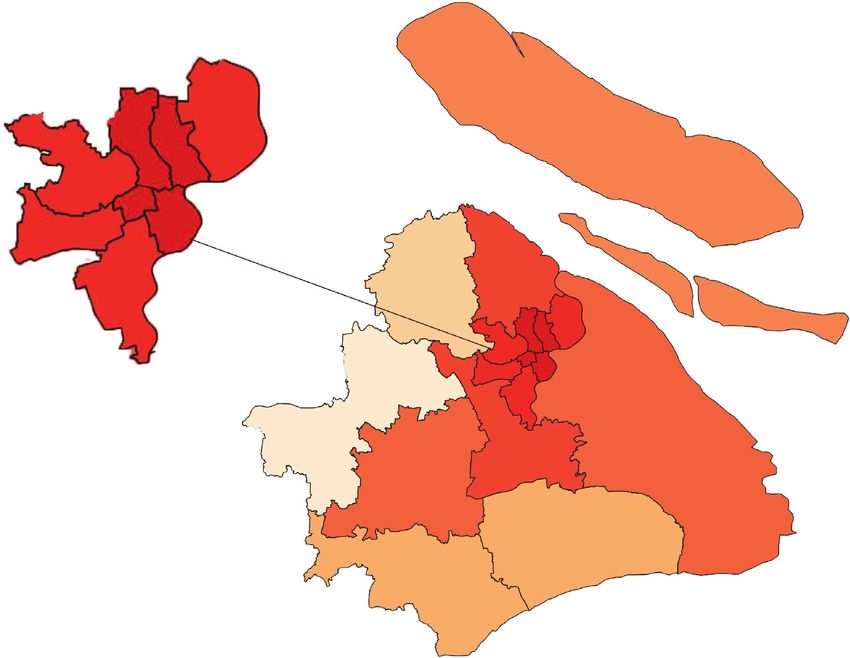
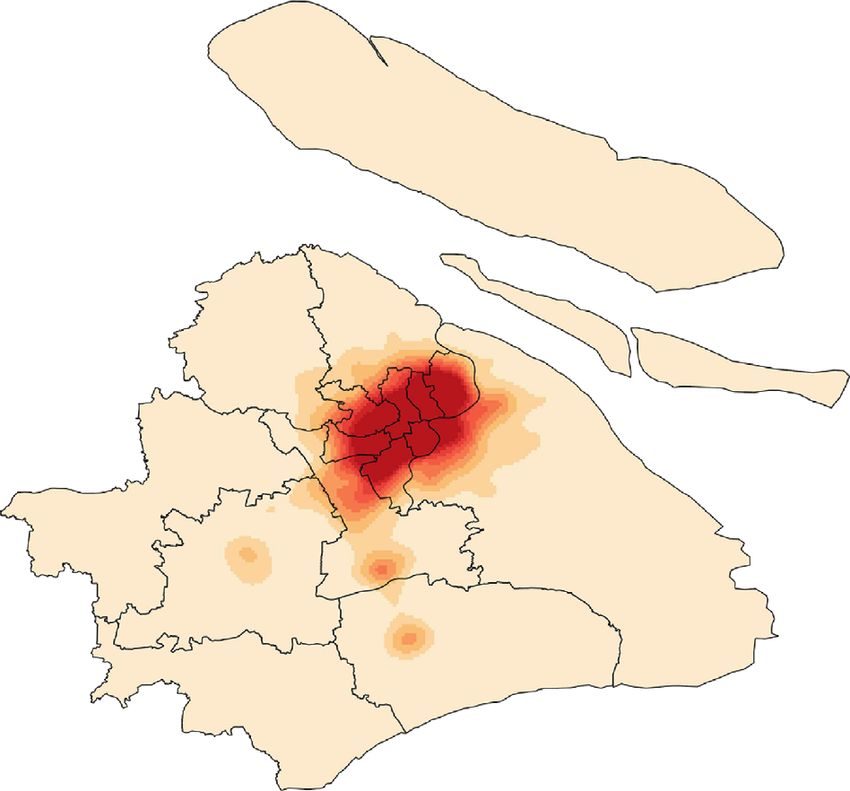
Journal of Advanced Transportation 11

 Accessibility Accessibility
 0.00 – 0.111 0.556 – 0.667 0.00 – 0.111 0.556 – 0.667
 0.111 – 0.222 0.667 – 0.778 0.111 – 0.222 0.667 – 0.778
 0.222 – 0.333 0.778 – 0.889 0.222 – 0.333 0.778 – 0.889
 0.333 – 0.444 0.899 – 1.00 0.333 – 0.444 0.899 – 1.00
 0.444 – 0.556 0.444 – 0.556
 (a) (b)

Figure 7: Accessibility map of the dockless sharing-bike network in Shanghai: (a) accessibility based on the SNA approach and
(b) accessibility based on the spatial interaction model.

relatively high correlation with that from the spatial inter- could be conducted to find the principal causes based on
action model. In this way, we could believe that this pro- accessibility results. Urban planners, policymakers, and
posed method could be complementary for accessibility bicycle suppliers could obtain information for optimization
assessment. These five indicators, as part of the accessibility decisions.
assessment, provide a more comprehensive perspective for
accessibility evaluation. Apart from the distance between
origins and destinations, the new method also pays attention 4.3. Model Evaluation. The five indicators and accessibility
to the characteristics of the dockless sharing-bike network values of each clustering zone based on the SNA approach
and considers the threshold of bicycle travel to determine are displayed in Figure 7(a). The accessibility measured by
whether the nodes are connected or not. Therefore, acces- the spatial interaction model is displayed in Figure 7(b),
sibility assessment based on the SNA approach could be which shows a similar distribution with closeness centrality.
more in line with reality. Its ability to evaluate the accessibility of the peripheral areas
 To be more intuitive for decision-makers, we display the is weak since it cannot reflect the differences of the pe-
accessibility of an administrative region, which was defined riphery. More abundant data may be required to support the
in this paper as the summary of accessibility of each traffic study of the entire region.
zone divided by the total number of traffic zones in this
administrative region. Then, the accessibility of each ad- 5. Conclusions
ministrative region in Shanghai can be seen in Figure 6.
From the figure, the accessibility of dockless sharing bikes in This paper investigated the problem of dockless sharing-bike
Jing’an District, Huangpu District, Hongkou District, and network accessibility from a network perspective. The SNA
Minhang District ranked the highest, which meant that it was applied to estimate the accessibility, considering the
was more convenient for passengers to use dockless sharing interaction barriers and the network structure of a bicycle
bicycles in these areas, that is, these areas were more friendly network. The developed methodology requires fewer data
to nonmotorized traffic. However, peripheral administrative and is easy to operate.
regions such as Jinshan District, Qingpu District, Jiading A dockless sharing-bike traffic network was founded on
District, and Chongming District were less accessible, in- the basis of a hierarchical clustering algorithm according to
dicating that nonmotorized transport in these zones was the geographical correlation of origins and destinations. The
underdeveloped. The results illustrated the unbalanced de- algorithm was based on the characteristic of bike users, who
velopment of nonmotorized transportation, which was would only be willing to find a sharing bike within his/her
primarily because of differences in infrastructure supplies, acceptable walking distance. Different from the k-means
bike numbers, and geographical locations. More research clustering algorithm, there is no need to assign a k-value in
12 Journal of Advanced Transportation

advance, which otherwise would result in excessive clustering characteristics of network topology, and more concentration
radius and inconsistency with user psychology. As a result, could be laid on the combination of different methods to
this algorithm clustered origins and destinations of bike travel understand and interpret the accessibility of a nonmotorized
from 20 million to approximately 8,000 sharing-bike traffic network thoroughly. Due to the limited data and time, the
zones, which were regarded as nodes of the bike network. research does not focus on the other modes and types of
Compared with POI data, these zone centers almost over- networks to verify the extrapolation of the accessibility
lapped with transit stops, schools, office buildings, shopping indicator weights. Based on collecting bike-sharing opera-
malls, etc., which indicated the reasonability of the algorithm. tion data in multiple cities, the future study can focus on
 An accessibility assessment model of sharing-bike net- extrapolating of the results.
work was constructed based on the SNA approach. Five
indexes of social network analysis were introduced to
evaluate accessibility, and the weight of each index was Data Availability
calculated according to their impacts on accessibility. This
 The data used to support the findings of this study are
method considered not only the spatial barrier between
 available from the corresponding author upon request.
origins and destinations but also focused on the node
connectivity from a network perspective, thus providing a
relatively comprehensive perception of sharing-bike net- Conflicts of Interest
work accessibility. The correlation analysis with the com-
monly used model (spatial interaction model) revealed that The authors declare that there are no conflicts of interest
there exist some correlations between SNA indicators and regarding the publication of this paper.
accessibility. Therefore, it is reasonable to apply the SNA
approach to assess the accessibility of sharing-bike network. Acknowledgments
The results suggested that the central districts like Jing’an,
Huangpu, Hongkou, and Minhang District in Shanghai have The authors acknowledge the data provided by Shanghai Big
higher sharing-bike accessibility than those peripheral ad- Data Joint Innovation Laboratory. Additional thanks go to
ministrative regions. Unlike other studies, the data required their supervisor Prof. Xiucheng Guo and Meina Zheng for
in this paper are easy to obtain as we could retrieve running insightful comments and suggestions on the interpretation
data from bike-sharing companies to do real-time com- of the whole paper. This work was supported by the Scientific
puting and present these results to both users and suppliers. Research Foundation for Advanced Talents of Nanjing
 This paper assessed and mapped the accessibility of the Forestry University (163106041), the General Project of
dockless sharing-bike network in Shanghai, and the main Philosophy and Social Science Foundation of the Jiangsu
work could be divided into two parts. A novel and promising Higher Education Institutions of China (2020SJA0125), and
perspective from SNA is proposed in accessibility assess- the General Program of the Natural Science Foundation of
ment by analyzing the relationship between accessibility and the Jiangsu Higher Education Institutions of China
different centralities. The objective of this paper is to provide (20KJB580013).
information for the optimization of sharing-bike network, so
accessibility was selected as an evaluation of a network
current status. The results of accessibility could provide References
information for both users and decision-makers. The real- [1] A. Pal and Y. Zhang, “Free-floating bike sharing: solving real-
time assessment could be completed to display immediate life large-scale static rebalancing problems,” Transportation
accessibility for users to judge which place nearby is of Research Part C, vol. 80, 2017.
higher accessibility. For urban planners, policymakers and [2] E. Fishman, “Bikeshare: a review of recent literature,”
bicycle suppliers could obtain information to identify areas Transport Reviews, vol. 36, no. 1, 2016.
where improving infrastructure investment and sharing [3] Y. Ai, Z. Li, and M. Gan, “A solution to measure traveler’s
bikes are of necessity, thus creating a user-friendly envi- transfer tolerance for walking mode and dockless bike-sharing
ronment for nonmotorized travel mode and improving a mode,” The Journal of Supercomputing, vol. 75, no. 6,
sustainable transportation system. As the primary travel pp. 3140–3157, 2019.
 [4] Z. Chen, D. v. Lierop, and D. Ettema, “Dockless bike-sharing
mode of nonmotorized traffic, sharing bikes are in line with
 systems: what are the implications?” Transport Reviews,
the concept of green travel and sustainable development. vol. 40, no. 3, 2020.
 One of the limitations of this paper is that the data were [5] S. Katja and S. Joachim, “Spatial and temporal analysis of bike-
collected in two weeks, which is not typical enough, and the sharing use in cologne taking into account a public transit
estimation model cannot be extended to other seasons. In disruption,” Journal of Transport Geography, vol. 92, 2021.
the future, it is essential to admit that one limitation of our [6] A. Kaltenbrunner, R. Meza, J. Grivolla et al., “Urban cycles
approach is that the two-week data used in our research were and mobility patterns: exploring and predicting trends in a
not typical enough. The characteristics of cyclists may vary a bicycle-based public transport system,” Pervasive and Mobile
little according to seasons, weathers, and holidays. Further Computing, vol. 6, no. 4, 2010.
investigations could be carried out to explore the thresholds [7] X. Zhou, “Understanding spatiotemporal patterns of biking
 behavior by analyzing massive bike sharing data in chicago,”
used in different parts. Additionally, the proposed accessi-
 PLoS One, vol. 10, no. 10, 2015.
bility assessment model is mainly based on the
Journal of Advanced Transportation 13

 [8] W. Manuel, “Taking one step further-advancing the mea- [29] J. Chen and Z. Chang, “Rethinking urban green space ac-
 surement of green and blue area accessibility using spatial cessibility: evaluating and optimizing public transportation
 network analysis,” Ecological Indicators, vol. 126, 2021. system through social network analysis in megacities,”
 [9] T. Litman, “Evaluating accessibility for transportation plan- Landscape and Urban Planning, vol. 143, 2015.
 ning,” Victoria Transport Policy Institute, vol. 49, 2016. [30] R. C. Hulst, “Introduction to social network analysis (SNA) as
[10] J. W. Weibull, “An axiomatic approach to the measurement of an investigative tool,” Trends in Organized Crime, vol. 12,
 accessibility,” Regional Science and Urban Economics, vol. 6, no. 2, 2009.
 no. 4, pp. 357–379, 1976. [31] T. Zuo, H. Wei, and A. Rohne, “Determining transit service
[11] J. Amila, P. K. S. Mahanama, and A. Chethika, “A modeling coverage by non-motorized accessibility to transit: case study
 framework: to analyze the relationship between accessibility, of applying GPS data in Cincinnati metropolitan area,”
 land use and densities in urban areas,” Sustainability, vol. 13, Journal of Transport Geography, vol. 67, 2018.
 no. 2, 2021.
[12] A. T. Murray and X. Wu, “Accessibility tradeoffs in public
 transit planning,” Journal of Geographical Systems, vol. 5,
 no. 1, 2003.
[13] T. Zuo, H. Wei, N. Chen et al., “First-and-last mile solution
 via bicycling to improving transit accessibility and advancing
 transportation equity,” Cities, vol. 99, 2020.
[14] M. Iacono, K. J. Krizek, and A. El-Geneidy, “Measuring non-
 motorized accessibility: issues, alternatives, and execution,”
 Journal of Transport Geography, vol. 18, no. 1, 2009.
[15] S. Zhang and Y. Zhang, Analysis of Network Accessibility,
 Springer, Cham, Switzerland, 2015.
[16] K. T. Geurs and B. v. Wee, “Accessibility evaluation of land-
 use and transport strategies: review and research directions,”
 Journal of Transport Geography, vol. 12, no. 2, 2003.
[17] W. Martin and K. T. Gordon, “Physical accessibility as a social
 indicator,” Pergamon, vol. 7, no. 5, 1973.
[18] J. A. Pooler, “The use of spatial separation in the measurement
 of transportation accessibility,” Transportation Research Part
 A, vol. 29, no. 6, 1995.
[19] W. G. Hansen, “How accessibility shapes land use,” Journal of
 the American Planning Association, vol. 25, no. 2, 1959.
[20] E. Otte, “Social network analysis: a powerful strategy, also for
 the information sciences,” Journal of Information Science,
 vol. 28, no. 6, 2002.
[21] D. M. Phillips and J. K. Phillips, “A social network analysis of
 business logistics and transportation,” International Journal of
 Physical Distribution & Logistics Management, vol. 28, no. 5,
 1998.
[22] S. R. Gehrke, A. Akhavan, P. G. Furth et al., “A cycling-fo-
 cused accessibility tool to support regional bike network
 connectivity,” Transportation Research Part D, vol. 85, 2020.
[23] Y. Zhiyan, L. X. Cathy, M. Nikola et al., “Inferencing hourly
 traffic volume using data-driven machine learning and graph
 theory,” Computers, Environment and Urban Systems, vol. 85,
 2021.
[24] M. Batty, “Accessibility: in search of a unified theory,” En-
 vironment and Planning B: Planning and Design, vol. 36, no. 2,
 2009.
[25] S. Chen, C. Claramunt, and C. Ray, “A spatio-temporal
 modelling approach for the study of the connectivity and
 accessibility of the Guangzhou metropolitan network,”
 Journal of Transport Geography, vol. 36, 2014.
[26] E. Rubulotta, M. Ignaccolo, G. Inturri et al., “Accessibility and
 centrality for sustainable mobility: regional planning case
 study,” Journal of Urban Planning and Development, vol. 139,
 no. 2, 2013.
[27] I. H. El-Adaway, I. S. Abotaleb, and E. Vechan, “Social
 network analysis approach for improved transportation
 planning,” Journal of Infrastructure Systems, vol. 23, 2016.
[28] G. Sarlas, A. Páez, and K. W. Axhausen, “Betweenness-ac-
 cessibility: estimating impacts of accessibility on networks,”
 Journal of Transport Geography, vol. 84, 2020.
You can also read