Monitoring and analysis of low-voltage network with smart grid architecture model by developing use cases
←
→
Page content transcription
If your browser does not render page correctly, please read the page content below
INTERNATIONAL JOURNAL ON SMART SENSING AND INTELLIGENT SYSTEMS
Article | DOI: 10.21307/ijssis-2021-004                                                              Issue 1 | Vol. 14 (2021)

Monitoring and analysis of low-voltage network with smart
grid architecture model by developing use cases

Haresh Kumar1,*, Jagdesh Kumar2
and Jherna Devi3
                                                Abstract
1
 School of Technology and
Innovations, University of Vaasa,               The objective of this paper is to show the characteristics of smart
Vaasa, Finland.                                 meters enabling to monitor and analyze the low-voltage (LV) network.
                                                This is achieved by developing use cases, where power quality and
2
 School of Technology and
                                                outage data are transferred from smart meters through distribution
Innovations University of Vaasa,
                                                network to the control center. To visualize the monitoring process of
Vaasa, Finland and Department
                                                LV network, the use cases are mapped into smart grid architecture
of Electrical Engineering, Quaid-
                                                model. The paper proposes a solution to analyze the LV network
e-Awam University of Engineering                interruption and power quality problems (over-voltage, under-voltage,
Science & Technology (QUEST),                   voltage sags, and swells). Thus, this paper provides a smart platform
Nawabshah, 67480, Sindh,                        for monitoring LV network.
Pakistan.
3
 Institute of Technology for                    Keywords
Nanostructures (NST) and Center                 Advanced metering infrastructure, Outage management, Power
for Nano Integration Duisburg-Essen             quality monitoring, Use cases, Smart grid architecture model.
(CENIDE), University Duisburg-
Essen, Duisburg D-47057, Germany
and Department of Information
Technology, Quaid-e-Awam
University of Engineering Science &        The rapid transition of smart meters from traditional meters has
Technology (QUEST), Nawabshah,             provided many benefits to utilities, distribution system operators (DSOs)
67480, Sindh, Pakistan.                    and customers. The customers can check the hourly consumption
*E-mail: hk.sangtani@gmail.com             data for electricity usage and control their energy usage by receiving
                                           tariff information. Smart meters enable DSO to get state estimation,
This paper is edited by
                                           interruption measurement, and asset management. The information
Subhas Chandra Mukhopadhyay.
                                           regarding interruption measurement can be gathered by deploying smart
Received for publication                   meters at the customer level and at the substation level, which reduces
September 04, 2020.                        the time at the control center to identify the affected power supply area.
                                               Initially, automatic meter reading (AMR) meters were deployed to read
                                           the electricity energy consumption with one-way communication for
                                           accurate billing, and for reducing the cost of labor for a meter reading.
                                           However, after the invention of advanced metering infrastructure (AMI),
                                           the smart meters with two-way communication participated in different
                                           operations, such as tamper detection, theft detection, managing peak
                                           demand, fault management, power quality monitoring, and network
                                           planning. The smart meters are a part of the AMI network that uses
                                           different information and communication technology (ICT) solutions
                                           to send and receive the data. The collected data can be analyzed
                                           and utilized for other purposes (data mining for smart home solution),
                                           consisting of consumption data, events and alarms (Wang et al., 2016).
                                               The interest of extended real-time monitoring for low-voltage (LV)
                                           network increased after the rapid growth in the penetration of distributed
                                           energy resources (DER) in the LV grid. Before integrating DER, the
                                           distribution companies were only interested in high voltage and medium

© 2021 Authors. This work is licensed under the Creative Commons Attribution-Non-                                          1
Commercial-NoDerivs 4.0 License https://creativecommons.org/licenses/by-nc-nd/4.0/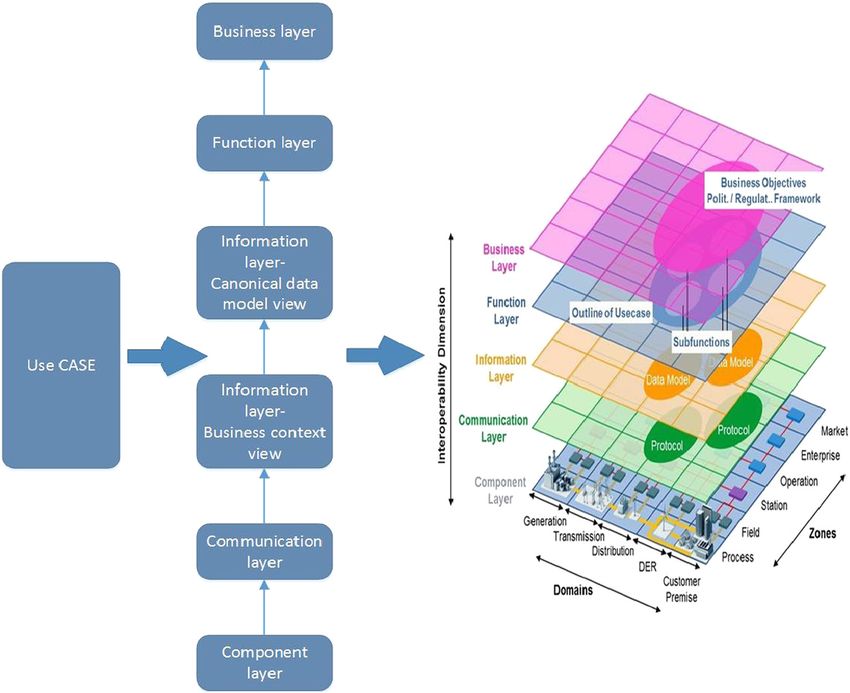
Monitoring and analysis of low-voltage network with smart grid architecture model by developing use cases: Kumar et al.
voltage level monitoring. Nowadays, smart meters are of data at different distribution network stages. The
used as an extended system of supervisory control smart grid architecture model (SGAM) framework is
and data acquisition system (SCADA) for monitoring introduced in this paper to cover use cases from the
and controlling of the end-points of the LV network technical, functional, and market point of view.
(customers). The deployment of smart meters has A use case is the best way of describing the
reduced the number of current sensors, which can goals and requirements of actors involved in the LV
be used at feeder level for real-time monitoring of the monitoring process. The mapping of use cases into
LV network. The current sensors solution is costly, the SGAM framework makes it easier to understand
and for accurate real-time monitoring, we need the functionalities and sub-functionalities of use cases.
voltage information as well, and voltage sensors This paper focuses on the use cases of power quality
will also increase the cost. Thus, a smart meter is a monitoring and outage identification, classification,
best-preferred solution for monitoring of LV network and management. The main objective of this paper
(Kauppinen et al., 2012). is to identify the outages and power quality problems
There are different types of meters available in the at the LV network and send this information to the
market, which are manufactured by different vendors control center with the help of developing use cases.
with different functionalities. In the INTEGRIS project The second objective of this paper is to select the
(Pikkarainen et al., 2013), two types of meters have communication infrastructures for use cases. To
been used: a smart meter (SM) and a power quality achieve the second objective, different communica
meter (PQM). The smart meter provides fundamental tion architectures used in various projects are re
quantities such as current, voltage, power, and viewed, and communication performance indicators
reactive power, while PQM offers information about (latency, throughput, the data rate per packet, and res
power quality problems such as flicker, harmonic ponse time) are compared to select communication
distortion, etc. The PQM information is not enough to infrastructure.
determine the power quality issues in the distribution This paper is organized into five sections,
network. Thus, the evaluation is required based on including Introduction. The second section explains
other measurement units, such as remote terminal the use cases of outage identification, classification
unit (RTU), SMs, and estimated values. From the and management, and power quality monitoring
power quality point of view, SM measurements with their LV network operation benefits. In the third
are providing only voltage level information. The section, the use cases are mapped into the SGAM
advantage of using PQM measurements over SM is framework with an emphasis on the implementation
that the PQM measurements give an indication of of communication media and protocols for LV
voltage dips, fuse blown, and interruption information network monitoring. The fourth section presents the
(Pikkarainen et al., 2013). discussion of this paper, and finally the last section
A centralized distribution network management summarizes this paper.
system is presented in the paper (Repo et al., 2011) for
LV network management. However, the centralized
distribution network architecture is shown in general. Use cases
The details about data type and its exchange For any system analysis, a use case can be used
between the systems involved in the distribution as a methodology to identify, clarify, and organize
network management system are not provided. For system requirements. In this paper, the use cases are
LV network management, the following questions are classified into two categories: outage identification
addressed in this paper: classification and management, and power quality
monitoring. These use cases are classified into
• How can smart metering data be utilized for two groups to know the interruption problems and
the use cases of the LV network? improve the quality of service by maintaining the LV
• What types of communication infrastructures distribution network’s reliability. Besides, to improve
are available for smart grid applications, and the network’s quality, network planning can be
which one is suitable for LV network? achieved more efficiently with the help of these use
• Which protocols and standards are available cases.
to support communication media of the use Before designing a use case, it is necessary to
cases? know each system’s functionalities involved in use
case design. Table 1 shows the systems with their
To address the above research questions, use description, which are employed in the use case
cases are designed to show the systematic analysis design.
2
INTERNATIONAL JOURNAL ON SMART SENSING AND INTELLIGENT SYSTEMS

Table 1. Systems and their description (Löf et al., 2011).

Systems                                                     Description

SCADA          The SCADA system is used at the control center for monitoring the data from field devices (RTU,
               current sensors, re-closers and breakers). The monitoring process is achieved by measuring the status
               of field devices and by forwarding this information to the distribution management system (DMS)
GIS            The GIS stands for the global information system. The GIS is a digital database that uses
               spatial coordinates as a primary source of data. A GIS collects and stores the data input (maps,
               coordinates) into the database, and after analyzing, it generates the report about power supply
               affected area (power quality and outage problems)
NIS            The NIS stands for the network information system. The NIS is a software-based platform that is
               responsible for networking planning, automatic mapping and information management. The NIS
               system holds information about network topology, transmission lines and protection devices of the
               distribution network
CIS            The CIS stands for the customer information system. The CIS consists of customer ID and customer
               meter number, physical addresses and phone numbers of customers. The CIS helps the utility
               company for billing and to network operating company for identifying the exact location of customer
               by generating a trouble call from a particular smart meter
OMS            The OMS stands for the outage management system, which analyses the outages at the customer
               level. The integration of OMS in the distribution network has reduced the outage cost and
               outage duration. The OMS receives the information from SCADA and DMS and starts the outage
               management process by obtaining the required data from other systems (GIS, CIS, and NIS)
DMS            The DMS uses different applications for monitoring and controlling the distribution network. The
               integration of DMS has increased the reliability and quality of the entire electric distribution network.
               The DMS receives the information from the customer level and the substation level, and after
               analyzing the whole network, it takes the decision. In some countries, the DMS and OMS are used
               as separate systems, but it is used as a single system in this research

    Two use cases are designed in this paper by                to DMS/OMS followed by different operating systems
integrating actors (customer, SM, PQM, Intelligent             between DMS/OMS and a smart meter. For single or
Electronic Devices (IEDs)) and these systems                   two-phase faults, it generates phase missing alarm
(SCADA, GIS, NIS, CIS, OMS, DMS). The first use                separately for each phase, and for three-phase fault,
case determines the outage problems, while the                 it generates the last gasp message alarm. The outage
second one focuses on power quality problems in the            information is confirmed by DMS/OMS with the help of
LV network.                                                    SCADA and CIS by checking the planned outages and
                                                               filtering out the events by knowing the issues in the
Use case of outage identification,                             distribution network. The following steps are required
                                                               for this use case:
classification, and management
This use case describes how the outage information                • A smart meter measures the voltage levels.
is received from a smart meter. The outage data can               • Smart meter generates the alarm for an out-
be exported to different systems for checking and                   age.
verifying outages in the distribution network.                    • DMS/OMS receives the information.
    In this use case, the smart meters periodically               • DMS/OMS confirms the outages by check-
measure the voltage and current at end-points                       ing planned/unplanned outages by employing
(consumers) of the distribution network. Regulators set             SCADA, CIS and NIS.
the threshold voltage levels to ensure the reliability of
a network and quality of electric supply. When voltage            To understand the procedure applied in the
levels change from the predefined value, smart meters          use case design in a visual format, some diagrams
generate events and alarms and send this information           are presented in figures. Figure 1 shows the data

                                                                                                                           3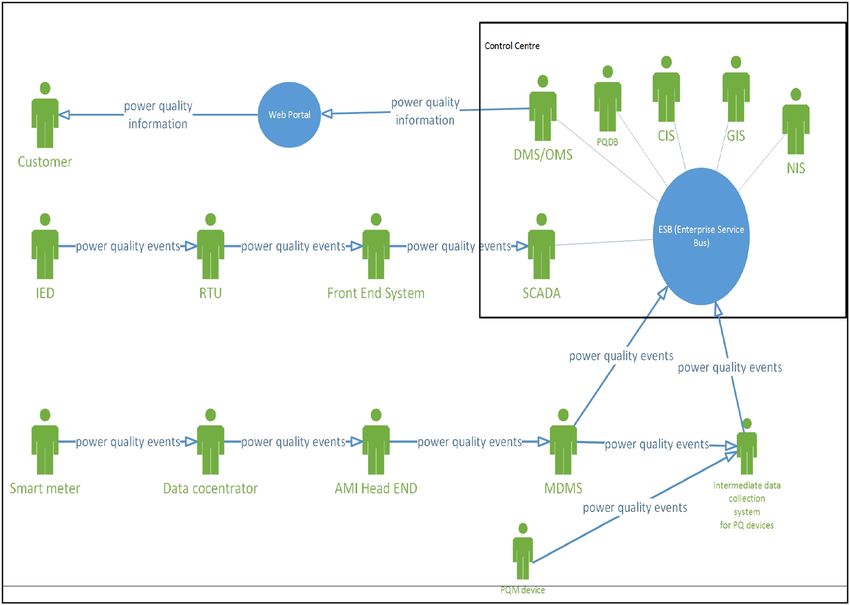
Monitoring and analysis of low-voltage network with smart grid architecture model by developing use cases: Kumar et al.
Figure 1: Outage management use case with associated actors.
transmission process from smart meters and in parallel to information from SCADA. Then, DMS/
from IEDs during outage events and the systems OMS identifies the planned and unplanned outages.
involved for data collection. Figure 1 depicts that For planned outages, DMS/OMS confirms the outage
a smart meter sends the outage information to the information (outage location and affected customers)
data concentrator (DC) during three-phase fault from GIS and NIS along with the information (data)
at the customer location, while an IED is placed at collected from SCADA and MDMS via ESB. In
the secondary substation, which sends the outage contrast, for unplanned outages, it only confirms
information to RTU during the fault at the secondary the outage location and affected customers from
substation. The outage information is transferred to GIS and CIS. The collected information (planned or
the control center from IEDs and a smart meter via unplanned outages) is then sent to the customer via
different information systems (RTU, front end system, the web portal. Moreover, queries are generated by
DC, AMI head end, meter data management system the control center for smart meters to ensure the
(MDMS), etc.), where further actions can be taken occurrence of the outage and its location.
based on the collected information. For sending Figure 3 depicts the query (ping) and response
outage information to the control center, an enterprise process for finding the outage’s exact location. At
service bus (ESB) is utilized which facilitates the first, the query is generated by DMS/OMS to MDMS
services of service-oriented architecture (SOA) and via ESB, and then this process is continued until
serves as an integrating bus for information systems getting the response of smart meters. For identifying
at the control center. To forward the outage data the fault at the customer level, an event is generated
from RTU to SCADA and then to DMS via ESB, the from DC, which can be used to distinguish the faults
front-end system, which acts as an interface between at secondary substations from the fault at the end
SCADA and RTU, is used. For notifying the customer customer. A ping request is then sent to all smart
about the cause and duration of the interruption, a meters for getting their acknowledgement signals to
web portal is utilized. confirm their online status. In this way, outage location
Figure 2 shows the sequence diagram, repre is confirmed by getting response or acknowledgement
senting the type of data exchange between different signals from smart meters, AMI head end, DC, MDMS,
systems and actors for sending outage information to and by getting information from CIS and GIS. After the
the control center. At first, the outage information is confirmation of the outage location, the information is
sent to DMS/OMS from different actors and systems updated on the web portal.
4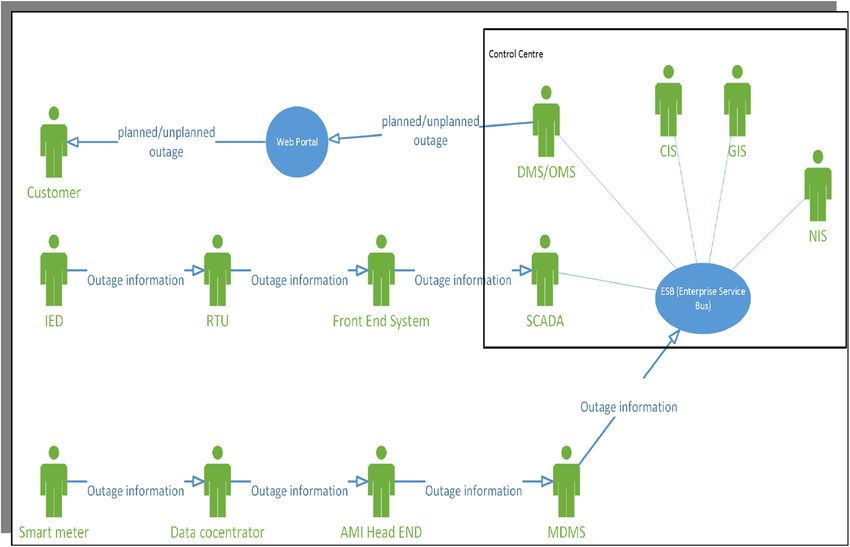
INTERNATIONAL JOURNAL ON SMART SENSING AND INTELLIGENT SYSTEMS

 outage information

                      smart                                                                                DMS/                                                              Web
  SCADA                                 DC           AMI HE          MDMS              ESB                                        CIS                   NIS           GIS
                      meter                                                                                OMS                                                              portal

                                               Outage
                                             information

                            Outage
                          information
                                               Outage
                                             information
                                                             Outage
                                                           information

                                                                           Outage
                                                                         information

                                                                                               Outage
                                                                                             information

                                                                                             check planned
                                                                                                  and
                                                                                               unplanned
                                                                                                outages

                                                                                               Planned Outage check

                                                                                                    planned outage?

                                                                                                           Yes/No

                                                                                                                   planned outage?

                                                                                                                       Yes/No

                                                                                               Outage confirmation

                                                                                              if the outage is planned

                                                                                         planned outage

                                                                                                                                                 Outage information

                                                                                              For unplanned outage

                                                                                         customer ID and
                                                                                             location

                                                                                                        customer
                                                                                                    id/meter number

                                                                                                             get

                                                                                                                    co-ordinates of customer location

                                                                                                                                     get
                                                                                         unplanned
                                                                                          outage

                                                                                                                                               Outage information

                        Figure 2: Outage management sequence diagram.

   This use case visualizes how different participants/                                                    Furthermore, the collected metering data at DC can
stakeholders can observe the process of identification,                                                    be utilized for different purposes, such as intelligent
classification, and management of fault at LV network.                                                     algorithms (estate estimation and voltage control) can

                                                                                                                                                                                     5
Monitoring and analysis of low-voltage network with smart grid architecture model by developing use cases: Kumar et al.
Ping response to find outage location
during unplanned outage/Number of affected
customers due to outage
smart AMI Head DMS/ Web
DC MDMS ESB CIS GIS
meter End OMS portal
Feeder check
Ping request
Ping request
Ping request
Ping request
Ping request
Response/
no response
Response/
no response Response/
no response
Response/
no response
Response/
no response
affected
customer
information
meter id of
non-responding
meters
get
location of affected meters
get
outage
information
inform the customer about outage
Figure 3: Outage management sequence diagram (ping response).
be implemented for the self-healing of LV network to DMS and to power quality database. In this use
which can be applied at the secondary substation. case, the PQM device measures the power quality
quantities (voltage dips, flicker and harmonics) at
Use case of power quality the substation level, and sends this information to an
intermediate data collection system for power quality
In the transmission of power from generation to (PQ) devices. Moreover, the PQM device measures
consumption, the power quality is affected due to other quantities, such as; fuse blown, an indication of
various factors, such as weather, transmission cables, voltage dips, and interruptions for 10 min interval. The
failure of protection devices, the malfunctioning of intermediate data collection system for PQ devices
devices, overloading, disturbances from the customer, receive the power quality information from all other
switching off equipment, distortion factors, etc. This PQ devices installed at the LV network and sends the
use case illustrates how smart meter data is used to collected information to MDMS.
analyze the power quality problems at the LV network. For monitoring the power quality in the MV
The power quality events based on voltage network, the RTU provides phase voltage unbalance,
thresholds are defined by standard EN 50160. The phase voltage level, and total harmonic distortion of
purpose of this use case is to transfer the power phase voltage information. These measurements are
quality events or alarms generated by a smart meter taken approximately every 1.5 min and transferred to
6INTERNATIONAL JOURNAL ON SMART SENSING AND INTELLIGENT SYSTEMS
the 10-min average value for power quality monitoring The sequence diagram in Figure 5 explains how
purpose (Pikkarainen et al., 2013). power quality information is checked at the feeder and
The consequences of power quality problems are substation levels. If power quality issue is identified
economic losses. It was found that 90% of losses (pro at feeder level, the number of affected customers
duction loss, equipment loss, work costs, labor costs, on that feeder is recognized, and this information is
monetary losses due to replacement of system devices) transferred to the web portal. If power quality issue
were observed for the industry sector. Thus, power affects several feeders, the power quality information
quality is a significant issue that has a considerable is determined at the substation level, and this infor
impact on the economy (Amaripadath et al., 2017). mation is transferred to the web portal. For this
Figure 4 shows how power quality data is purpose (identifying power quality issue at the feeder
transmitted from smart meters and from IEDs to or substation level), DMS/OMS defines the threshold
control center. As compared to the previous use values and gets the information from PQDB.
case, here an additional PQM device is used which The advantage of this use case is that it provides
measures the power quality from substation level. power quality information from the LV network and
To avoid the congestion of power quality data, an shows the relationship between different power
intermediate data collection system for PQ devices quality measurement devices and field devices (RTU,
(PQDB) is used in this use case which gathers the SCADA) of the distribution network. This use case
power quality data from MDMS and PQ devices. can be utilized for determining the network-holding
After collecting the power quality data, the PQDB capacity.
sends this information to the control center, where
DMS/OMS identifies the power quality issues in the ICT solution for use cases
distribution network and updates this information on
the web portal to inform the customer. The ICT solution defines the requirements and
The sequence diagram of this use case is different conditions for integrating different actors and systems
from the previous use case because two additional used in the use cases. To achieve the integration
actors (PQM device and PQDB) are used to measure requirements and meet the goals of use cases, it is
and collect power quality information. required to design the use cases so that its scope and
Figure 4: Power Quality use case with associated actors.
7Monitoring and analysis of low-voltage network with smart grid architecture model by developing use cases: Kumar et al.
Power Quality
PQM Smart AMI DMS/ Web
SCADA MDMS ESB PQDB
PQDB CIS GIS
device meter HE OMS portal
Power Quality Events
Power Quality Events
Power
Quality
Events Power
Quality
Events Power
Quality
Events
Power
Quality
Events Power
Quality
Events
check power
quality
affected
locations
Power Qulaity check at feeder
Does the power quality
match the
required level of threshold
Yes/No
Power quality confirmation
at feeder level
If power quality does not
match with threshold at
feeder
Power quality confirmation
at substation level
Does the power quality
match the
required level of threshold
Yes/No
else The power quality matches at feeder and
only paticular customers are affted
customer
id/meter number
get
co-ordinates of customer location
get
Inform the customer about power quality
Figure 5: Power quality sequence diagram.
8INTERNATIONAL JOURNAL ON SMART SENSING AND INTELLIGENT SYSTEMS
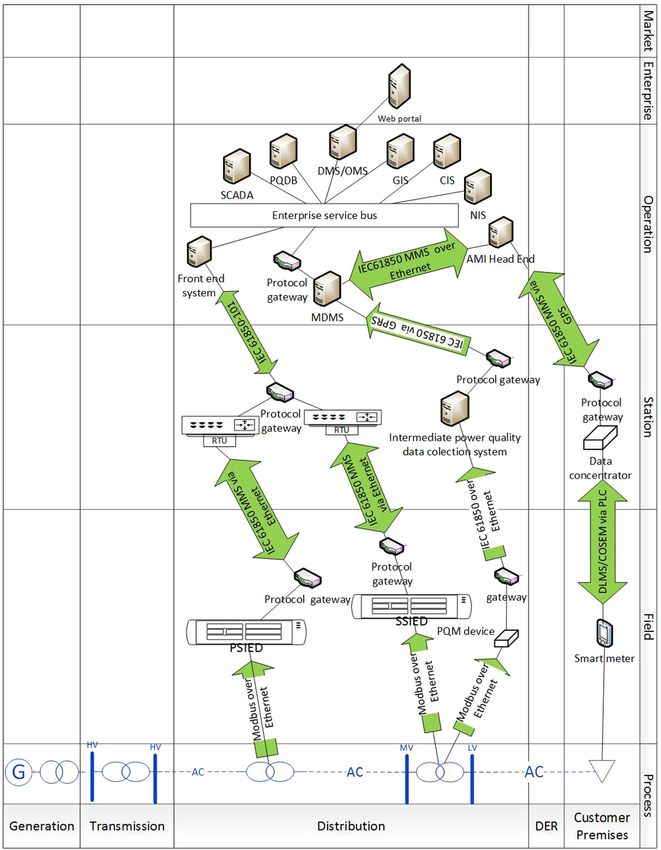
objectives would be clearly defined. For this purpose, the top to bottom approach, a general or high-level
the SGAM framework is used, which explains ICT use case is described, and the use case’s concrete
solution behavior in a physical distribution system. implementation is unknown. The mixed approach is
The SGAM provides the most straightforward way the combination of both approaches, and it does not
to illustrate the smart grid-related functionalities and follow any sequence in the mapping process of use
explains how three-dimensional (zone plane, domain case. In the mixed approach, each layer is designed
plane, and interoperability layers) architecture is used randomly, unlike top-bottom and bottom-to-top app
to describe the use case and sub functionalities of roaches that follow the designing sequence. In the
the use case in a pictorial form. The domain (one- mixed approach, at first component and business
dimensional smart grid plane) shows the stages layers are developed, and then the function layer
involved in the transmission of electrical energy from is created based on the information and needs
generation to customers, while zone shows how the of the business layer. In the end, information and
management of power system is divided hierarchically communication layers are developed (Radi et al.,
into six zones, namely, process, field, station, ope 2019). In this paper, the bottom to top approach is
ration, enterprise, and market. The interoperability applied (e.g. start mapping use cases into SGAM
layers represent how devices and communication from component layer to the business layer) to meet
technologies are integrated that belongs to different the business objectives (monitoring of outage and
layers of interoperability (Bruinenberg et al., 2012). power quality problems at LV network) of use cases.
There are three approaches for mapping the The bottom to top approach is applied here because
use cases: top-bottom, bottom to top, and mix data are generated from smart meters and from
approach. The difference between the bottom to IEDs, which is forwarded to DMS/OMS for further
top and top to bottom approach is that the bottom actions. In the mapping process, smart meters,
to top approach is preferred for the technical imple IEDs and PQMs are placed at the component
mentation of a specific use case which meets the layer, while DC, PQDB and RTU are placed at the
one or two business objectives. On the contrary, in communication layer of SGAM. Figure 6 describes
Figure 6: Mapping of use case into SGAM (Radi et al., 2019).
9Monitoring and analysis of low-voltage network with smart grid architecture model by developing use cases: Kumar et al.
the systematic mapping of a use case into the SGAM and discussion is carried out to select suitable commu-
framework. nication infrastructure for the use cases of this paper.
For LV network monitoring, the deployment of The communication layer (the second layer of
communication infrastructure and how different com- SGAM) describes in what fashion or how different
ponents communicate are big decisions. For a com- devices are connected and which communication
munication system, secure data and reliable high- technologies, communication protocols are used
speed information transfer are essential parameters (Uslar et al., 2019). For the use cases of this paper,
that should be effectively managed by a smart power the communication layer is designed to map the use
network (Sharma et al., 2019). In this section, different cases into the SGAM framework and to visualize the
communication technologies, communication proto- integration process of different actors and systems,
cols and communication infrastructures are presented, which is shown in Figure 7.
Figure 7: Communication layer (Uslar et al., 2019; Neureiter et al., 2015).
10INTERNATIONAL JOURNAL ON SMART SENSING AND INTELLIGENT SYSTEMS
Figure 7 depicts the mapping of the use cases of PLC compared with wireless solutions is that it is
into SGAM layers. The communication media and likely to fail in the case of fault at the feeder (e.g., short
communication protocols used in the mapping pro circuit fault). In contrast, wireless communications do
cess are explained in detail in this section. not rely on feeder cables as their propagation medium
(data transmission medium) (Grilo et al., 2017).
PLC is the cheapest solution because it sends the
Communication technologies
data over power lines. There might be a need to build
There are many telecommunication technologies used new infrastructure (in some areas), but there is no
for LV network monitoring, and these technologies need to buy a licensed frequency spectrum or deploy
are typically differentiated by a transmission medium. the communication network. PLC consumes more
These communication technologies are divided into power of the battery of a smart meter, and it reduces
wired and wireless communication (Andreadou et al., the life span of the battery, which increases the
2016; Vikram and Sahoo, 2017). maintenance cost of a smart meter in case of outage
alarm. For an outage alarm, a smart meter needs a
lot of power to transmit signals over power lines.
Wired communication
The wired technologies provide reliability and Optical fiber communication: This technology is widely
security and allow higher communication capacity, used for interconnecting substations with the control
but they are more expensive to implement in vast center. One of the barriers to adopting this technolo-
areas. As compared to wireless technologies, wired gy is its installation cost. Otherwise, this technology
technologies are characterized by the higher cost of provides many benefits compared to other wireless
construction and low latency (Chaves et al., 2018). A technologies (Long-Term Evolution (LTE)). This tech-
few examples of wired technologies are power line nology has a higher bandwidth for two-way czommu-
communication (PLC) and optical fiber cable etc. nication in AMI applications, and another advantage
is its robustness against electromagnetic and radio
PLC: PLC is widely used for data transmission bet interference.
ween smart meters and DC. In PLC, the data are
transmitted over existing power lines, which reduces Wireless communication
the cost of deployment of cables (there is no need
for any infrastructure for data transmission). The PLC The wireless communication provides faster data
technology is classified into broadband PLC (BB-PLC) transmission than wired communication. Several
and narrowband (NB-PLC). In narrowband PLC, the improvements have been made in wireless communi
data are transmitted via a narrow frequency band at cation technology, such as data rate, capacity,
a low bit rate. Typically, NB-PLC is preferred for home bandwidth, throughput, security, and latency, making
automation and usually applied as a communication it a preferable solution for the distribution network. The
link between SMs and DC. Though BB-PLC operates key points that are considered for wireless commu
on the hundreds of Mbit/s (data rate) with an nication for longer distance are latency and throughput
operating frequency of 2 and 30 MHz, and it is used (Rathee et al., 2020; Sharma et al., 2019). Table 2
as a communication media between medium voltage shows the comparison of different communication
(MV) & LV distribution network for data transmission technologies (wired and wireless) concerning the data
between substation and control center (Andreadou rate and coverage.
et al., 2016). After knowing the data range (data rate) and
Due to limited coverage of PLC, several repeaters coverage requirement of different communication
are connected for data transmission between SMs technologies, DSO can choose the communication
and DCs depending upon the distance between the technology based on its application for the distribution
smart meter and DC. The selection of communication network.
media also varies for the number of connected SMs
per DC and environment type (rural, urban, and Application of communication
suburban). In addition to limited coverage, the two technologies in one case study
drawbacks of PLC are electric signal attenuation and
random interference (Panchadcharam, 2012). The Nowadays, the choice of communication technology
data rate of PLC is traditionally minimal, although this in terms of requirements set by DSO for the power
has been improved with more modern standard (PLC system is a challenging task. As the number of smart
PRIME) (Kauppinen et al., 2012). The disadvantage meters is increasing, the generated data from SMs
11Monitoring and analysis of low-voltage network with smart grid architecture model by developing use cases: Kumar et al.
Table 2. Comparison of communication technologies (Kuzlu et al., 2014).
Coverage Cover
Data rate (max. Data rate
Technology Standard/Protocol range age range
theoretical) (average)
(theoretical) (NLOS)
Wired communication
PLC Narrowband 10–500 kbps 21–128 Kbps Up to 3 km
Broadband 500 Mbps 100 Mbps 1–3 km
Fiber Optic SONET/SDH 10 Gbps NA Up to 100 km
WDM 40 Gbps NA Up to 100 km
Wireless communication
WLAN 802.11x 2–600 Mbps NA Up to 100 m
WIMAX 802.16 75 Mbps 40 Mbps Up to 50 km 1–5 km
Cellular 2 G (GSM, CDMA) 14.4 Kbps 9.4–14.4 kbps Up to 50 km 1–10 km
2.5 G (GPRS) 144 Kbps 30–40 Kbps 1–10 km
3 G (UMTS, Edge, CDMA Up to 2 Mbps 200–400 Kbps 1–10 km
2000 1*EV-DO/DV)
3.5 G (HSPA) 14 Mbps 5 Mbps 1–10 km
4 G (LTE) 100 Mbps 33 Mbps 1–5 km
rises as well. In real-time operation, the response time, requirement of Table 3 with Table 4 by considering
latency, and throughput are the key points for analyzing throughput and latency values. The throughput for
faster data transmission (Poongodi et al., 2019). GRRS over UDP and TCP is 21–22 kbps. According
One scenario (outage alarm) is taken from the thesis to Table 3, this data rate requirement (21 kbps) is used
(Panchadcharam, 2012), where three technologies for 800 smart meters with the minimum response
(PLC, Universal Mobile Telecommunications System time of 3 min. The GPRS can support 800 smart
(UMTS) and Global Positioning Radio System (GPRS)) meters with this throughput (21 kbps) requirement.
are compared in terms of high-speed communication. For beyond and below to these requirements (if we
These communication technologies are compared by increase or decrease the number of smart meters
considering DSO’s requirements in (Panchadcharam, and response time), the GPRS is not a valid option for
2012) for the scenario of outage alarm shown in Table 3. communication technology.
Table 3 presents the performance of commu The selection of communication technology (based
nication technologies for the outage alarm. It can be on the different number of SMs and response time)
seen from Table 3 that as the number of meters is keeps the following conditions:
increased, the required data rate per packet is also
increased exponentially. Suppose, for 200 smart • If the requirement for sending an alarm to the
meters, and a response time of 5 s, the data rate per SCADA system is within 3 min for 10,000 me-
packet is 191 kbps. To keep the same response time ters, UMTS over UDP and PLC can be used.
by doubling the number of smart meters (400 smart • PLC is the only solution for 10,000 meters if
meters), the data rate should also be increased two response time is 30 s (Panchadcharam, 2012).
times. Table 4 shows the throughput and latency
requirements of different communication techno Different communication architectures are stu
logies over transmission control protocol (TCP) and died for deciding the suitable communication infra
universal datagram protocol (UDP). structure for the use cases of this paper. Kuzlu et al.
The appropriate communication technology (2014) have identified three types of communication
is chosen by matching the data rate and latency architectures based on reviewing the architectures
12INTERNATIONAL JOURNAL ON SMART SENSING AND INTELLIGENT SYSTEMS
Table 3. Comparison of response time with data rate for the number of smart meters
(Andreadou et al., 2016).
Response Response Response Response Response Response Response
time (5 s) time (30 s) time (3 m) time (5 m) time (15 m) time (1 h) time (12 h)
Data Data Data Data Data Data Data
Smart rate per rate per rate per rate per rate per rate per rate Per
meters packet packet packet packet packet packet packet
(kbps) (kbps) (kbps) (kbps) (kbps) (kbps) (kbps)
200 191 32 5 3 1 0 0
400 382 64 11 6 2 1 0
600 573 96 16 10 3 1 0
800 764 127 21 13 4 1 0
1,000 955 159 27 16 5 1 0
5,000 4,776 796 133 80 27 7 1
10,000 9,552 1,592 265 159 53 13 1
Table 4. Comparison of various communication technologies based on throughput
and latency (Vikram and Sahoo, 2017).
UDP TCP
Communication Media Throughput Latency Throughput Latency
GPRS 22 kbps 6 sec 21 kbps 10 s
UMTS 363 kbps 102 ms 239 kbps 311 ms
PLC 50.3 Mbps 3.1 ms 13.4 Mbps 95 ms
used in different projects. The first architecture is architecture is the gateway, and the lower number of
direct communication through a mobile network communication infrastructure deployments employ
operator. The second architecture adopts PLC/ the peer-to-peer (P2P) or wireless architecture. The
broadband over power lines (BPL) gateway, and following reasons are given for selecting the specific
the third one uses a PLC/BPL DC. For selecting the deployment of communication architecture:
most suitable communication architecture of this
paper, the technical and functional points of view are • In terms of sufficient network quality of the mo-
covered for three types of architectures. In addition bile network, wireless technology is the most
to technical and functional point of views, the straightforward technique. Still, this network
advantages, limitations, and usage of architectures has several legal and organizational issues that
in different projects are also discussed. Chren et al. can be solved in cooperation with a mobile
(2016) have concluded that the most adopted dep network operator.
loyment of communication infrastructure is based on • As compared to wireless technology controlled
DC-based architecture. The second most adopted and managed by a mobile network operator,
13Monitoring and analysis of low-voltage network with smart grid architecture model by developing use cases: Kumar et al.
the DC infrastructure is owned and operated • The most problematic architecture from the
by DSO, which makes it more challenging from technical point of view is the gateway architec-
the technical point of view. One reason for us- ture, because of its communication media (PLC/
ing DC is that it adds more functionalities (de- BPLC or mobile network), which impacts other
centralized automation, data mining), to make systems. This is the second most deployed ar-
the distribution network smarter. chitecture in different projects. Table 5 shows
Table 5. Comparison of different architecture styles for AMI applications
(Chren et al., 2016).
Communication
Advantages Disadvantages Risks
technology
Direct Direct communication (GPRS, High demand for mobile Difficult to switch mobile
Communication code division multiple access, network infrastructure for data operator (all communication
(Mobile Network LTE) over a mobile network collection and control models and meter points will
Operator) be changed)
Simple for monitoring Part of the responsibilities are Most of the communication
and management of AMI handled by a mobile operator technologies are owned and
infrastructure managed by the third party
The quality of the network will Legal and organizational
be lower if there is not sufficient issues because of cyber
coverage of mobile signal and security laws in some
a local gateway is used countries
This communication architecture
does not support local control/
(decentralized control at the
secondary substation). In this
case, the data are collected
at the control center and
transmitted to local control
Communication Hybrid communication More challenging and The volume of the
using PLC/BPL DC infrastructure (PLC/BPLC demanding from monitoring communication on the PLC/
is used for communication and infrastructure point of view BPL layer is not significant
between SMs and DC, while from the economic point
a mobile network is used of view, which involved
between DC and control higher cost in building
center) and maintaining the
communication infrastructure
Security weakness due to
the availability of temporary
data storage at DC
Communication The operator communicates The speed, reliability and The gateway only responses
using PLC/BPL with SMs through a gateway latency of communication the request between SMs
Gateway (PLC communication is used channels are affected due to and control center, and
between a gateway and SMs, dynamic route of connection does not store any data
and wireless communication between PLC and mobile
is used between a gateway network
and operator)
The gateway can be placed
either at local control (secon
dary substation) or at home
14INTERNATIONAL JOURNAL ON SMART SENSING AND INTELLIGENT SYSTEMS
the comparison of different architectures for protocol. The DLMS/COSEM works on the client/
AMI applications concerning their advantages, server-based architecture (meter acts as a server, and
disadvantage and risks. DC acts as a client) and operates on the application
layer (an upper layer of the OSI model). Each layer of
Considering these points (different communication the OSI model performs different tasks, and lower
infrastructures used in different projects and com layers of the OSI model provide services to an upper
parison of various communication technologies), the layer. The type and the number of lower layers are
PLC technology is used in our use cases for the dependent on the used communication media (Dedé
data transmission between smart meters and DC. et al., 2015).
In contrast, wireless communication technology is In smart metering applications, the DC polls the
chosen between DC and control center. This hybrid smart meters for data acquisition. Like poll command,
communication infrastructure is selected by keeping the push command is also introduced in DLMS/
the limitations of PLC and the cost of infrastructure. COSEM for the event notifications. The notification
After selecting the communication media for this of events generated by smart meters can be sent
paper’s use cases, the next step is to identify the to DC without any ping request created by DC. As
protocols that support the data transmission process. compared to report service approach used by IEC
61850, this approach performs the same actions
(Dedé et al., 2015).
Communication protocols and standards
The communication protocols define the set of rules Modbus
for data transmission among different devices in the
communication network. The communication protocol Modbus (an application layer communication protocol)
supports devices from different manufacturers with belongs to the family of field bus protocols, and they
various specification to share the information in the are widely used in industrial automation applications.
same language. Most of the communication protocols The Modbus supports the communication between
follow the open system interconnect (OSI) model layer RTU, meters and other field devices via a serial line,
structure. The OSI model consists of seven layers and it uses the recommended standard (RS-485 or
that illustrate how data are processed from each layer RS-232) for data transmission. Modbus communication
and each layer’s function during data transmission. is possible by master/slave architecture in which the
The data transmission can be serial, parallel, or peer- master sends the request and slave responds to the
to-peer communication, and it depends upon the request (Camachi et al., 2017).
supporting protocols, bandwidth, communication
channel, and supporting communication media. This
section gives the brief introduction of communication
IEC 61850
protocols that support the selected communication The IEC 61850 is the international standardized
infrastructure employed for the use cases of this protocol (object-oriented standard) used for substation
paper. automation communication. The advantage of using
IEC 61850 is that it provides an abstract data model
DLMS/COSEM protocol and an abstract communication interface. The IEC
61850 is the part of the IEC technical committee (TC
DLMS stands for device language and message 57) reference architecture that defines the standardized
specification, while COSEM stands for companion names, the meaning of data, device behavior models,
specification for energy metering. The DLMS and and abstract services (Camachi et al., 2017).
COSEM are two different standards used together The IEC 61850 is also used beyond the substation
(DLMS/COSEM) as a communication protocol for such as communication for wind and hydroelectric
meter data exchange. The DLMS (IEC 62056-53) power plants. IEC 61850 can be mapped into manu
is the suite of standards maintained by DLMS user facturing message specification (MMS) protocol (an
association that provides the interoperable en OSI protocol that runs over TCP/IP, where IP stands
vironment for meter data exchange, while COSEM for internet protocol. Moreover, it also provides the
(IEC 62056-62) is an object-oriented model for meter interoperability between IEDs which are manufactured
communication interface that gives the complete by different vendors (León et al., 2016).
description of functionalities and carries the set of The interface model of IEC 61850 is broken
specifications. The specifications of COSEM are used down into logical devices and further divided into
to define the transport and application layer for DLMS logical nodes. Before exporting the data from RTU to
15Monitoring and analysis of low-voltage network with smart grid architecture model by developing use cases: Kumar et al.
SCADA, the data sets are defined, which reflect that services are mapped into MMS protocol using over
what kind of services are subscribed by a client. Both TCP/IP of OSI model and running over layer three
DLMS/COSEM and IEC 61850 can be compared in on ethernet (a popular local area network protocol).
terms of transporting information for smart metering The preferable solution for MMS is to use it for data
application (Dedé et al., 2015). communication between field devices and from DC
The IEC 61850 supports different types of me to AMI head-end (León et al., 2016).
ssages from different performance classes, and they
are mapped to different protocols. The grouping of CIM
messages is based on the specific requirement
of the message type. In other words, the message The CIM stands for common information model, and it
of the same requirements is grouped and mapped to is an object-oriented data model in the power system.
the same message type protocol (Kuzlu et al., 2014). CIM is used to define the object classes, object
Figure 8 shows the message type grouping and their attributes, and the relationship to other classes.
mapping into different protocols. It is used as a common data exchange model for
application integration. In other words, it is used for
IEC 61850 MMS the exchange of information (information about the
configuration and status of the network) between
MMS defines the set of encoding rules for mapping applications in operation and business layers of
the messages to bits or bytes during transmission. SGAM. CIM is not a database, but it is a method for
MMS operates over client-server architecture and storing and organizing the data. For standardized
supports the services of IEC61850. The IEC 61850 communication between different communication
Figure 8: Message type grouping of protocols for IEC 61850 suit (Arnold et al., 2010).
16INTERNATIONAL JOURNAL ON SMART SENSING AND INTELLIGENT SYSTEMS
systems, CIM defines the semantics for all CIM at DMS or at the SCADA system, which depends
supported communication systems. The standards on the architecture (topology) and the length of the
that come in CIM category are IEC 61968 and IEC network.
61970 (Arnold et al., 2010). Table 6 shows the specific A DSO can prioritize the alarms, and one example
application of different standards. of prioritization of alarm is set by Elenia Oy in Finland,
which is described below.
The priority is given to the phase missing alarm
Discussion
(phase fault) when the phase fault is identified. The
The smart meters generate different events; some are second priority is set for an asymmetrical voltage
set by DSO and some by the manufacturer. These alarm that indicates the neutral conductor fault. The
events are meter/device status events (last gasp or third priority is given to phase unbalance voltage
power store), meter temper flags, and meter hardware alarms (Kauppinen et al., 2012).
information (low battery alarms, battery critical). Besides For finding the exact fault location or affected
these events, there are alarms which are generated smart meters, queries are generated. The queries are
based on voltage threshold levels set by DSO. These created by a system operator and can be classified
alarms are as follows: phase missing, neutral conductor as manual, semi-automatic and fully automatic. The
fault, asymmetrical voltage, and voltage unbalance manual query can be sent by DMS/OMS to smart
(over and under voltage) (Repo et al., 2011). meters at any time. The semi-automatic query is
The unnecessary alarms (alarm followed by generated after receiving the alarm notification. These
another alarm) must be avoided and prioritized quarries are created to know the meters’ status
before sending it to DMS. The unnecessary alarms (either meters are on the same feeder or different
create overwhelming data that produce congestion feeders). On the other hand, the fully automated
in the communication network and increase data queries are used for a weak network; an automated
transfer power consumption. To avoid unnecessary query is issued at least once in a day for analyzing
alarms, the alarm filtration algorithm can be utilized the network (Kauppinen et al., 2012). When a query
Table 6. Standards, along with their application and comments as applied in SGAM
(Arnold et al., 2010).
Standard Application Comments
DLMS/COSEM This standard is mainly used to support communication between DLMS User group
smart meters and DC. A few applications of this standard are:
electricity meter data reading and exchange, support of outages and
power quality alarms, tariff and load control
IEC 61850 This standard was first designed to provide the communication This standard is
between substations, and now it is used for the communication open, maintained and
between the control center and substation for monitoring and developed by IEC
controlling purpose. However, it can also be used beyond substation
communication. For example; for communication between DERs
and substation, but these protocols or standards are still in practice
IEC 61968/61970/ These standards are used to define the systemic model for data These standards are
IEC62325 suite exchange. The IEC 61970 is used for interface-related application open, maintained and
(CIM) and the energy management system, while IEC 61968 is used to developed by IEC
transfer information between different systems at the control center.
For the data exchange to DSO and energy markets, IEC 62325
standard is used
IEC 62351 This standard is used to define the information security for data This standard is
exchange and power control-related operations open, maintained and
developed by IEC
17Monitoring and analysis of low-voltage network with smart grid architecture model by developing use cases: Kumar et al.
is created by DMS and received by smart meters, the List of Acronyms:
following responses can be seen by smart meters:
• AMI= Advanced Metering Infrastructure
• Device responding (no alarm). • AMR = Automatic Meter Reading
• Device responding (active alarm). • CIM= Common Information Model
• Device not reached (due to communication • BPL= Broadband Power Line
network problem or fault in the network). • CIS= Customer Information System
• Device unknown (no record of a device in the • COSEM= Companion Specification for Energy
database). Metering
• Device switched off (switched off due to fault • DC= Data Concentrator
or customer has not paid the bill) (Repo et al., • DER= Distributed Energy Resources
2011). • DLMS= Device Language and Message Spec-
ification
• DMS= Distribution Management System
The designing of use cases and then mapping them
• DSO = Distribution System Operator
into the SGAM framework is the main contribution
• ESB= Enterprise Service Bus
of this paper. Moreover, this research paper will help
• GIS= Global Information System
the network operating company and DSO to design
• GPRS= Global Positioning Radio System
a suitable communication network associated with
• ICT= Information and Communication Technol-
specific protocols for data communication to SCADA
ogy
or to make the distribution network as an active
• IED= Intelligent Electronic Device
network.
• IP= Internet Protocol
• LTE= Long Term Evolution
Conclusions and future scope • LV= Low-Voltage
• MDMS= Meter Data Management System
This paper aims to describe a process to monitor the • MMS=Manufactured Message Specification
LV network problems (outage, power quality) using • MV= Medium Voltage
smart metering events by designing use cases. The • NIS= Network Information System
use cases have shown the involvement of different • OMS= Outage Management System
actors and systems in the monitoring process, which • OSI= Open Information System
are later mapped into SGAM framework to see the • P2P= Peer to Peer
monitoring process in a pictorial format. Commu • PLC= Power Line Communication
nication technologies and communication protocols • PQDB= Intermediate Data Collection System
between actors and systems or between different for Power Quality
systems play an essential role in the monitoring • PQM= Power Quality Meter
process. For that purpose different communication • RTU= Remote Terminal Unit
infrastructures, communication technologies and pro • SCADA= Supervisory Control and Data Acqui-
tocols are discussed in this paper. For the designed sition
use cases of this paper, PLC with GPRS (hybrid • SGAM= Smart Grid Architecture Model
solution) communication infrastructure is selected for • SM= Smart Meter
the communication between SMs and control center • SOA= Service-oriented Architecture
based on the key performance indicators (latency and • TCP= Transmission Control Protocol
throughput) of different communication technologies • UDP= Universal Datagram Protocol
and by reviewing different communication infra • UMTS = Universal Mobile Telecommunication
structures used in different projects. In communication System
protocols, DLMS/COSEM is chosen to support
PLC communication between SM and DC. At the
same time, IEC 61850 is selected to support the
communication between field devices and the Literature Cited
control center over ethernet. In future, the designed Amaripadath, D., Roche, R., Istrate, D., Fortune,
use cases can be further developed by adding D., Braun, J. P. and Gao, F. 2017. “Power quality
more functionalities (by implementing data mining disturbances on smart grids: overview and grid
algorithms) in PQDB and MDMS. Moreover, the measurement configurations,” 2017 52nd International
proposed smart platform can be confirmed by incor Universities Power Engineering Conference (UPEC),
porating simulated test cases. Heraklion, pp. 1–6, doi: 10.1109/UPEC.2017.8231975.
18INTERNATIONAL JOURNAL ON SMART SENSING AND INTELLIGENT SYSTEMS
Andreadou, N., Guardiola, M. O. and Fulli, G. cases to visualization”, IEEE PES Innovative Smart Grid
2016. “Telecommunication technologies for smart grid Technologies Conference Europe, 2015(January): 1–6,
projects with focus on smart metering applications”, doi: 10.1109/ISGTEurope.2014.7028834.
Energies 9(5), doi: 10.3390/en9050375. Panchadcharam, S. 2012. “Performance evaluation
Arnold, G. W., Wollman, D. A., FitzPatrick, G. J., of information and communications technology infra
Prochaska, D. E., Lee, A., Holmberg, D. G., Su, D. H., structure for smart distribution network applications”,
Hefner, A. R., Jr, Golmie, N. T., Simmon, E. D. et al. January, pp. 1–163.
2010. “Nist framework and roadmap for smart grid Pikkarainen, M., Löf, A., Lu, S., Pöhö, T., Repo, S.
interoperability standards release 1.0,” Special Publication and Della Giustina, D. 2013. “Power quality monitoring
(NIST SP)-1108. use case in real low voltage network,” 2013 4th IEEE/PES
Bruinenberg, J., et al. 2012. CEN-CENELEC- Innovative Smart Grid Technologies Europe ISGT Europe,
ETSI: Smart Grid Coordination Group – Smart Grid pp. 1–5, doi: 10.1109/ISGTEurope.2013.6695405.
Reference Architecture Report 2.0, November. Poongodi, M., Hamdi, M., Sharma, A., Ma, M. and
Camachi, B. E. M., Chenaru, O., Ichim, L. and Singh, P. K. 2019. “DDoS detection mechanism using
Popescu, D. 2017. “A practical approach to IEC61850 trust-based evaluation system in VANET,” IEEE Access 7:
standard for automation, protection and control of 183532–183544, doi: 10.1109/ACCESS.2019.2960367.
substations,” 2017 9th International Conference on Radi, M., Taylor, G., Uslar, M., Kohlke, J. and
Electronics, Computers and Artificial Intelligence (ECAI), Suljanovic, N. 2019. “Bidirectional power and data flow
Targoviste, pp. 1–6, doi: 10.1109/ECAI.2017.8166471. via enhanced portal based TSO-DSO Coordination”,
Chaves, M. T. C., Barbosa, R. S. and Amorim, L. M. 2019 54th International Universities Power Engineering
C. 2018. “Smart metering communication performance Conference (UPEC), doi: 10.1109/UPEC.2019.8893602.
analysis in EDP Distribuição”, CIRED Workshop, Rathee, G., Sharma, A., Kumar, R., Ahmad, F.
No. 103, pp. 7–8. and Iqbal, R. 2020. “A trust management scheme to
Chren, S., Rossi, B. and Pitner, T. 2016. “Smart secure mobile information centric networks,” Computer
grids deployments within EU projects: the role of smart Communications 151(December): 66–75, doi: 10.1016/j.
meters”, 2016 Smart Cities Symposium Prague (SCSP), comcom.2019.12.024.
doi: 10.1109/SCSP.2016.7501033. Repo, S., Della Giustina, D., Ravera, G., Cremaschini,
Dedé, A., Della Giustina, D., Rinaldi, S., Ferrari, P., L., Zanini, S., Selga, J. M. et al., 2011. “Use case
Flammini, A. and Vezzoli, A. 2015. “Smart Meters as analysis of real-time low voltage network management,”
part of a sensor network for monitoring the low voltage Proceeding of ISGT Europe, 8(December 5–7): 1.
grid”, Vol. 00416. Sharma, A. et al. 2019. “A secure, energy-and SLA-
Grilo, A., Casaca, A., Nunes, M., Bernardo, A., Efficient (SESE) E-Healthcare framework for quickest
Rodrigues, P. and Almeida, J. P. 2017. “A management data transmission using cyber-physical system,” Sensors
system for low voltage grids”, 2017 IEEE Manchester (Basel, Switzerland), 19(9): 2119, doi: 10.3390/s19092119.
PowerTech 2017: 1–6, doi: 10.1109/PTC.2017.7980826. Sharma, A., Singh, P. K., Sharma, A. and Kumar,
Kauppinen, M., et al. 2012. “Analysis of needs and R. 2019. “An efficient architecture for the accurate
available solutions for second-generation AMR support detection and monitoring of an event through the sky,”
for Smart Grids”. Computer Communications 148(July): 115–128, doi:
Kuzlu, M., Pipattanasomporn, M. and Rahman, S. 10.1016/j.comcom.2019.09.009.
2014. Communication network requirements for major Uslar, M., et al 2019. “Applying the smart grid
smart grid applications in HAN, NAN and WAN. Computer architecture model for designing and validating
Networks 67: 74–88, doi: 10.1016/j.comnet.2014.03.029. system-of-systems in the power and energy domain:
León, H., Montez, C., Stemmer, M. and Vasques, F. a European perspective,” Energies 12(2), doi: 10.3390/
2016. “Simulation models for IEC 61850 communica en12020258.
tion in electrical substations using GOOSE and SMV Vikram, K. and Sahoo, S. K. 2017. “Load aware
time-critical messages”, 2016 IEEE World Conference channel estimation and channel scheduling for 2.4GHZ
on Factory Communication Systems (WFCS), Aveiro, frequency band based wireless networks for smart grid
pp. 1–8, doi: 10.1109/WFCS.2016.7496500. applications,” International Journal on Smart Sensing
Löf, N., Pikkarainen, M., Repo, S. and Järventausta, P. and Intelligent Systems 10(4): 879–902, doi: 10.21307/
2011. “Utilizing smart meters in LV network management”, ijssis-2018-023.
21st International Conference and Exhibition on Electricity Wang, P., Su, F., Hu, B. and Luan, W. 2016. “AMI
Distribution CIRED, No. 1050, pp. 6–9. based sensing architecture for smart grid in IPV6
Neureiter, C., Engel, D., Trefke, J., Santodomingo, networks. International Journal on Smart Sensing and
R., Rohjans, S. and Uslar, M. 2015. “Towards consis Intelligent Systems 9(4): 2111–2130, doi: 10.21307/
tent smart grid architecture tool support: from use ijssis-2017-955.
19You can also read