Recurrence in the evolution of air transport networks - Nature
←
→
Page content transcription
If your browser does not render page correctly, please read the page content below
www.nature.com/scientificreports
OPEN Recurrence in the evolution of air
transport networks
Kashin Sugishita1 & Naoki Masuda1,2,3*
Changes in air transport networks over time may be induced by competition among carriers, changes
in regulations on airline industry, and socioeconomic events such as terrorist attacks and epidemic
outbreaks. Such network changes may reflect corporate strategies of each carrier. In the present
study, we propose a framework for analyzing evolution patterns in temporal networks in discrete
time from the viewpoint of recurrence. Recurrence implies that the network structure returns to one
relatively close to that in the past. We applied the proposed methods to four major carriers in the US
from 1987 to 2019. We found that the carriers were different in terms of the autocorrelation, strength
of periodicity, and changes in these quantities across decades. We also found that the network
structure of the individual carriers abruptly changes from time to time. Such a network change reflects
changes in their operation at their hub airports rather than famous socioeconomic events that look
closely related to airline industry. The proposed methods are expected to be useful for revealing, for
example, evolution of airline alliances and responses to natural disasters or infectious diseases, as well
as characterizing evolution of social, biological, and other networks over time.
In the US, the Airline Deregulation Act was established in 1978, which removed the governmental controls over
fares, routes, and market entries of new air carriers (carriers for short)1. After the establishment of the law, the
formerly regional carriers and completely new carriers grew in the market and increased the level of competi-
tion among carriers2. The deregulation also caused the emergence of low cost carriers (LCCs). In contrast to
full service carriers (FSCs), an LCC offers low fares without many traditional passenger services. The growth
of LCCs, especially Southwest Airlines in the case of the US, which is the largest LCC in the world in terms of
passenger traffic3, elicited a dramatic downward pressure on fares4. After the deregulation in the US, similar
airline deregulations and subsequent elevated competition among carriers have been duplicated around the
world including in E urope5 and Asia6.
In addition to fierce competition among carriers, the airline industry has been exposed to a highly com-
petitive environment partly owing to various socioeconomic events. For example, the 9/11 attacks in 2001 had
significant impacts on the US airline industry. This event resulted in a negative demand shock of more than
30%7. The US airline industry lost nearly $35 billion between 2001 and 2005 in t otal2. In fact, a number of car-
riers filed liquidation bankruptcies (so-called Chapter 7 bankruptcy) or reorganization bankruptcies (so-called
Chapter 11 bankruptcy) including major carriers such as American Airlines, United Airlines, and Delta Air
Lines8. Moreover, the US airline industry has faced massive restructuring with a number of mergers such as the
merger of American Airlines and US Airways, and of Delta Air Lines and Northwest Airlines9. In Europe, the
volcanic eruptions in Iceland in 2010 had a devastating effect on the European air transport network, preventing
air travel throughout most of Europe for six days10. Overall, business environments in the airline industry have
been tough on the global scale. For example, the International Air Transport Association (IATA) announced
that year 2019 was the smallest in freight demand in the world since 200911. As of 2020, the airline industry is
facing a financial crisis because of the COVID-19 pandemic. The Europe’s biggest regional carrier of the time,
Flybe, went bankrupt in March 2020, and many carriers may f ollow12.
The airline industry is highly susceptible to such socioeconomic and natural events, and these events may
influence the structure of air transport networks. Regardless of the reason, air transport networks can be regarded
as temporal networks in which nodes are airports and edges are direct flight connections13; in various types of
networks such as social and economic networks, nodes and/or edges change over time, constituting temporal
networks14–17. In fact, air transport networks consist of multiple carriers. Each carrier has its own corporate
strategies, which may change over time depending on evolution of the market and knowledge that the carrier
1
Department of Mathematics, State University of New York at Buffalo, Buffalo 14260‑2900, USA. 2Computational
and Data‑Enabled Science and Engineering Program, State University of New York at Buffalo, Buffalo 14260‑2900,
USA. 3Faculty of Science and Engineering, Waseda University, Tokyo 169‑8555, Japan. *email: naokimas@
buffalo.edu
Scientific Reports | (2021) 11:5514 | https://doi.org/10.1038/s41598-021-84337-z 1
Vol.:(0123456789)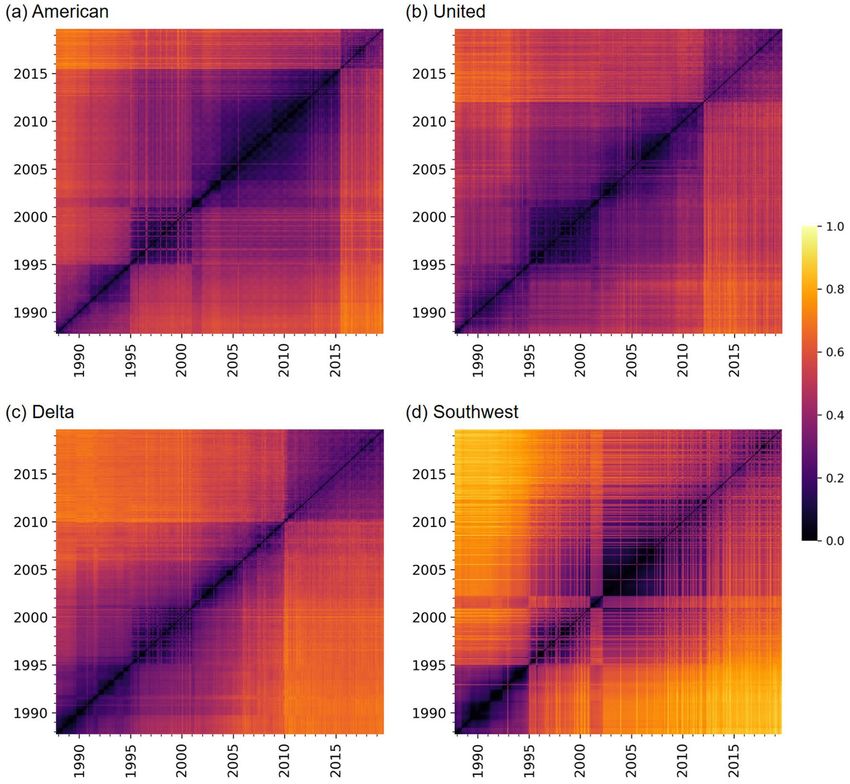
www.nature.com/scientificreports/
gains by learning from databases (e.g., about customers)18. These time-varying corporate strategies of carriers
may affect the evolution of their network structure.
A number of studies have analyzed structures of air transport networks. Most of these studies have examined
static properties of air transport networks such as the degree distribution, average path length, clustering coef-
ficient, assortativity, and c entrality19–25. In recent years, several studies have investigated evolution of air transport
networks. For example, in an air transport network in Brazil, the number of nodes and edges decreased from
1995 to 2006, whereas the number of passengers and the amount of cargo increased during the same p eriod26.
In contrast, the connectivity of an air transport network in China increased from 1930 to 2 01227. These and
other13,28–30 studies are concerned with the evolution of air transport networks at the country, continental, or
global level and do not distinguish networks by carriers. In fact, each carrier may be evolving in different man-
ners, reflecting its own corporate strategies. Because carriers compete for a limited traffic demand, some carriers
expanding their networks may cause other carriers to shrink their networks. Even if the structure of an entire
network combining different carriers is relatively stable31, each carrier may be drastically changing its network
structure over time. To date, time-dependent structure of air transport networks at the carrier level is not well
understood32, while a few studies have investigated static properties of airline networks by c arriers33,34.
In the present study, we propose a novel framework for analyzing evolution of air transport networks. In
particular, we examine temporal air transport networks from the viewpoint of recurrence. Recurrence implies
that the structure of the network returns to one close to that of the same network in the past. Recurrent plots
and recurrence quantification analysis are a set of data analysis methods to quantify recurrence, which was
originally proposed for time s eries35 and recently extended to the case of temporal networks36,37. While we do
not employ recurrence plots or recurrence quantification analysis in the exact sense in the present study, we
will use the idea of recurrence to examine when air transport networks approach their past structure relatively
closely as compared to in other times. We apply the proposed framework to four major carriers in the US, i.e.,
American Airlines (AA), United Airlines (UA), Delta Air Lines (DL), and Southwest Airlines (WN), from 1987
to 2019. In particular, we ask how the network structure of different carriers responds to major events such as
mergers, which airports are involved in major changes in the network structure, and how different carriers may
be different in the extent of recurrence and periodicity of the network structure.
Methods
Data set and construction of monthly air transport networks. We use a data set available at the US
Bureau of Transportation Statistics. The data are based on the reports made by certified carriers that account
for at least one percent of the domestic scheduled passenger revenue. By definition, a certified carrier holds an
operating certificate issued by the US Secretary of Transportation. The data set contains the origin and destina-
tion airports of each flight, departure and arrival times, operating carriers, and so on. We downloaded monthly
data between October 1987 and August 201938.
We focus on air transport networks for the four most major carriers in the US in terms of revenue, i.e., AA,
UA, DL, and WN. According to the US Bureau of Transportation Statistics, domestic revenue passenger-miles
of each of these four carriers in 2019 is over 100 billions. Alaska Airlines, ranked fifth, earned domestic revenue
passenger-miles less than 50 billions in 2019. For each carrier, we construct monthly snapshot networks from
October 1987 to August 2019, in which a node is an airport. We connect two nodes by an edge if there is at least
one direct commercial flight between the two airports in the month. For simplicity, we assume that each snapshot
network is unweighted and undirected.
Distance matrix. To measure the dissimilarity between two snapshot networks, we define the normalized
network distance (network distance for short) between two networks G and G′ as
M(G ∩ G′ )
d(G, G′ ) = 1 − √ , (1)
M(G)M(G′ )
where M(G) and M(G′ ) are the numbers of edges in G and G′ respectively, and M(G ∩ G′ ) is the number of edges
that G and G′ have in common. Network distance d ranges between 0 and 1. The distance matrix for a carrier
is a tmax × tmax symmetric matrix of which the (t, t ′ )th entry is given by d(Gt , Gt ′ ), where Gt is the network at
month t and tmax is the number of months observed. If d(Gt , Gt ′ ) is small, where t < t ′ , we regard that the net-
work at month t ′ approximately recurs to that at month t. As we will show, the distance matrices based on Eq. (1)
show clear horizontal and vertical lines that correspond to abrupt changes in the network structure, which are
synchronous with the sudden increases in the number of nodes and edges upon major mergers. We decided to
use Eq. (1) because we did not observe such abrupt changes in the distance matrices calculated from three other
network distance measures (see Supplementary Fig. S1 online).
Statistical analysis. To measure differences in the distance matrices, we conduct statistical tests on distri-
butions of d. First, we use the Kruskal–Wallis test, which is an nonparametric statistical test to assess the differ-
ences among three or more groups39. We used “Kruskal” function in R (ver. 3.6.3). Second, as a post-hoc test,
we use the Bonferroni-corrected Mann–Whitney U test40 to compare all pairs of groups. We used “wilcox.test”
function in R (ver. 3.6.3). In addition to the p values, we measure its effect size r, which is the Z value obtained
from the “wilcox.test” function divided by the square root of the number of o bservations41. According to a
standard, the effect size is said to be strong, medium, or small when r > 0.5, r > 0.3, or r > 0.1, respectively42.
Scientific Reports | (2021) 11:5514 | https://doi.org/10.1038/s41598-021-84337-z 2
Vol:.(1234567890)
www.nature.com/scientificreports/
Autocorrelation function and power spectral density. To measure the similarity between air trans-
port networks across time, we define an autocorrelation function (ACF) for a given carrier by
1
tmax −τ
ACF (τ ) = 1 − d(Gt , Gt+τ ) , (2)
tmax − τ
t=1
where τ is the time lag. Note that Eq. (2) is not a proper autocorrelation function. However, in analogy to the
Wiener–Khinchin theorem43, we define a power spectral density (PSD) by the Fourier transform of the ACF as
follows:
∞
PSD (f ) = ACF (τ )e−2πif τ dτ , (3)
−∞
where f is the frequency. The PSD shows the power of periodic variations.
State detection in temporal air transport networks. We identify states of the temporal air transport
networks for each carrier based on its distance matrix. Consider a sequence of tmax static networks. To assign a
state to each of the tmax snapshot networks, we apply a hierarchical clustering algorithm to the tmax × tmax dis-
tance matrix36. We used “linkage” and “fcluster” functions in “scipy” module in Python. To define the distance
between clusters, we used “ward” in the “linkage” function. The hierarchical clustering provides partitions of the
monthly networks into C discrete states, where the number of states, C, ranges between 1 and tmax . We adopt the
value of C (2 ≤ C ≤ tmax ) that maximizes the Dunn’s index, D44, defined by
min1≤c�=c′ ≤C minGi ∈cth state,Gj ∈c′ th state d(Gi , Gj )
D=
max 1≤c′′ ≤C max Gi′ ,Gj′ ∈c′′ th state d(Gi′ , Gj′ )
. (4)
The numerator on the right-hand side of Eq. (4) represents the smallest distance between two states among all
the pairs of states. The denominator represents the largest diameter of the state among all the states.
Results
Evolution of the numbers of nodes and edges. We show the evolution of the numbers of nodes and
edges for each carrier in Fig. 1. The three FSCs (i.e., AA, UA, and DL) experienced the Chapter 11 bankruptcies.
This is a form of bankruptcy that permits reorganization under the bankruptcy laws. A debtor proposes a plan
of reorganization, and it can exit from the bankruptcy if it completes the proposed plan. The dashed lines in
Fig. 1 represent the times of the Chapter 11 bankruptcies (shown in red) and exits from them (shown in yellow).
Additionally, we show the times of the 9/11 attacks and mergers by the dotted-dashed lines and dotted lines,
respectively.
The three FSCs show some common patterns. Between the middle of the 1990s and around 2010, the numbers
of nodes and edges largely decreased. After the 9/11 attacks, the three carriers experienced the bankruptcies.
Then, after they exited from the bankruptcy, they merged with other carriers. Upon the mergers, the number
of edges almost doubled suddenly. There was no notable change in the numbers of nodes and edges in response
to the bankruptcies and the exits from them. In contrast, WN, which is an LCC, has never experienced bank-
ruptcy. The numbers of nodes and edges in the WN network have roughly monotonically increased over the two
decades despite the 9/11 attacks and the merger. In the next sections, we further study the structural evolution
of the four carriers.
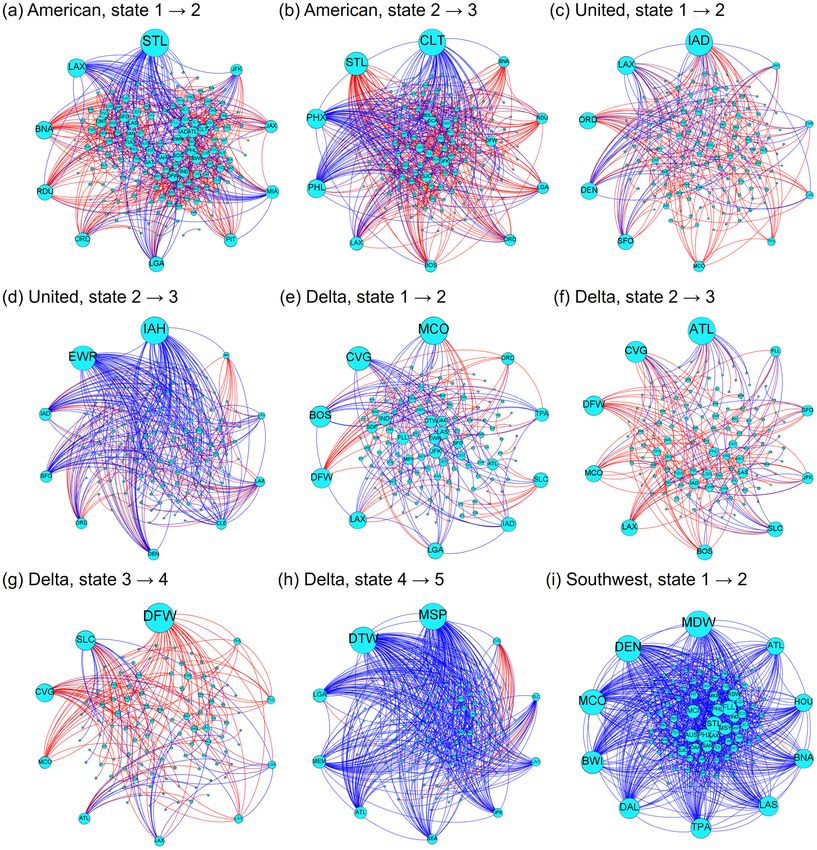
Distance matrix for each carrier. Visualization and quantification of the distance matrices. In Fig. 2, we
show the distance matrices for the four carriers. First, we notice that there are clear horizontal and vertical lines
in the distance matrices. These lines indicate abrupt changes in the network structure. For example, the figure
suggests that the three FSCs considerably changed their network structure upon the mergers after they exited
from the bankruptcies (i.e., the merger between AA and US Airways (US) in 2015 in Fig. 2a, that between UA
and Continental Airlines (CO) in 2012 in Fig. 2b, and that between DL and Northwest Airlines (NW) in 2010 in
Fig. 2c). These results are consistent with the approximately two-fold sudden increase in the numbers of edges
shown in Fig. 1a–c. However, the distance matrices additionally indicate that the network structure after the
merger is considerably different from that before the merger for each FSC. For example, the DL network after
the merger with NW in 2010 is considerably different from that in the late 1990s, although the numbers of nodes
and edges are similar at the two time points (Fig. 1c).
Second, there are checkerboard patterns in the distance matrices, for example, around year 2010 for AA
(Fig. 2a). The checkerboard patterns imply seasonal periodicity in the network structure. These patterns are also
consistent with the annual periodic fluctuations in the number of nodes and edges visible in Fig. 1a. Note that
the classical recurrence p lots35, in which the distance values are binarized into 0 or 1, would not uncover pat-
terns of the distance matrix either at relatively large distance values (e.g., the sudden changes in response to the
post-bankruptcy mergers) or at relatively small distance values (e.g., the checkerboard patterns). In other words,
recurrence plots with a small threshold value for binarization will not have the long horizontal and vertical lines
marking major mergers because relatively large distance values that contribute to generation of these lines are
all binarized to 1. By contrast, recurrence plots with a large threshold value will miss the checkerboard patterns
because relatively small distance values that contribute to the generation of the checkerboard patterns are all
Scientific Reports | (2021) 11:5514 | https://doi.org/10.1038/s41598-021-84337-z 3
Vol.:(0123456789)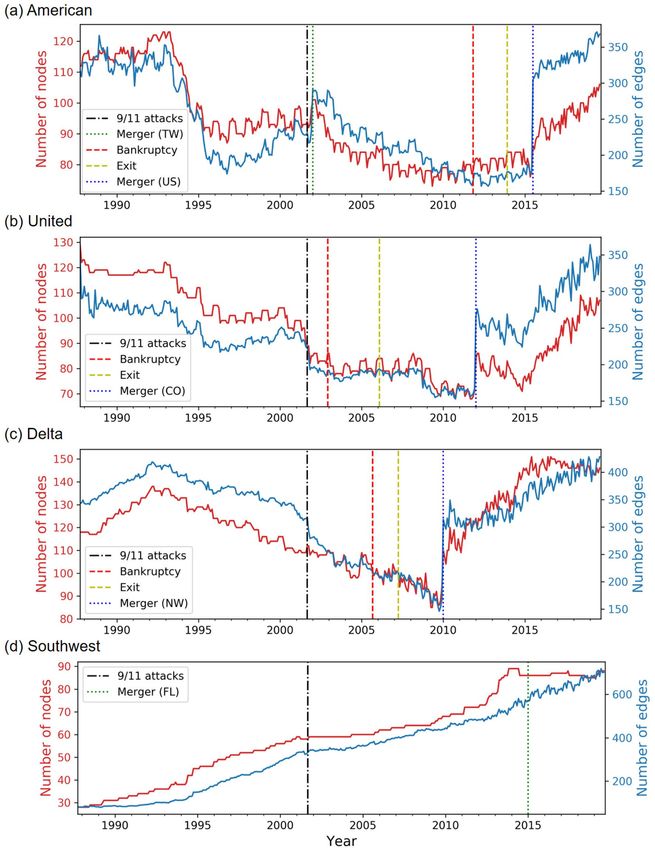
www.nature.com/scientificreports/

                                            Figure 1.  Evolution of the numbers of nodes and edges over time. (a) American Airlines, (b) United Airlines,
                                            (c) Delta Air Lines, and (d) Southwest Airlines.

                                            binarized to 0. In our framework, we analyze the original values of the network distances without binarizing
                                            them, which enables us to reveal various patterns in the distance matrices without varying a threshold parameter.
                                                Third, we notice that the distance matrix for WN (Fig. 2d) has many bright horizontal and vertical stripes
                                            after 1995. They suggest that WN has frequently changed their network, but for a short duration each time such
                                            as a single month.
                                                In Fig. 3, we show the box plots of the distribution of the network distance between pairs of months. Each
                                            box plot summarizes each distance matrix shown in Fig. 2. To be quantitative, we carry out statistical analyses on
                                            these distributions. First, we carry out the Kruskal–Wallis test to find that there is a significant difference among
                                            the four distributions shown in Fig. 3 ( p < 0.001). Second, as a post-hoc test, we run the Bonferroni-corrected

          Scientific Reports |   (2021) 11:5514 |                https://doi.org/10.1038/s41598-021-84337-z                                                    4

Vol:.(1234567890)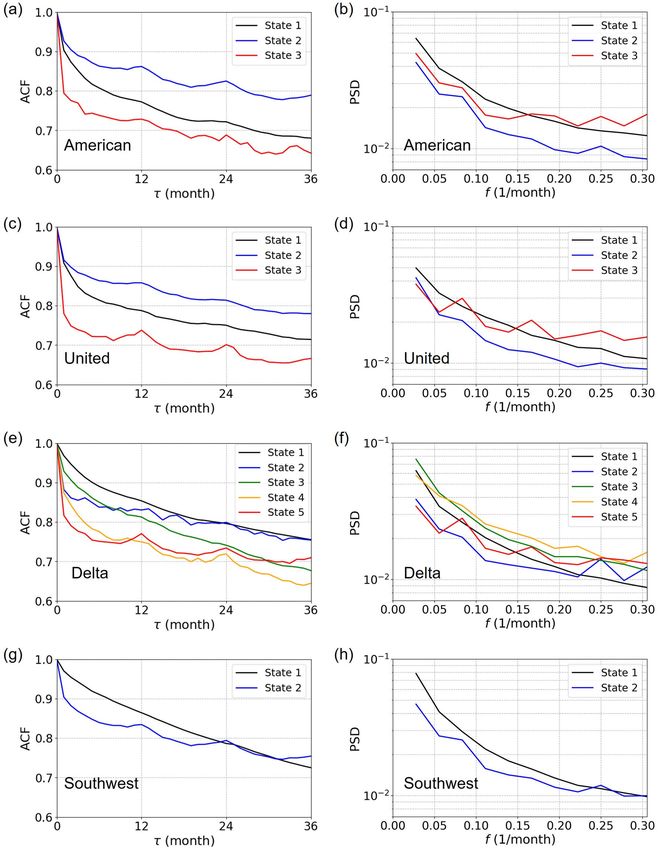
www.nature.com/scientificreports/

                                  Figure 2.  Network-distance matrices. (a) American Airlines, (b) United Airlines, (c) Delta Air Lines, and (d)
                                  Southwest Airlines.

                                               Effect size, r
                                   AA vs. UA   0.0129***
                                   AA vs. DL   0.211***
                                   AA vs. WN   0.325***
                                   UA vs. DL   0.225***
                                   UA vs. WN   0.337***
                                   DL vs. WN   0.162***

                                  Table 1.  Results of the Bonferroni-corrected Mann–Whitney U test to compare each pair of carriers in terms
                                  of d. *** p < 0.001.

                                  Mann–Whitney U test to compare all six pairs of carriers. Table 1 indicates that each pair of carriers is signifi-
                                  cantly different, partly owing to large sample sizes. According to a standard practice, two pairs, AA-WN and
                                  UA-WN, are different with medium effect sizes (r > 0.3), and three pairs, DL-WN, AA-DL, and UA-DL, are
                                  different with small effect sizes (r > 0.1). The effect size for pair AA-UA is only 0.0129. These results support
                                  our casual observation with Fig. 2, i.e., WN shows unique patterns and has kept changing the network structure
                                  more considerably than the other three carriers. Additionally, DL changed its structure significantly more than
                                  AA and UA did over time.

                                  Periodicity. In Fig. 4a, we show the ACFs for the four carriers, calculated from the distance matrices shown in
                                  Fig. 2. This figure indicates that networks closer in time are more similar to each other. We also observe that the

Scientific Reports |   (2021) 11:5514 |                   https://doi.org/10.1038/s41598-021-84337-z                                               5

                                                                                                                                              Vol.:(0123456789)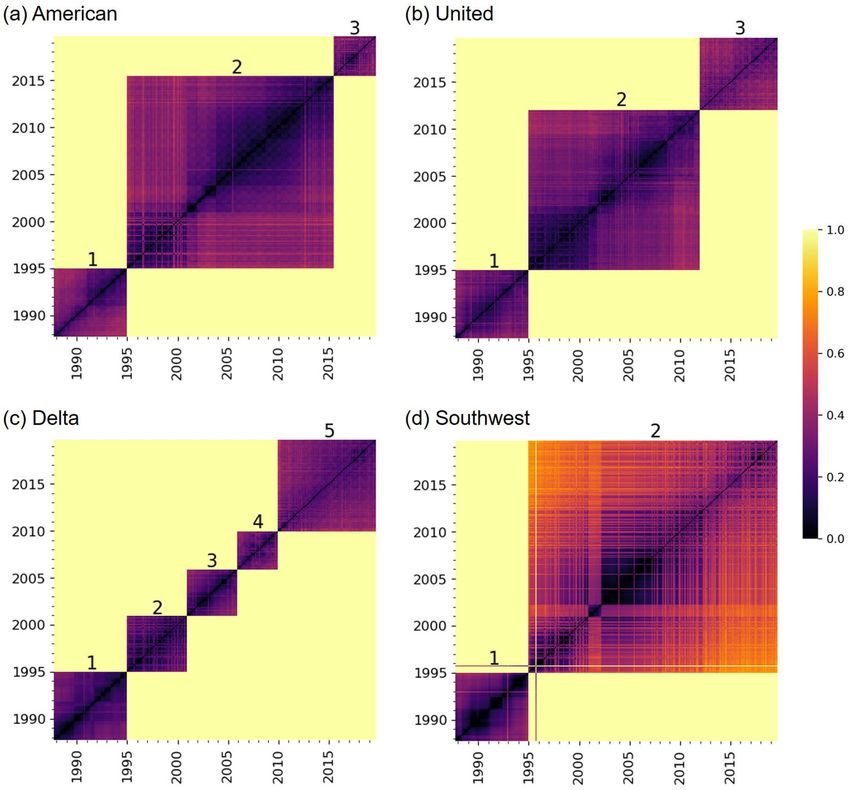
www.nature.com/scientificreports/

                                            Figure 3.  The distribution of the network distance d. The box plots show five-number summaries of the
                                            distribution: first quartile (Q1), median, third quartile (Q3), minimum without outliers (Q1 − 1.5 × IQR), and
                                            maximum without outliers (Q3 + 1.5 × IQR), where IQR = Q3 − Q1. Open circles represent outliers.

                                            Figure 4.  Analysis of autocorrelation and periodicity. (a) ACFs and (b) PSDs for the four carriers.

                                            Figure 5.  Strength of annual periodicity in the air transport networks.

                                            ACF for WN is the smallest for all the lag τ > 0, confirming that the WN network tends to vary over time to a
                                            larger extent than the other carriers. In addition, Fig. 4a reconfirms that the DL network tends to vary over time
                                            more than the AA and UA networks do.
                                                 The ACFs for the FSCs have local maxima at multiples of 12 months, suggesting annual periodic patterns.
                                            To quantify the strength of annual cycles, we show the PSDs for the four carriers in Fig. 4b. The PSDs have local
                                            maxima, corresponding to an annual cycle, for AA and UA. Here we define the strength of the annual periodic-
                                            ity, denoted by s, at f = 1/12 [1/month] by comparing PSD (1/12) with the middle point of the two neighbors,
                                            PSD (1/15) and PSD (1/10), as follows:
                                                                                               PSD (1/12)
                                                                                 s=                                .                                      (5)
                                                                                      ( PSD (1/15) + PSD (1/10))/2
                                            A value of s larger than 1 suggests some periodicity with frequency f = 1/12. We show s for each carrier in
                                            Fig. 5. The figure suggests that AA has the strongest annual periodicity, followed by UA and DL. The value of s
                                            for WN is less than 1, suggesting the lack of periodicity.

          Scientific Reports |   (2021) 11:5514 |                https://doi.org/10.1038/s41598-021-84337-z                                                  6

Vol:.(1234567890)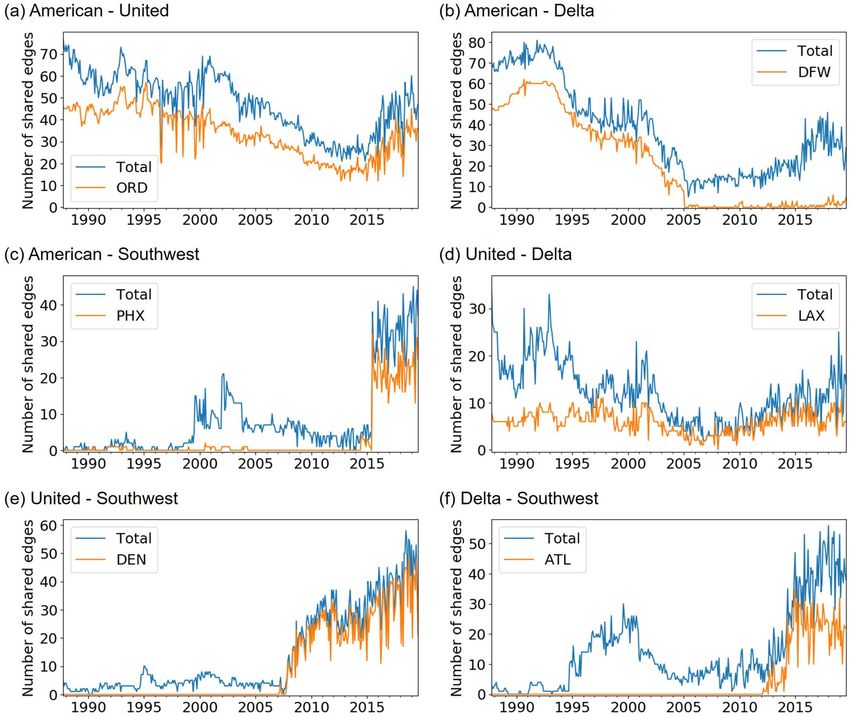
www.nature.com/scientificreports/

                                  Figure 6.  System-state dynamics of temporal air transport networks. (a) American Airlines, (b) United
                                  Airlines, (c) Delta Air Lines, and (d) Southwest Airlines. To aid visual understanding, we show the network
                                  distance on a color scale if and only if the two snapshot networks belong to the same state. Otherwise, the
                                  corresponding cell is shown in yellow.

                                  State transitions in temporal air transport networks. In this section, we examine states of temporal air transport
                                  networks for each carrier. In Figs. 1 and 2, we observed that the network structure for the three FSCs drastically
                                  changed upon the mergers after they exited from the bankruptcy. If we apply our algorithm to detect states of
                                  temporal networks to the entire observation, we detect two states for each FSC, one state corresponding to the
                                  time window before the merger and another state after the merger. However, a visual inspection of Fig. 2 sug-
                                  gests that we may benefit from distinguishing multiple states for the time period before the merger. Therefore,
                                  for each FSC, here we apply the hierarchical clustering algorithm to detect state dynamics to the distance matrix
                                  of the temporal network restricted to before the post-bankruptcy merger. We regard the snapshot networks after
                                  the post-bankruptcy merger as one distinct state. For WN, we applied the algorithm to detect system states to
                                  the entire observation window because the WN network has not considerably changed upon the merger with
                                  AirTran Airways (FL) in 2015 up to our visual inspections of Figs. 1d and 2d.
                                      We show the detected state dynamics for the four carriers in Fig. 6. For all the four carriers, we detected a
                                  change point at January 1995. We identified three states for AA and UA, and five states for DL. The detected
                                  changes for DL from state 2 to 3 and state 3 to 4 are located at January 2001 and December 2005, respectively. For
                                  WN, we detected two states. Differently from the other carriers, state 1 for the WN network is not consecutive in
                                  time, i.e., state 1 reappears in October 1995 for a month after the state transition on January 1995. We notice that
                                  the detected change point at December 2005 for DL is three months after the bankruptcy. However, except for
                                  this instance and the state after the post-bankruptcy mergers for the FSCs, the detected change points coincide
                                  with neither the 9/11 attacks (i.e., September 2001), the bankruptcies (i.e., AA: November 2011, UA: December
                                  2002), nor the exits from the bankruptcies (i.e., AA: December 2013, UA: February 2006, DL: April 2007).
                                      To understand differences in the network structure across the states, we visualize deleted and added edges
                                  for each pair of consecutive states. We define deleted edges as the edges that exist at least once in the older state

Scientific Reports |   (2021) 11:5514 |                https://doi.org/10.1038/s41598-021-84337-z                                                    7

                                                                                                                                                Vol.:(0123456789)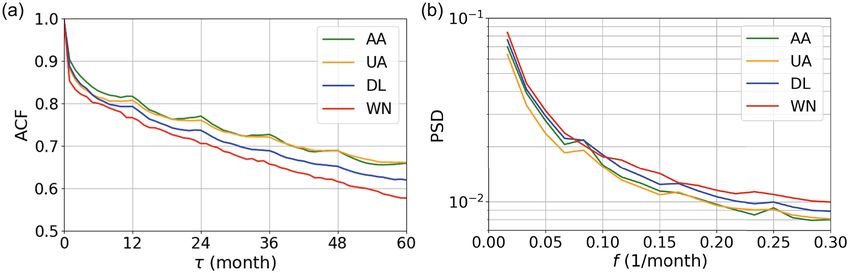
www.nature.com/scientificreports/

                                            Figure 7.  Deleted edges (shown in red) and added edges (shown in blue) for each pair of the consecutive states.
                                            In each panel, we placed 10 nodes with the largest number of added and deleted edges in total in the peripheral
                                            part of the visualization.

                                            and never exist in the newer state. The added edges are defined as edges that never exist in the older state and
                                            exist at least once in the newer state. We show the results in Fig. 7. The deleted and added edges are shown in
                                            red and blue, respectively.
                                                Figure 7a indicates that, in transition to state 2, AA withdrew edges especially at BNA (Nashville International
                                            Airport) and RDU (Raleigh–Durham International Airport) and added edges at STL (St. Louis Lambert Interna-
                                            tional Airport) and LAX (Los Angeles International Airport). These results are consistent with the fact that AA
                                            closed two hub airports, BNA and RDU, in the middle of the 1990s and merged with Trans World Airlines (TW)
                                            in 2002 whose major airports were STL and LAX. Figure 7b indicates that, in transition to state 3, AA withdrew
                                            edges by the largest number at STL and added many edges at CLT (Charlotte Douglas International Airport),
                                            PHX (Phoenix Sky Harbor International Airport), and PHL (Philadelphia International Airport). These results
                                            are consistent with the fact that AA ceased to use STL as a hub around 2010 and merged with US whose major
                                            airports were CLT, PHX, and PHL.

          Scientific Reports |   (2021) 11:5514 |                https://doi.org/10.1038/s41598-021-84337-z                                                   8

Vol:.(1234567890)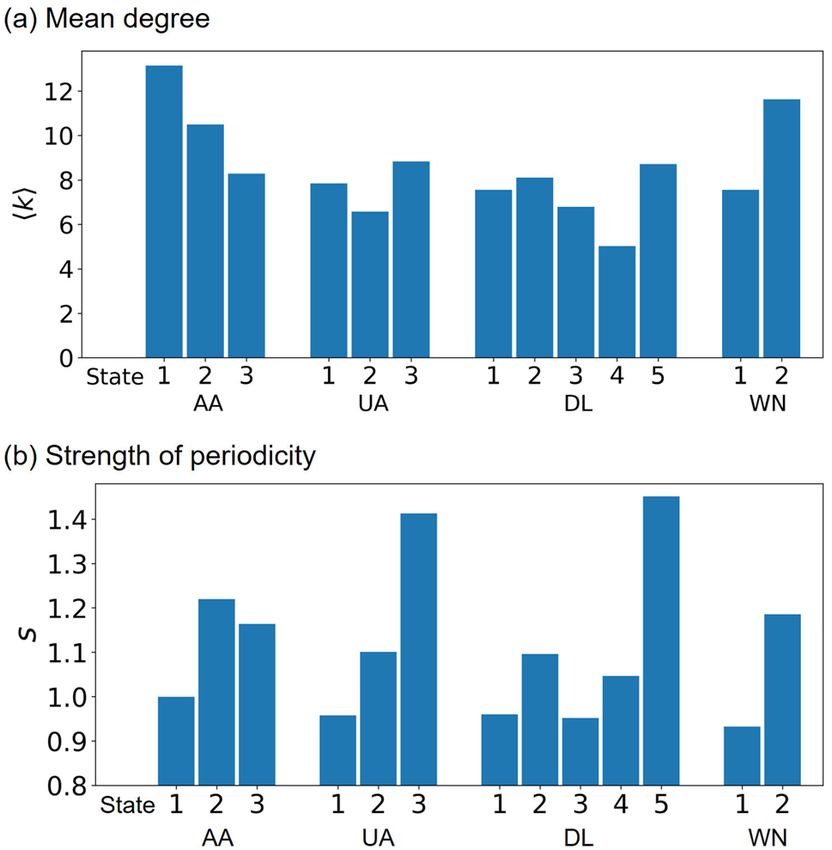
www.nature.com/scientificreports/

                                  Figure 8.  ACFs and PSDs for each network state. (a) American Airlines, ACF. (b) American Airlines, PSD. (c)
                                  United Airlines, ACF. (d) United Airlines, PSD. (e) Delta Air Lines, ACF. (f) Delta Air Lines, PSD. (g) Southwest
                                  Airlines, ACF. (h) Southwest Airlines, PSD.

                                      Figure 7c indicates that, in transition to state 2, UA changed many routes connecting to IAD (Washington
                                  Dulles International Airport), which has been a hub airport for UA. Figure 7d indicates that, in transition to state
                                  3, UA added edges by the largest numbers at IAH (George Bush Intercontinental Airport) and EWR (Newark
                                  Liberty International Airport). This event originated from the merger with CO whose major airports had been
                                  IAH and EWR.
                                      Figures 7e and 7f indicate that, in transition from state 1 to 2 and from state 2 to 3, DL changed many edges
                                  connecting to some airports such as MCO (Orlando International Airport), CVG (Cincinnati/Northern Kentucky

Scientific Reports |   (2021) 11:5514 |                https://doi.org/10.1038/s41598-021-84337-z                                                   9

                                                                                                                                               Vol.:(0123456789)
www.nature.com/scientificreports/
Figure 9. Mean degree and strength of periodicity in each state.
International Airport), and ATL (Hartsfield–Jackson Atlanta International Airport). Figure 7g shows that, in
transition to state 4, DL withdrew edges by the largest number at DFW (Dallas/Fort Worth International Air-
port). Figure 7h is consistent with the merger with NW whose major airports were MSP (Minneapolis–Saint
Paul International Airport) and DTW (Detroit Metropolitan Airport).
Figure 7i indicates that, in transition to state 2, WN expanded the network by adding many edges at some
airports such as MDW (Midway International Airport), DEN (Denver International Airport), and MCO.
State‑dependent periodicity. In the previous section, we documented differences in the network structure
across the states through visualization. We expect that the different states are systematically different in some
quantitative aspects. Therefore, in this section, we quantitatively examine the temporal variability of the network
and possible annual periodicity of network changes, which themselves may change on the timescale of decades.
We measure the ACF and PSD for each state and each carrier. Note that a lower ACF suggests a larger temporal
variability of time s eries45–47. Because state 1 for WN is not consecutive in time, we exclude the single isolated
month in state 1 (i.e., October 1995) and nine isolated months in state 2 (i.e., from January to September 1995) in
the following analysis.
We show the ACFs and PSDs for each state and each carrier in Fig. 8. For AA and UA, the ACF is the larg-
est in state 2, followed by state 1, and then by state 3, for all the lag values (Fig. 8a,c). This result indicates that
the temporal variability is smaller (i.e., the ACF is larger) in state 2, which roughly spans from 1995 to 2013 for
both carriers. In contrast, the ACF for DL and WN tends to be smaller at later times, at least up to τ = 2 years of
the lag (Fig. 8e,g). This result indicates that the temporal variability becomes larger over time for DL and WN.
The PSDs for some combinations of the state and carrier have a local maximum at f = 1/12. We measure
the strength of periodicity in the same manner as Eq. (5), i.e., by comparing PSD (1/12) with the middle point
of the two neighbors, i.e., PSD (1/18) and PSD (1/9). It should be noted that the largest lag assumed in Fig. 8 is
30 as opposed to 50 in Fig. 4, which results in different f values for the two neighbors of f = 1/12 (i.e., f = 1/18
and 1/9) as compared to those for Fig. 4. We show the mean degree, k
, and the strength of periodicity, s, for
the different states and carriers in Fig. 9. The figure suggests that both k
and s depend on the states but in dif-
ferent manners. For example, the periodicity is much larger in the final state in the UA and DL networks, which
the state dependence of k
does not explain. The figure further indicates that all the four carriers did not have
a clear periodicity before 1995 (corresponding to state 1 for each carrier). After 1995, all carriers strengthened
the periodicity. In the latest states, UA and DL have stronger periodicity than AA and WN.
Network distance between carriers. In this section, we examine similarity in the network structure
across different carriers. We calculate the distance matrix for each pair of carriers by measuring the normalized
network distance between a network at month t for a carrier and a network at month t ′ for another carrier, where
1 ≤ t, t ′ ≤ tmax . The distance matrices in Fig. 10 indicate that the four carriers are all dissimilar to each other;
note that the distance values range between 0 and 1 by definition. Nevertheless, the AA and UA networks are
apparently more similar to each other than the other carrier pairs are on average. Another observation is that
there are some visible horizontal and vertical lines in the figure (e.g., a horizontal line in 2005 in Fig. 10b, a verti-
cal line in 2015 in Fig. 10c, and a horizontal line in 2008 in Fig. 10e).
Scientific Reports | (2021) 11:5514 | https://doi.org/10.1038/s41598-021-84337-z 10
Vol:.(1234567890)www.nature.com/scientificreports/
Figure 10. Network distance between different carriers over time. (a) American Airlines—United Airlines, (b)
American Airlines—Delta Air Lines, (c) American Airlines—Southwest Airlines, (d) United Airlines—Delta Air
Lines, (e) United Airlines—Southwest Airlines, and (f) Delta Air Lines—Southwest Airlines.
The box plots for the entries of the network distance matrix for each pair of carriers are shown in Fig. 11.
Consistent with Fig. 10a, the AA and UA networks seem to be more similar to each other on average than
the other pairs. We then carried out the Kruskal–Wallis test and found that there was a significant difference
in these distributions ( p < 0.001). The Bonferroni-corrected Mann–Whitney U test as a post-hoc test revealed
that there were significant differences in the p-values for all 15 pairs with various effect sizes (see Table 2 for the
statistical results). In particular, the network distance values for AA-UA are smaller than those for any other
carrier pairs with strong effect sizes (r > 0.5). The network distance values for AA-DL are also smaller than the
other carrier pairs except for the AA-UA pair with strong effect sizes (r > 0.5). These results indicate that these
two carrier pairs are more similar than the other carrier pairs.
Scientific Reports | (2021) 11:5514 | https://doi.org/10.1038/s41598-021-84337-z 11
Vol.:(0123456789)www.nature.com/scientificreports/
Effect size, r
AA-UA vs. AA-DL 0.512***
AA-UA vs. AA-WN 0.866***
AA-UA vs. UA-DL 0.866***
AA-UA vs. UA-WN 0.855***
AA-UA vs. DL-WN 0.865***
AA-DL vs. AA-WN 0.742***
AA-DL vs. UA-DL 0.693***
AA-DL vs. UA-WN 0.585***
AA-DL vs. DL-WN 0.621***
AA-WN vs. UA-DL 0.304***
AA-WN vs. UA-WN 0.134***
AA-WN vs. DL-WN 0.243***
UA-DL vs. UA-WN 0.151***
UA-DL vs. DL-WN 0.0112***
UA-WN vs. DL-WN 0.0551***
Table 2. Results of the Bonferroni-corrected Mann–Whitney U test to compare all 15 pairs of carriers in
terms of d. *** p < 0.001.
Figure 11. Distribution of the network distance for the pairs of carriers.
To search for the origin of the observed similarities and dissimilarities between carrier pairs, we show the
time series of the total number of edges shared by two carriers in each month and the number of such shared
edges connecting to some major airports in Fig. 12. Figure 12a indicates that the relatively large similarity in the
entire observation period between AA and UA originates from the shared edges connecting to ORD (O’Hare
International Airport), which has been a major hub for both AA and UA. Figure 12b indicates that AA and
DL became more dissimilar around 2005 because DL closed a hub at DFW, which we also observed in Fig. 7g.
Figure 12c indicates that AA and WN became more similar around 2015. This is because AA merged with US,
one of whose major airports had been PHX, as we also observed in Fig. 7b. Figure 12d indicates that most of the
edges that UA and DL share originate from the operations at LAX. Figure 12e,f indicates that WN became more
similar to UA and DL because WN increased the number of edges at DEN and ATL, which we also observed in
Fig. 7i. These results indicate that large part of the similarity in each carrier pair originates from operations at a
single airport shared by the two carriers.
Discussion
We proposed a framework for analyzing evolution patterns in temporal air transport networks. We applied the
proposed methods to the four largest carriers in the US, i.e., AA, UA, DL, and WN, between 1987 and 2019. We
found that their overall evolution patterns were different. Specifically, our analysis suggested that WN changed
the network structure more than the other carriers and that DL changed the network structure more than AA and
UA. Their evolution patterns are also different in terms of the temporal variability and the strength of periodicity.
Furthermore, we found that each carrier experienced abrupt changes in their network structure. We also found
that the temporal variability and the strength of periodicity tended to increase in the latest years.
All the four carriers drastically changed their network structure in January 1995. In addition, they strength-
ened the periodicity after 1995. To the best of our knowledge, this change point is not related to any major socio-
economic and industrial events. The reason for this change point is unclear. We also showed that the three FSCs
(i.e., AA, UA, and DL) substantially changed their network structure upon the post-bankruptcy mergers. On the
Scientific Reports | (2021) 11:5514 | https://doi.org/10.1038/s41598-021-84337-z 12
Vol:.(1234567890)www.nature.com/scientificreports/
Figure 12. Evolution of the number of edges shared by pairs of carriers. We show the total number of shared
edges and the number of shared edges connecting to major airports for each pair of carriers. (a) American
Airlines versus United Airlines, (b) American Airlines versus Delta Air Lines, (c) American Airlines versus
Southwest Airlines, (d) United Airlines versus Delta Air Lines, (e) United Airlines versus Southwest Airlines,
and (f) Delta Air Lines versus Southwest Airlines. ORD: O’Hare International Airport, DFW: Dallas/Fort
Worth International Airport, PHX: Phoenix Sky Harbor International Airport, LAX: Los Angeles International
Airport, DEN: Denver International Airport, ATL: Hartsfield–Jackson Atlanta International Airport.
other hand, we did not detect notable changes in the network structure upon the 9/11 attacks, the bankruptcies,
and the exits from the bankruptcies, except for a change point for DL three months after the bankruptcy. There
are different possible mechanisms that may have produced these results. First, these events may have triggered
drastic changes in the network structure, but on a shorter time scale than a month. Analysis of weekly or daily
snapshot networks may be fruitful; our methods are not selective of the time scale, and detailed flight data for the
US carriers with a time resolution of minutes is available at the US Bureau of Transportation Statistics38. Second,
only the number of flights between airports may have primarily changed in response to such events. Although
we have assumed unweighted networks in the present article, if one modifies the network distance measure to
accommodate weighted networks, the methods are directly applicable to the case of weighted temporal networks.
These research directions warrant future work.
We showed that WN, which is an LCC, has shown particularly distinct patterns of evolution over years as
compared to the FSCs, such as a consistent growth trend in terms of the number of nodes and edges, relatively
fast changes in the network structure, and lack of periodicity when the data from all years are combined. To
generalize these results to differences between LCCs and FSCs, one needs more thorough analyses of different
carriers, such as LCCs and FSCs in Europe and Asia, where LCCs have been rapidly growing. We opted to study
the US case in the present study because of the availability of the data.
Our data-analytic framework is also applicable to different contexts. For example, an application to airline
alliances (e.g., Oneworld, SkyTeam, and Star Alliance) may reveal influences of entries and exits of carriers on the
networks of airline alliances over years. Another direction is to study influences of natural disasters on the struc-
ture of air transport networks. For example, ash cloud caused by the volcanic eruption in Iceland in 2010 affected
the structure of the European air transport networks48,49. Another possible application is to study influences of
epidemic outbreaks including the COVID-19 pandemic, which is ongoing as of mid 2020. Obviously, carriers
Scientific Reports | (2021) 11:5514 | https://doi.org/10.1038/s41598-021-84337-z 13
Vol.:(0123456789)www.nature.com/scientificreports/
have been slashing down flights (corresponding to the edge weight) and edges due to the drop in the demand.
In addition to this, some carriers may be strategically maintaining their network structure to be as similar as
possible, or perhaps the converse, to that before COVID-19. Some carriers may also be changing the similarity
of their network to other carriers’ networks. Finally, the proposed methods including the analysis of periodicity
are not specific to air transportation networks such that they are applicable to temporal networks in general.
Received: 28 May 2020; Accepted: 15 February 2021
References
1. Brown, A. E. The Politics of Airline Deregulation (University of Tennessee Press, Knoxville, 1987).
2. Goetz, A. R. & Vowles, T. M. The good, the bad, and the ugly: 30 years of us airline deregulation. J. Transp. Geogr. 17, 251–263
(2009).
3. Ren, J. Fare impacts of southwest airlines: A comparison of nonstop and connecting flights. J. Air Transp. Manag. 84, 101771 (2020).
4. Brueckner, J. K., Lee, D. & Singer, E. S. Airline competition and domestic us airfares: A comprehensive reappraisal. Econ. Transp.
2, 1–17 (2013).
5. Alderighi, M., Cento, A., Nijkamp, P. & Rietveld, P. Competition in the European aviation market: The entry of low-cost airlines.
J. Transp. Geogr. 24, 223–233 (2012).
6. Zhang, A., Hanaoka, S., Inamura, H. & Ishikura, T. Low-cost carriers in Asia: Deregulation, regional liberalization and secondary
airports. Res. Transp. Econ. 24, 36–50 (2008).
7. Ito, H. & Lee, D. Assessing the impact of the September 11 terrorist attacks on us airline demand. J. Econ. Bus. 57, 75–95 (2005).
8. Ciliberto, F. & Schenone, C. Bankruptcy and product-market competition: Evidence from the airline industry. Int. J. Ind. Organ.
30, 564–577 (2012).
9. Steven, A. B., Yazdi, A. A. & Dresner, M. Mergers and service quality in the airline industry: A silver lining for air travelers?. Transp.
Res. E 89, 1–13 (2016).
10. Oroian, I. Eyjafjallajökull volcano eruption—a brief approach. ProEnvironment Promediu 3 (2010).
11. Harry, R. IATA: Worst year for air cargo since 2009 financial crisis. Air Cargo News (February 6, 2020). Retrieved from https://
www.aircargonews.net/airlines/iata/ (Access Date May 27, 2020).
12. Harper, J. Flybe’s collapse could be ‘first of many’ airlines. BBC News (March 6, 2020). Retrieved from https://www.bbc.com/news/
business-51748139 (Access Date May 27, 2020).
13. Rocha, L. E. C. Dynamics of air transport networks: A review from a complex systems perspective. Chin. J. Aeronaut. 30, 469–478
(2017).
14. Holme, P. & Saramäki, J. Temporal networks. Phys. Rep. 519, 97–125 (2012).
15. Holme, P. Modern temporal network theory: A colloquium. Eur. Phys. J. B 88, 234 (2015).
16. Masuda, N. & Lambiotte, R. A Guide to Temporal Networks 2nd edn. (World Scientific, Singapore, 2020).
17. Holme, P. & Saramäki, J. Temporal Network Theory (Springer, Cham, 2019).
18. Bieger, T. & Wittmer, A. Airline strategy: From network management to business models. In Aviation Systems: Management of the
Integrated Aviation Value Chain (eds Wittmer, A. et al.) 77–102 (Springer, Berlin, 2011).
19. Li-Ping, C. et al. Structural properties of us flight network. Chin. Phys. Lett. 20, 1393 (2003).
20. Guimera, R. & Amaral, L. A. N. Modeling the world-wide airport network. Eur. Phys. J. B 38, 381–385 (2004).
21. Guimera, R., Mossa, S., Turtschi, A. & Amaral, L. N. The worldwide air transportation network: Anomalous centrality, community
structure, and cities’ global roles. Proc. Natl. Acad. Sci. U.S.A. 102, 7794–7799 (2005).
22. Guida, M. & Maria, F. Topology of the Italian airport network: A scale-free small-world network with a fractal structure? Chaos
Solitons Fractals 31, 527–536 (2007).
23. Bagler, G. Analysis of the airport network of India as a complex weighted network. Physica A 387, 2972–2980 (2008).
24. Xu, Z. & Harriss, R. Exploring the structure of the US intercity passenger air transportation network: A weighted complex network
approach. GeoJournal 73, 87 (2008).
25. Cheung, D. P. & Gunes, M. H. A complex network analysis of the united states air transportation. In Proc. 2012 IEEE/ACM Inter‑
national Conference on Advances in Social Networks Analysis and Mining, 699–701 (2012).
26. Rocha, L. E. C. Structural evolution of the Brazilian airport network. J. Stat. Mech. 2009, P04020 (2009).
27. Wang, J., Mo, H. & Wang, F. Evolution of air transport network of China 1930–2012. J. Transp. Geogr. 40, 145–158 (2014).
28. Dai, L., Derudder, B. & Liu, X. The evolving structure of the southeast Asian air transport network through the lens of complex
networks, 1979–2012. J. Transp. Geogr. 68, 67–77 (2018).
29. Sun, X., Wandelt, S. & Linke, F. Temporal evolution analysis of the European air transportation system: Air navigation route
network and airport network. Transportmetrica B 3, 153–168 (2015).
30. Azzam, M., Klingauf, U. & Zock, A. The accelerated growth of the worldwide air transportation network. Eur. Phys. J. Special Topics
215, 35–48 (2013).
31. Lin, J. & Ban, Y. The evolving network structure of US airline system during 1990–2010. Physica A 410, 302–312 (2014).
32. Lordan, O., Sallan, J. M. & Simo, P. Study of the topology and robustness of airline route networks from the complex network
approach: A survey and research agenda. J. Transp. Geogr. 37, 112–120 (2014).
33. Han, D.-D., Qian, J.-H. & Liu, J.-G. Network topology and correlation features affiliated with European airline companies. Physica
A 388, 71–81 (2009).
34. Reggiani, A., Signoretti, S., Nijkamp, P. & Cento, A. Network measures in civil air transport: A case study of Lufthansa. In Networks,
Topology and Dynamics (eds Naimzada, A. K. et al.) 257–282 (Springer, Berlin, 2009).
35. Marwan, N., Romano, M. C., Thiel, M. & Kurths, J. Recurrence plots for the analysis of complex systems. Phys. Rep. 438, 237–329
(2007).
36. Masuda, N. & Holme, P. Detecting sequences of system states in temporal networks. Sci. Rep. 9, 795 (2019).
37. Lopes, M. A. et al. Recurrence quantification analysis of dynamic brain networks. Eur. J. Neurosci. 53, 1040–1059 (2021).
38. Bureau of Transportation Statistics. Airline on-time performance databases. https://www.bts.gov/topics/airlines-and-airports-0
(Access Date May 2, 2020).
39. Kruskal, W. H. & Wallis, W. A. Use of ranks in one-criterion variance analysis. J. Am. Stat. Assoc. 47, 583–621 (1952).
40. Mann, H. B. & Whitney, D. R. On a test of whether one of two random variables is stochastically larger than the other. Ann. Math.
Stat., 50–60 (1947).
41. Rosenthal, R., Cooper, H. & Hedges, L. Parametric measures of effect size. Handb. Res. Synth. 621, 231–244 (1994).
42. Cohen, J. Statistical Power Analysis for the Behavioral Sciences (Lawrence Erlbaum Associations, Mahwah, 1988).
43. Wiener, N. Cybernetics or Control and Communication in the Animal and the Machine (MIT Press, Cambridge, 2019).
Scientific Reports | (2021) 11:5514 | https://doi.org/10.1038/s41598-021-84337-z 14
Vol:.(1234567890)www.nature.com/scientificreports/
44. Dunn, J. C. A fuzzy relative of the isodata process and its use in detecting compact well-separated clusters. J. Cybern. 3, 32–57
(1974).
45. Murray, J. D. et al. A hierarchy of intrinsic timescales across primate cortex. Nat. Neurosci. 17, 1661–1663 (2014).
46. Cavanagh, S. E., Wallis, J. D., Kennerley, S. W. & Hunt, L. T. Autocorrelation structure at rest predicts value correlates of single
neurons during reward-guided choice. Elife 5, e18937 (2016).
47. Watanabe, T., Rees, G. & Masuda, N. Atypical intrinsic neural timescale in autism. Elife 8, e42256 (2019).
48. Wilkinson, S. M., Dunn, S. & Ma, S. The vulnerability of the European air traffic network to spatial hazards. Nat. Hazards 60,
1027–1036 (2012).
49. Dunn, S. & Wilkinson, S. M. Increasing the resilience of air traffic networks using a network graph theory approach. Transp. Res.
E 90, 39–50 (2016).
Acknowledgements
K.S. acknowledges the financial support by JSPS. N.M. acknnowledges the financial support by AFOSR European
Office.
Author contributions
N.M. conceived and designed the research; K.S. collected and analyzed the data; K.S. and N.M. wrote the paper.
Competing interests
The authors declare no competing interests.
Additional information
Supplementary information The online version contains supplementary material available at https://doi.
org/10.1038/s41598-021-84337-z.
Correspondence and requests for materials should be addressed to N.M.
Reprints and permissions information is available at www.nature.com/reprints.
Publisher’s note Springer Nature remains neutral with regard to jurisdictional claims in published maps and
institutional affiliations.
Open Access This article is licensed under a Creative Commons Attribution 4.0 International
License, which permits use, sharing, adaptation, distribution and reproduction in any medium or
format, as long as you give appropriate credit to the original author(s) and the source, provide a link to the
Creative Commons licence, and indicate if changes were made. The images or other third party material in this
article are included in the article’s Creative Commons licence, unless indicated otherwise in a credit line to the
material. If material is not included in the article’s Creative Commons licence and your intended use is not
permitted by statutory regulation or exceeds the permitted use, you will need to obtain permission directly from
the copyright holder. To view a copy of this licence, visit http://creativecommons.org/licenses/by/4.0/.
© The Author(s) 2021
Scientific Reports | (2021) 11:5514 | https://doi.org/10.1038/s41598-021-84337-z 15
Vol.:(0123456789)You can also read