2022 MIDYEAR MARKET UPDATE
←
→
Page content transcription
If your browser does not render page correctly, please read the page content below

2022 MIDYEAR MARKET UPDATE
IDY  E AR
                                               M          TS
                                                 H LIG  H
                                              HIG

In many ways, 2022 has felt like the first year of “normalcy” as we emerge from the pandemic. Vaccines have been available for over
a year, events have resumed, and workers are returning to the office at increasing rates. That has been borne out during the first half
of this year as Downtown Cleveland has seen growth or stabilization across the residential, office, and hospitality sectors. At the same
time, though, our national and local economies deal with continued challenges, and it is too soon to speak with certainty about how
the long-term recovery of downtowns will look. DCA is focused on accelerating our recovery by uplifting small businesses, supporting
development, and enhancing the pedestrian experience in Downtown Cleveland to make it a place in which it is easy and attractive to
live, work, visit, and invest.

6M
                                                                                                                               2020
5M                                                                                                                             2021
                                                                                                                               2022
4M

3M

2M

1M
            Jan                Feb               Mar                Apr               May                Jun              Source: Placer

                                          Number of Visitors in Downtown Cleveland

                                                                                                         2022 MIDYEAR MARKET UPDATE | 1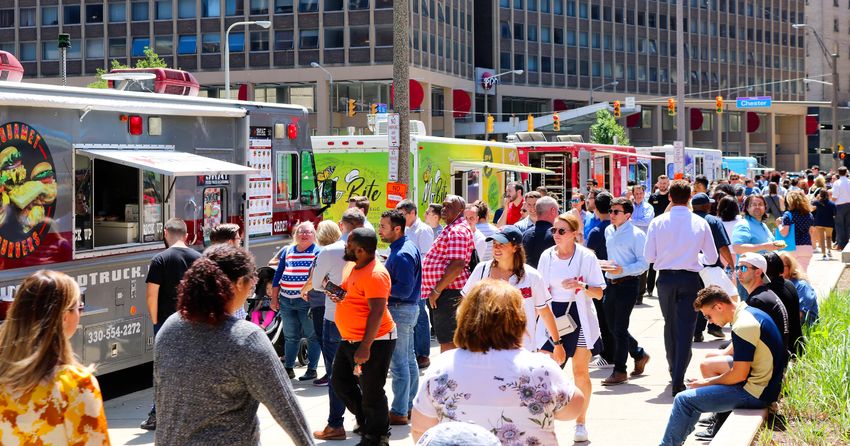
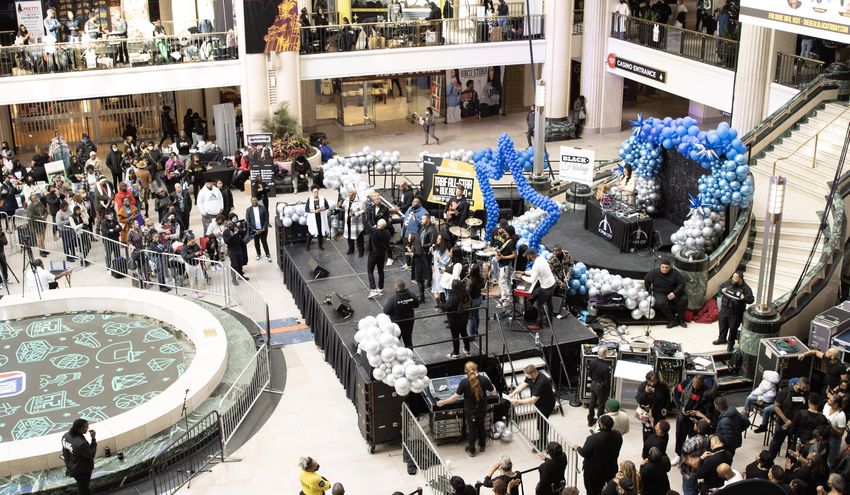
Jumpstarting the urban economy relies upon people regularly choosing to come to Downtown Cleveland. For the past nine months,
DCA has been tracking this using foot traffic as the central metric. This has been a bright spot in the first half of the year, as we have
experienced a steady upward trend in activity, with occasional dips caused by emerging COVID-19 variants or severe weather, and
occasional spikes caused by major events like the NBA All-Star Game, St. Patrick’s Day parade, and Pride in the CLE. So far this year,
24.2 million visits have been made to Downtown Cleveland, over 6 million more than the same time frame last year.

Visitors and eventgoers, while critical to the health of the city, are only one piece of the puzzle.
Downtown Cleveland’s long-term recovery will require stabilization of our workforce and

                                                                                                                         OFFICE
sustained growth of our population, both of which show signs of hope. Downtown led the
Cleveland area office market in net absorption with almost 59k square feet. Employers continue
to develop their return to office policies, influencing their real estate needs. Though some
companies are downsizing their spaces, we are seeing a flight to quality as others move                                  85.6%
                                                                                                                         overall occupancy
to highly-amenitized (and in some cases larger) offices to cultivate attractive workplaces                               Midyear 2022

for their returning employees. Overall occupancy rates reached 85.6%.

Downtown’s residential population is a strength in terms of our economic recovery and
neighborhood vitality. In the first half of this year, housing occupancy reached over 91%, the
                                                                                                                         HOUSING
highest since 2019, even with the recent addition of 114 new units at 75 Public Square which                             91%
                                                                                                                         residential occupancy
aims to be nearly full by fall. Rising occupancy rates amid growing housing stock means                                  Midyear 2022
that the market is able to continually absorb units, indicating a sustained demand for
downtown living. Overall, $825 million of construction is currently underway, adding over 968
rental units and 14 townhouses.
                                                                                                                        HOSPITALITY
Finally, our hospitality industry has made a comeback with an average occupancy rate of
47.2%. March and May occupancy surpassed 50%, 50.6% and 57% respectively, soaring
                                                                                                                        47.2%
                                                                                                                        hotel occupancy
                                                                                                                        Midyear 2022
above January’s 32.8% according to STR data. The NBA All-Star weekend as well as the many
events held at the Huntington Convention Center, and resumed business travel are most likely
the main contributors to this recovery.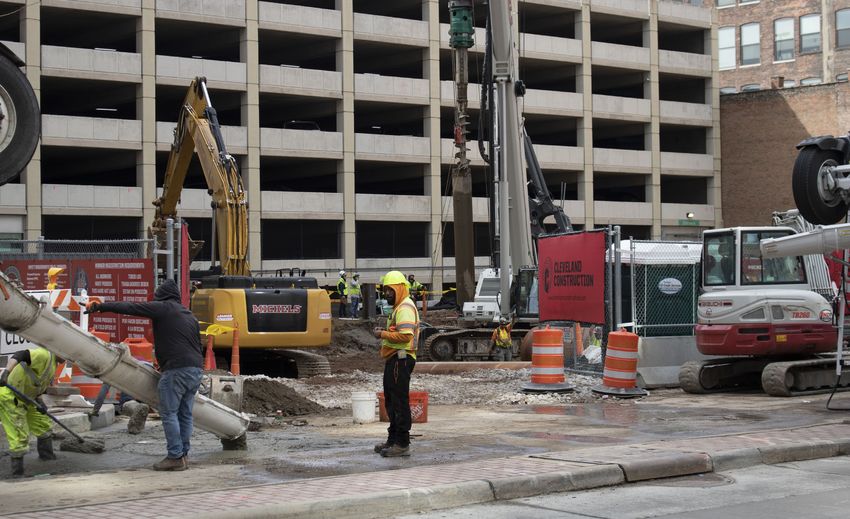
FIRST HALF HIGHLIGHTS
The Connection is Stronger Downtown Campaign
Launched multimedia strategic marketing campaign to rally the
                                                                    WHAT’S NEXT
community to get back to “real life” in Downtown Cleveland and
make it easy and attractive for workers to return to the office.
                                                                    DCA Organizational Strategic Plan
                                                                    Deliver our first organizational strategic plan early this
                                                                    fall, guiding our work as we lead Downtown’s recovery
Employer Return-to-Work Toolkit                                     over the next five years.
Developed a platform of resources for employers to make the
transition back to the office as seamless as possible.              Downtown Transportation TLCI Study
                                                                    Complete our work with NOACA to provide
Development Advocacy                                                recommendations to improve Downtown’s
                                                                    transportation network to enhance livability.
Advocated for a development-friendly and investment-ready
Downtown through the City’s new residential tax abatement
policy, an expanded State Historic Tax Credit program (SB
225), an improved property tax valuation and administration
                                                                    Superior Hill Park Mural
process (HB 126), and a Transformational Mixed-Use Tax Credit       Add public art and colorful seating to this formerly
award for Millennia’s Centennial project to add over 800 units of   underutilized park in the Warehouse District.
workforce housing.

New Events and Activations                                          Lighthouse Park
                                                                    Complete the development of Lighthouse Park in the
Activated our public spaces to create an exciting Downtown          Warehouse District, which will add a fun amenity to the
environment with new events including Lunch in the Lane,            neighborhood and honor the area’s history.
Music on the Malls, Paint in the Park, and Warehouse
Wednesday: Courtyard Crawl.
                                                                    CrossCountry Mortgage
Sherwin-Williams Groundbreaking                                     Welcome 650 new jobs to downtown this fall upon the
                                                                    completion of the new corporate headquarters.
Supported the start of construction on the one-million-square-
foot global headquarters in the heart of Downtown Cleveland.
                                                                    Seasonal Community Events
CleCoin                                                             Celebrate our 4-season city by producing beloved
                                                                    events including Christmas in July, Kid Fish CLE, and
Created a Downtown Cleveland currency that can be used at a         Winterfest.
variety of participating shops and restaurants to support local
businesses.

                                                                                           2022 MIDYEAR MARKET UPDATE | 3
HOUSING & DEVELOPMENT
For Sale Housing Unit Profile                                        Downtown Construction Projects
                         Q1 2022          Q1 2021         % CHANGE                                                Expected
                                                                                                   Investment                  Project
Properties Sold          24               16              +50%       Project                                      Completion
                                                                                                   Amount                      Scope
                                                                                                                  Date
Average Sale Price       $317,779         $270,023        +17%
                                                                     Sherwin Williams HQ           $400M          2024         1M sf
For Sale psf             $225.68          $197.39         +14%
                                                                     45 Erieview                   $102M          2024         368 units
                                                                     City Club Apartments          $100M          2023         300+ units
Housing Market                                                       Renaissance Hotel             $62M           2023         491 rooms
                         MIDYEAR 2022     Q1 2021         % CHANGE   55 Public Square              $59M           2022         221 units
Total Units              9,178            8,579           +7%        CrossCountry Mortgage HQ $46M                2022         168k sf
Occupancy                91%              83%             +800bps    Fidelity Hotel                $28M           2023         71 rooms
Average Rent psf         $1.72            $1.57           +9%        Flats East Bank Phase 3       $18M           2024              -
                                                                     Knez Townhomes Phase 2        $9M            2022         14 homes
                                                                     Lighthouse Park               $600k          2022              -
Housing Development                                                                        TOTAL   $825 million
                         UNDER CONSTRUCTION

Rental                   968

                                                                                20,500
For Sale                 14
                                                                                                                Downtown
                                                                      Q2 2022

 • 3000+ units planned for Downtown Cleveland, including MRN’s
 for-sale condo development, The Residences at the Guardian                                                     Residents
 • 900 planned for Flats alone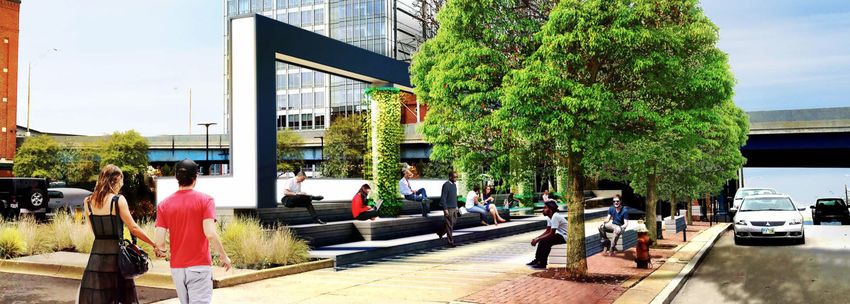
OFFICE
Office Market Statistics
                           CLASS A (JLL)   Q2 2021         CLASS B (CBRE)   Q2 2021         OVERALL (CBRE)           Q2 2021
Average Lease Rate         $24.99          $25.81          $18.00           $17.96          $20.34                   $19.84
Net Absorption             -31,395 sq/ft   -74,283 sq/ft   8,034 sq/ft      -66,108 sq/ft   58,918 sq/ft             -19,898 sq/ft
Occupancy                  85.0%           87.1%           85.5%            78.6%           85.6%                    81.1%

Notable Lease Signings
NAME                        ADDRESS                         BUSINESS TYPE                              SQ. FOOTAGE
Benesch                     Key Tower                       Legal                                      164,000
McDonalds Hopkins           Fifth Third Center              Legal                                      59,190
Reminger                    200 Public Square               Legal                                      58,568
Spaces                      Western Reserve                 Co-Working                                 27,000

HOSPITALITY
Hotel Performance Jan-May 2022
JAN-MAY      OCCUPANCY       AVERAGE DAILY RATE            REVPAR
2020         28.8%           $111.86                       $34.40
2021         36.0%           $145.55                       $52.34
2022         47.3%           $161.63                       $76.47

MONTH       OCCUPANCY        AVERAGE DAILY RATE            REVPAR
Jan         32.8%            $139.91                       $42.58
Feb         47.1%            $193.32                       $90.98
March       50.6%            $151.87                       $76.86
April       49.1%            $156.28                       $76.79
May         57.0%            $165.93                       $94.53

                                                                                                    2022 MIDYEAR MARKET UPDATE | 5
You can also read


