2021-2022 ESC SI Metrics Calculation Guide - Revised on 10.20.21 - Version1.1 - School ...
←
→
Page content transcription
If your browser does not render page correctly, please read the page content below
2021-2022 ESC SI Metrics
                             Calculation Guide

                                                     1
Revised on 10.20.21 - Version1.1
Division of School Improvement
                                                        Table of Contents
Chapter 1 – 2021-2022 SI Metrics Overview .............................................................................3
    About this Manual ...........................................................................................................................................3
    Glossary of Terms ............................................................................................................................................6
    System Processes………………………………………………………………………………………………………………………………………..7

Chapter 2 – ESC SI Summative Goals ............................................................................................8
Goal 1: Direct Improvement
    Summative Goal #1.1 .......................................................................................................................................9
    Summative Goal #1.2 .....................................................................................................................................10
    Summative Goal #1.3 .....................................................................................................................................11
    Summative Goal #1.1-1.3 Example Calculations………………………………………………………………………………………..12
Goal 3: Comprehensive Improvement
    Summative Goal #3.1......................................................................................................................................14
    Summative Goal #3.2......................................................................................................................................15
    Summative Goal #3 Calculation Examples…………………………………………………………………………………………………16

Chapter 3 – ESC SI Formative Metric Overview .....................................................................17
Goal Action 1: Plan Quality
    Formative Metric #1.1....................................................................................................................................18
Goal Action 2: ESF Diagnostic Visits
    Formative Metric #2.1 ...................................................................................................................................19
    Formative Metric #2.2 ...................................................................................................................................20
Goal Action 3: Capacity-Building Support
    Formative Metric #3.1....................................................................................................................................22
    Formative Metric #3.2....................................................................................................................................24
    Formative Metric #3.3....................................................................................................................................25

Chapter 4 – ESC Metric Submission Calendar.........................................................................26
    Data Submission Calendar..............................................................................................................................26
    Data Submission Information.........................................................................................................................27
    Communication & Contact Information.........................................................................................................27

Appendix – ESC Metrics Calculation Guide Version History.............................................28

                                                                                                                                                                  2
Revised on 10.20.21 - Version1.1
Chapter 1 – 2021-2022 School Improvement Metrics Overview
About this Manual
The 2021-2022 ESC Metrics Calculation Guide is a resource that explains how the Texas Education Agency
(TEA) uses data points to examine support continuous improvement efforts of Education Service Centers (ESC)
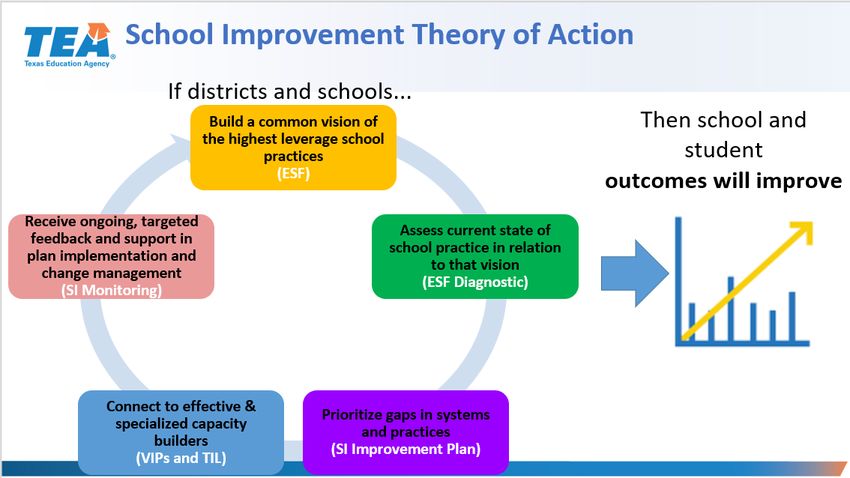
across the state of Texas. These metrics were created to test our School Improvement Theory of Action. The
guide describes each formative and summative metric and explains how information from different sources is
used to calculate the metrics. The assignment of a performance level for each metric is based on individual
ESC targets.
The 2021-2022 ESC Metrics Calculation Guide attempts to address all possible scenarios, but the ESCs in Texas
vary in size and diversity. If an ESCs performance calculation is affected by unforeseen circumstances, e.g., a
natural disaster, the Commissioner of Education (COE) will determine how or if that data source will be
modified. To guard against disruptions in performance management, ESCs should ensure that the focus for
metrics is around the strategies and theory of action to meet their targets. ESCs should plan for collection of
quantitative and qualitative data for analysis and adjustment throughout the year
Who participates in ESC SI Metrics?
All 20 ESCs will participate in SI metrics setting and performance management conversations for summative
and formative metrics throughout the 2021-2022 school year. Some of metrics will not be calculated this year
due pandemic-related challenges and the impact on school accountability systems.
ESC Metric Targets for Improvement
All 20 ESCs will participate in SI metrics setting and performance management conversations for summative
and formative metrics throughout the 2021-2022 school year. Some of the metrics will not
be calculated this year due pandemic-related challenges and impacts on school accountability systems.
ESC metric targets will be individualized; meaning, each ESC in collaboration with TEA will determine a target
for improvement based upon its local context such as number of campuses within the region, services offered,
etc. An ESC will receive a calculation for each of its summative goals and formative metrics.
3
Revised on 10.20.21 - Version1.1Continuous Improvement and Strategic Adjustment
Collecting data and testing our SI Theory of Action will allow us to best improve our approach and strategy at
the region and state level.
Several critical questions guide the design of the SI Metrics and their relationship to the Theory of Action:
Summative Metric Questions:
▪ Is what we are doing effective?
▪ Does our engagement and support lead to lasting change?
Formative Metric Questions:
▪ Are our ESF diagnostics effective in identifying the highest leverage gaps? Are districts participating in
in diagnostics even when they do not have to?
▪ Are diagnostics leading to strong Improvement Plans?
▪ Are diagnostics leading to a recognition that sustained improvement will often require the support of a
capacity builder?
▪ Are campuses executing on their plans?
▪ Is our capacity support desired? Are participants improving?
4
Revised on 10.20.21 - Version1.1Overview of the 2021-2022 ESC Metrics
ESC Metric Goals for School and District Improvement
The 2021-2022 ESC SI Metrics Calculation Guide describes the following two categories of goals:
Summative Goals
1. Direct Improvement - Improvement in campuses in the current school year.
2. Continuous Improvement - Improvement in campuses over time, primarily beyond the current school
year.
3. Comprehensive Improvement - Improvement in campuses designated as Comprehensive Support and
Improvement.
Formative Goals
1. Plan Support - Providing support to ensure high quality Targeted Improvement Plan (TIP) and
Turnaround Plan (TAP) submissions.
2. ESF Diagnostic Visits - Encouraging campus participation in Effective Schools Framework (ESF)
diagnostic visits and ensuring visit fidelity.
3. Connect Capacity-Builders - Supporting campus participation in high quality ESC Vetted
Improvement Programs (VIP).
5
Revised on 10.20.21 - Version1.1Glossary
• Education Service Center (ESC) - 20 Regional Service Centers were established to provide school
districts an array of services customized to the regional context. To see a map of counties and districts
in each ESC region, use the Texas Education Agency's School District Locator tool.
• Effective Schools Framework (ESF) - The Effective Schools Framework consists of a set of district
commitments, and for schools, essential actions. District Commitments describe what local education
agencies do to ensure that schools are set up for success. The Essential Actions describe what the most
effective schools do to support powerful teaching and learning. For more information visit
TexasESF.org.
• ESF Eligible Opt-In Campuses - Campuses that have not previously received an ESF diagnostic and are
not required to complete a diagnostic in 21-22 due to grant or other TEA program participation. ESF
diagnostics are “current” for three years (inclusive of the year the diagnostic is conducted).
• Fidelity of Implementation (FOI) – Refers to a measure that provides information about the extent to
which an action has been implemented. TEA and the Center for Effective Schools developed a rubric to
measure the fidelity of ESF Diagnostic Final Reports and ESF Diagnostic stakeholder survey data.
• Non-SI Engaged Campuses - All campuses in an ESC that do not have a required Targeted Improvement
Plan or Turnaround Plan submission to TEA.
• School Improvement Engaged (SI Engaged) - All campuses that have a required Targeted Improvement
Plan (TIP) OR Turnaround Plan (TAP) submission to TEA.
• TAP - Turnaround Plan. If a campus is assigned an unacceptable rating under Texas Education Code,
§39.054(e), for a second consecutive year, the campus must develop a campus Turnaround Plan to be
approved by the commissioner as described in Texas Education Code §97.1064. The Turnaround Plan is
an escalation from a targeted improvement plan (TIP) submission.
• TIL - Texas Instructional Leadership. Texas Instructional Leadership is a program where TEA provides
training and support to campus and district leaders on how to help build capacity of the educators that
they manage.
• TIP - Targeted Improvement Plan. If a campus's performance is below any standard under Texas
Education Code, §39.054(e), the campus shall engage in interventions as described by the Texas
Education Agency (TEA) including, but not limited to, a Targeted Improvement Plan. Campuses assigned
an unacceptable rating for two consecutive years escalate from a TIP to a Turnaround Plan (TAP).
• VIP - Vetted Improvement Program. Refers specifically to programs vetted by TEA to provide support
to campuses undergoing school improvement efforts. Texas Instructional Leadership is an example of a
VIP initiative.
6
Revised on 10.20.21 - Version1.1System Processes
ESC Campus Assignments
For the purposes of the SI ESC Metrics, all campuses included in the geographic region of an ESC are included in
an ESC’s list of campuses for which they are responsible for supporting. This includes all campuses
that received Title I, School Improvement Grant or ESF-Focused Support grant funds.
Charter Schools
Charter schools with headquarters in a single region and campuses across many are captured in the geographic
regions of the campuses. As part of the grant application process, charter schools were informed that they
should anticipate working with each geographic region with an awarded campus.
Paired Campuses
All campuses serving prekindergarten (PK) through grade 12 must receive an accountability rating. Campuses
that do not serve any grade level for which STAAR assessments are administered are paired with another
campus in the same district for accountability purposes. Paired campuses are included in these metrics as an
additional campus, and have their results based on the paired campuses results.
The list of campuses included in each ESC’s metrics will be made available by TEA on September 1st. Requests
for changes must be submitted by the ESCs by October 1st. Requests for changes are reviewed by School
Improvement staff based on the process and policies laid out in this manual.
District ESC Change Request Process
Districts may request to receive service from an ESC they are not geographically located in. This request should
be sent to AskTED@tea.texas.gov by the district superintendent. Approval of charter school ESC change
requests is subject to TEA approval through the Division of Charter School Administration.
7
Revised on 10.20.21 - Version1.1Chapter 2 - Summative Metrics
Overview of Summative Metrics
The nine Summative Metrics cover three performance goals that incorporate multiple data points for the ESCs.
The table below provides a description of each metric.
Goal 1 Title Description
Change in the Student Achievement Domain STAAR
1.1 SI Engaged Campus Improvement
Component Score of SI Engaged campuses.
Change in the Student Achievement Domain STAAR
1.2 SI Engaged VIP Campus
Component Score of SI Engaged campuses who are
Improvement
Direct enrolled in an ESC VIP program.
Improvement
Change in the Student Achievement Domain STAAR
1.3 Non-SI Engaged VIP Campus
Component Score of Non-SI Engaged campuses who
Improvement
are enrolled in an ESC VIP program.
1.4 Turnaround Plan Campus
Not Available in 2021-2022
Improvement
Goal 2 Title Description
2.1 F Campus Improvement Not Available in 2021-2022
Sustained 2.2 F Campus Regression Not Available in 2021-2022
Improvement
2.3 F Campus Long-Term Reduction Not Available in 2021-2022
Goal 3 Title Description
Change in the federal Comprehensive status of
3.1 Closing the Gaps Improvement “Bottom 5%” Comprehensive campuses from
Comprehensive Identified to Progress, or Progress to Exit.
Improvement
Change in the federal Comprehensive status of
3.2 Graduation Rate Improvement “Graduation Rate” Comprehensive campuses from
Identified to Progress, or Progress to Exit.
8
Revised on 10.20.21 - Version1.1Goal 1: Direct Improvement
Summative Metric 1.1: SI Engaged Campus Improvement
Overview
This metric provides a measure of the change in the state accountability Student Achievement Domain STAAR
Component Score average at SI Engaged campuses. SI Engaged campuses are those that have a required Targeted
Improvement Plan or Turnaround Plan submission to TEA. Improvement in the performances of these campuses is
signaled by positive values for this metric.
Data Sources
• 2021-2022 SI-Engaged Roster
• 2021 Accountability Results
• 2022 Accountability Results
Calculation
(21-22 SI-Engaged Campus 2022 STAAR Component Score Average)
-
(21-22 SI-Engaged Campus 2021 STAAR Component Score Average)
Calculation Process
Step One: Average all 21-22 SI Engaged Campus 2022 STAAR Component Scores.
Step Two: Average all 21-22 SI Engaged Campus 2021 STAAR Component Scores.
Step Three: Subtract step 2 result from the step 1 result. Round to the nearest whole number.
Notes
Example calculations shown after Summative 1.3.
Campuses that have a higher score in 2021 may have less room to grow than campuses that had a lower score in 2021.
While all campuses are being combined in this metrics, TEA will provide reference bars within the dashboards we
provide to campuses for the average growth of campuses with different performance levels in 2021. We encourage ESCs
to be mindful of these potential differences when setting targets.
Revised on 10.20.21 - Version1.1Goal 1: Direct Improvement
Summative Metric 1.2 SI Engaged VIP Campus Improvement
Overview
This metric measures change in the state accountability Student Achievement Domain STAAR Component Score average
at SI Engaged VIP campuses. SI Engaged campuses are those that have a required Targeted Improvement Plan or
Turnaround Plan submission to TEA. Vetted Improvement Program (VIP) refers specifically to programs vetted by TEA to
provide support to campuses undergoing school improvement efforts.
Data Sources
● 2021-2022 SI Engaged Roster
● 2021-2022 ESC VIP Participant Roster
● 2021 Accountability Results
● 2022 Accountability Results
Calculation
(21-22 SI Engaged VIP Campus 2022 STAAR Component Score Average)
-
(21-22 SI Engaged VIP Campus 2021 STAAR Component Score Average)
Calculation Process
Step One: Average all 21-22 SI Engaged VIP Campus 2021 STAAR Component Scores.
Step Two: Average all 21-22 SI Engaged VIP Campus 2022 STAAR Component Scores.
Step Three: Subtract step 2 result from the step 1 result. Round to the nearest whole number.
Notes
Example calculations shown after Summative 1.3.
Campuses that have a higher score in 2021 may have less room to grow than campuses that had a lower score in 2021.
While all campuses are being combined in this metrics, TEA will provide reference bars within the dashboards we
provide to campuses for the average growth of campuses with different performance levels in 2021. We encourage ESCs
to be mindful of these potential differences when setting targets.
10
Revised on 10.20.21 - Version1.1Goal 1: Direct Improvement
Summative Metric 1.3 Non-SI Engaged VIP Campus Improvement
Overview
This metric measures change in the state accountability Student Achievement Domain STAAR Component Score average
at Non-SI Engaged VIP campuses. Non-SI Engaged campuses are those that do not have a required Targeted
Improvement Plan or Turnaround Plan submission to TEA. Vetted Improvement Program (VIP) refers specifically to
programs vetted by TEA to provide support to campuses undergoing school improvement efforts.
Data Sources
● 2021-2022 SI Engaged Roster
● 2021-2022 ESC VIP Participant Roster
● 2021 Accountability Results
● 2022 Accountability Results
Calculation
(21-22 Non-SI Engaged VIP Campus 2022 STAAR Component Score Average)
-
(21-22 Non-SI Engaged VIP Campus 2021 STAAR Component Score Average)
Calculation Process
Step One: Average all 21-22 Non-SI Engaged VIP Campus 2021 STAAR Component Scores.
Step Two: Average all 21-22 Non-SI Engaged VIP Campus 2022 STAAR Component Scores.
Step Three: Subtract step 2 result from the step 1 result. Round to the nearest whole number.
Notes
Example calculations shown after Summative 1.3.
Campuses that have a higher score in 2021 may have less room to grow than campuses that had a lower score in 2021.
While all campuses are being combined in this metrics, TEA will provide reference bars within the dashboards we
provide to campuses for the average growth of campuses with different performance levels in 2021. We encourage ESCs
to be mindful of these potential differences when setting targets.
11
Revised on 10.20.21 - Version1.1Summative Metrics 1.1, 1.2, and 1.3 Example Data and Calculations
Example Data
Campus 2021 STAAR 2022 STAAR
21-22 Engagement? 21-22 VIP Participant?
Name Component Score Component Score
Alpha SI Engaged Yes 60 75
Beta Non-SI Engaged Yes 80 85
Gamma SI Engaged Yes 65 75
Delta Non-SI Engaged Yes 75 90
Epsilon SI Engaged Yes 55 70
Zeta Non-SI Engaged Yes 85 95
Eta SI Engaged No 50 60
Theta Non-SI Engaged No 90 90
Iota SI Engaged No 70 75
Kappa Non-SI Engaged No 85 90
Summative 1.1 Example Data and Calculation
Campus 21-22 21-22 VIP 2021 STAAR Component 2022 STAAR Component
Name Engagement? Participant? Score Score
Alpha SI Engaged Yes 60 75
Gamma SI Engaged Yes 65 75
Epsilon SI Engaged Yes 55 70
Eta SI Engaged No 50 60
Iota SI Engaged No 70 75
Example 1.1 Metric Calculation
2022 Average 71 (75,75,70,60,75)
2021 Average 60 (60,65,55,50,70)
Outcome +11 (71-60)
Summative 1.2 Example Data and Calculation
2021 STAAR 2022 STAAR
21-22 VIP
Campus Name 21-22 Engagement? Component Component
Participant?
Score Score
Alpha SI Engaged Yes 60 75
Gamma SI Engaged Yes 65 75
Epsilon SI Engaged Yes 55 70
12
Revised on 10.20.21 - Version1.1Example 1.2 Metric Calculation
2022 Average 73.33 (75,75,70)
2021 Average 60 (60,65,55)
Outcome +13 (73.33-60)
Summative 1.3 Example Data and Calculation
2021 STAAR 2022 STAAR
21-22 VIP
Campus Name 21-22 Engagement? Component Component
Participant?
Score Score
Beta Non-SI Engaged Yes 80 85
Delta Non-SI Engaged Yes 75 90
Zeta Non-SI Engaged Yes 85 95
Example 1.3 Metric Calculation
2021 Average 80 (80,75,85)
2022 Average 90 (85,90,95)
Outcome +10 (90-80)
13
Revised on 10.20.21 - Version1.1Goal 3: Comprehensive Improvement
Summative Metric 3.1: Closing the Gaps Improvement
Overview
This metric measures change in the federal comprehensive support and improvement assignments based on a campuses
designation as “Bottom 5%”. Improved Rating refers to a Comprehensive Identified Campus that moves to
Comprehensive Progress or a Comprehensive Progress campus that exits Comprehensive status.
Data Sources
• 2021 Comprehensive Campus Roster
• 2022 Comprehensive Campus Roster
Calculation
# of 2021 “Bottom 5%” Comprehensive Campuses with 2022 Improved Rating
/
# of 2021 “Bottom 5%” Comprehensive Campuses
Calculation Process
• Step 1: Count the # of 2021 “Bottom 5%” Comprehensive Campuses.
• Step 2: Count the # of 2021 “Bottom 5%” Comprehensive Campuses with 2022 Improved Ratings.
• Step 3: Divide step 2 result by step 1 result. Round to the nearest whole number.
14
Revised on 10.20.21 - Version1.1Goal 3: Comprehensive Improvement
Summative Metric 3.2: Graduation Rate Improvement
Overview
This metric measures change in the federal comprehensive support and improvement status assignments based on a
campuses designation of an insufficient Graduation Rate. An insufficient Graduation Rate is when both the federal 6-
year and 4-year graduation are less than 67%.
Data Sources
• 2021 Comprehensive Campus Roster
• 2022 Comprehensive Campus Roster
• 2021 Campus Federal Graduation Rates
• 2022 Campus Federal Graduation Rates
Calculation
# of 2021 “Graduation Rate” Comprehensive Campuses with 2022 Improved Rating
/
# of 2021 “Graduation Rate” Comprehensive Campuses
Calculation Process
• Step 1: Count the # of 2021 “Graduation Rate” Comprehensive Campuses.
• Step 2: Count the # of 2021 “Graduation Rate” Comprehensive Campuses with 2022 Improved Ratings.
• Step 3: Divide step 2 result by step 1 result. Round to the nearest whole number.
Summative Metrics 3.1 and 3.2 Example Calculations
Example Data
Campus Basis for Comprehensive Rating? 2021 Rating 2022 Rating Improved?
Alpha Bottom 5% Identified Identified No
Alpha Graduation Rate Identified Progress Yes
Beta Bottom 5% Identified Progress Yes
Gamma Bottom 5% Identified Progress Yes
Gamma Graduation Rate Progress Exit Yes
Delta Bottom 5% Progress Exit Yes
Epsilon Bottom 5% Progress Progress No
Zeta Graduation Rate Identified Progress Yes
Eta Graduation Rate Progress Progress No
Example 3.1 Calculation from Example Data
15
Revised on 10.20.21 - Version1.1Basis for Comprehensive
Campus 2021 Rating 2022 Rating Improved?
Rating?
Alpha Bottom 5% Identified Identified No
Beta Bottom 5% Identified Progress Yes
Gamma Bottom 5% Identified Progress Yes
Delta Bottom 5% Progress Exit Yes
Epsilon Bottom 5% Progress Progress No
Example 3.1 Metric Calculation
Process 3 out of 5 Campuses Improved Rating (Beta,Gamma,Delta)
Outcome 60%
Example 3.2 Calculation from Example Data
Basis for Comprehensive 2021
Campus Rating? Rating 2022 Rating Improved?
Alpha Graduation Rate Identified Progress Yes
Gamma Graduation Rate Progress Exit Yes
Zeta Graduation Rate Identified Progress Yes
Eta Graduation Rate Progress Progress No
Example 3.2 Metric Calculation
Process 3 out of 4 Campuses Improved Rating (Alpha, Gamma, Zeta)
Outcome 75%
16
Revised on 10.20.21 - Version1.1Chapter 3 – Formative Metrics
Overview of Formative Metrics
The Formative Metrics will cover seven formative goals that evaluate multiple data points for the ESCs. The
table below provides a description for each goal.
Goal Action 1 Title Description
This metric measures TIP submissions quality based on quality
1.1 TIP Quality
rubric proficiency scores.
Plan Quality
1.2 TAP Approval Not Available in 2021-2022.
Goal Action 2 Title Description
2.1 ESF Diagnostic This metric reflects the average Fidelity of Implementation
Fidelity Score of ESC ESF Facilitators as determined by the ESF
ESF Diagnostic Diagnostic FOI rubric.
Visits 2.2 ESF Diagnostic This metric measures campuses who opt-in to an ESF Diagnostic
Participation Visit in the current year.
Goal Action 3 Title Description
3.1 ESF Diagnostic This metric measures Vetted Improvement Program engagement by
Follow-Up VIP the number of eligible campuses that choose to sign up for an ESC
Engagement VIP service after receiving an ESF Diagnostic visit.
Capacity This metric measures the number of campuses within the region
3.2 VIP Participation
Building that sign up for an ESC VIP service.
Support
This metric measures educators receiving direct coaching from an
3.3 TIL Educator
ESC TIL coach that have shown mastery of an action step each
Mastery
month of program participation.
17
Revised on 10.20.21 - Version1.1Goal Action 1: Plan Quality
Formative Metric 1.1: TIP Quality
Overview
This metric measures TIP submissions quality based on quality rubric proficiency scores. A Targeted Improvement Plan is
assigned to a campus if their performance is below any standard under Texas Education Code (TEC), §39.054(e).
Proficient is defined as a TIP score that is greater than 70%.
Data Sources
● 2021-2022 TIP Submission Ratings (Data source to be updated after each round of TIP submissions)
Calculation
# of 2021-2022 TIP Submissions meeting proficiency target (70%+)
/
# of 2021-2022 TIP Submissions
Calculation Process
Step 1: Count total # of TIP submissions thus far in the school year.
Step 2: Count # of total TIP submissions meeting the proficiency target of 70%+ thus far in the school year.
Step 3: Divide step 2 result by step 1 result. Round to the nearest whole number.
Example Formative 1.1 Submission and Calculation
Example ESC consists of two campuses: Alpha and Beta.
Campus Window Window 1 Window 2 Window 2 Window 3 Window 3
Name 1 Result Proficient? Result Proficient? Result Proficient?
Alpha 70 Yes 75 Yes 90 Yes
Beta 60 No 65 No 85 Yes
Example Formative 1.1 Calculation
Alpha ISD Outcome 100% (3/3 Proficient)
Beta ISD Outcome 33% (1/3 Proficient)
Example ESC Outcome 67% (4/6 Proficient)
18
Revised on 10.20.21 - Version1.1Goal Action 2: ESF Diagnostic Visits
Formative Metric 2.1 ESF Diagnostic Fidelity
Overview
This metric reflects the average Fidelity of Implementation Score of ESC ESF Facilitators as determined by the ESF
Diagnostic FOI rubric.
Data Sources
• ESF Diagnostic FOI results
Calculation
Average FOI Score of Final Reports
Calculation Process
Step 1: Count # of FOI Scores in the ESC
Step 2: Sum all FOI scores in the ESC
Step 3: Divide step 2 result by step 1 result. Round to the nearest whole number.
Notes
• ESCs will receive up to 9 FOI scores.
• The survey component of this metric has been removed, with the hope of future inclusion based on further
research and analysis of the data’s validity and impact.
Example Formative 2.1 Submission and Calculation
District Name FOI Score
Campus 1 85
Campus 2 95
Campus 3 93
Example Formative 2.1 Calculations
Outcome 91% (Average of 85,95,93)
19
Revised on 10.20.21 - Version1.1Goal Action 2: ESF Diagnostic Visits
Formative Metric 2.2: ESF Diagnostic Participation
Overview
• This metric measures campuses who opt-in to an ESF Diagnostic Visit in the current year. ESF Eligible Opt-In
Campuses are campuses that have not previously received an ESF diagnostic and are not required to
complete a diagnostic in 21-22 due to grant or other TEA program participation. ESF diagnostics are
“current” for three years (inclusive of the year the diagnostic is conducted).
Data Sources
● ESF-Focused Support Grant and SI Grant Rosters
● ESF Diagnostic Visit Historical Roster
● ESF Diagnostic Current Year Sign-Up Roster
Calculation
# of ESF-Eligible Campuses who opt-in to an ESF Diagnostic Visit in 2021-2022
/
# of ESF-Eligible Campuses
Calculation Process
Step 1: Count total # of ESF-Eligible Campuses.
Step 2: Count total # of ESF-Eligible Campuses who opt-in to an ESF Diagnostic Visit in 2021-2022.
Step 3: Divide step 2 result by step 1 result. Round to the nearest whole number.
Note
• This metric does not include SI or ESF-Focused Support Grant participants. Per grant requirements, those
campuses must have an ESF Diagnostic, so they are not considered “opt-ins”.
20
Revised on 10.20.21 - Version1.1Example Formative 2.2 Data and Calculation
Current Year
ESF 2.2 Opt-In 2.2 Opt-
Campus Historical ESF Final ESF Final ESF
SI Grant? Support Eligible In
Name Submission Date Submission Eligible?
Grant? Campus? Campus?
Date
Alpha June 2019 February 2022 Yes Yes Yes
Beta December 2019 No No No
Gamma January 2022 Yes Yes No No
Delta March 2022 Yes Yes No No
Epsilon July 2020 No No No
Zeta Yes Yes No
Example Formative 2.2 Metric Calculation
Result 1 out of 2 Eligible Campuses Opted-In to a Current Year ESF Diagnostic ( Alpha and Zeta
Eligible, Alpha Opted-In)
Outcome 50%
21
Revised on 10.20.21 - Version1.1Goal Action 3: Capacity Building Support
Formative Metric 3.1: ESF Diagnostic Follow-Up VIP Engagement
Overview
This metric measures Vetted Improvement Program engagement by the number of eligible campuses that choose to
sign up for an ESC VIP service after receiving an ESF Diagnostic visit. See notes below for further clarification.
Data Sources
● ESF Diagnostic Visit Historical and Current Year Roster
● ESF-Focused Support Grant and SI Grant Rosters
● VIP Current Year Roster
Calculation
#of VIP Sign-Ups of VIP Sign-Up Eligible Campuses
/
# of VIP Sign-Up Eligible Campuses
Calculation Process
Step 1: Count total # of VIP Sign-Ups of VIP Sign-Up Eligible Campuses
Step 2: Count total # of VIP Sign-Up Eligible Campuses
Step 3: Divide step 2 result by step 1 result. Round to the nearest whole number.
Notes
● VIP Sign-Up Eligible campuses include:
○ Campuses that have received or will receive an ESF Diagnostic Visit in 2021-2022.
○ Are not ESF-Focused Support Grant participants.
● VIP sign-up must occur AFTER the ESF Diagnostic Visit, and the VIP cohort should begin before March 2022.
22
Revised on 10.20.21 - Version1.1Example Formative 3.1 Data and Calculation
Campus ESF Diagnostic Visit ESF Focused 3.1 Sign-Up Eligible 3.1 Sign-Up
Name Final Submission Date Support Grant? Campus? VIP Sign-Up Date Campus?
Alpha January 2021 Yes No No
Beta March 2021 Yes December 2021 Yes
Gamma March 2021 Yes March 2021 No
Delta November 2019 No No
Epsilon April 2020 Yes No No
Zeta August 2021 Yes September 2021 Yes
Example Formative 3.1 Metric Calculation
Process 2 out of 3 Eligible Campuses Signed Up for ESC VIP Services (Beta, Gamma, Zeta
Eligible; Beta, Zeta Signed Up
Outcome 67%
23
Revised on 10.20.21 - Version1.1Goal Action 3: Capacity Building Support
Formative Metric 3.2: VIP Participation
Overview
This metric measures the number of campuses within the region that sign up for an ESC VIP service.
Data Sources
● ESC VIP Current Year Roster
Calculation
#of Campuses who sign-up for an ESC VIP service
/
# of Campuses in the ESC Service Region
Calculation Process
Step 1: Count total # of campuses that sign up for an ESC VIP service.
Step 2: Count # of campuses in the ESC service region
Step 3: Divide step 2 result by step 1 result. Round to the nearest whole number.
Notes
This metric includes all ESC VIP signups (that don’t drop out of their participation) between March 2021-
February 2022.
24
Revised on 10.20.21 - Version1.1Goal Action 3: Capacity Building Support
Formative Metric 3.3: TIL Educator Mastery
Overview
This metric measures educators receiving direct coaching from an ESC TIL coach that have shown mastery of
an action step each month of program participation. This metric is calculated each month individually from
September 2021 to April 2022.
Data Sources
● TIL Action Step Mastery Submissions including the following monthly district values:
○ District Name
○ Campus Name
○ Month
○ # of Educators Receiving Coaching
○ # of Educators Receiving Coaching that Achieve Mastery
Calculation (Monthly)
# of educators receiving coaching from the ESC that have achieved mastery of an action step during
the month
/
# of educators receiving coaching from the ESC during the month
Calculation Process (Monthly)
• Step 1: Count the # of educators that have received coaching during ESC TIL program participation
• Step 2: Count the # of educators receiving coaching from the ESC that have achieved mastery of an
action step during the month.
• Step 3: Divide step 2 result by step 1 result. Round to the nearest whole number.
Notes:
• Number of Educators Receiving Coaching
o Given that TIL programs vary in lengths, the number of educators being coached by the ESC
through TIL fluctuates as new cohorts begin, and others come to completion.
o The “number of educators receiving coaching” should capture the number of educators that
are currently participating in a TIL cohort that the ESC has agreed to coach throughout the
length of the TIL cohort. This should include principal supervisors and principals.
o Do not include educators that the ESC coaches to model coaching for either a principal
supervisor or principal. For example, if the ESC is coaching at the principal supervisor level with
25
Revised on 10.20.21 - Version1.1Alpha ISD but conducts a coaching session with a principal in Alpha ISD to model coaching for a
principal supervisor, the ESC would NOT count the coaching of the principal in this metric.
o If the ESC is unable to conduct a coaching session in any given month with an educator that it is
coaching in a TIL cohort, that educator would still count under “number of educators receiving
coaching”. For example, if a principal supervisor cancels or reschedules a coaching session in
October, and the ESC is unable to conduct a coaching session with that principal supervisor in
that month, that principal supervisor would still count in the “number of educators receiving
coaching”.
• Action Step Mastery
o An action step should be considered “mastered” once the action step has been completed and
the educator is ready to move on to a new action step. This corresponds to “full
implementation” on the action steps tracker that ESCs use to track their coaching of principal
supervisors and principals. “Mastery” does not mean that the educator has achieved
perfection, but that the action step has been fully implemented and is no longer the focus of
coaching and follow up between the TIL Coach and the educator.
o For any given month, an action step should be counted as “mastered” if:
▪ It was assigned during a coaching session during the month in question
▪ It was “mastered” by the time the ESC submits its data on the 15th of the following
month
▪ For example, for the month of October, an ESC would consider an action step as
“mastered” that was assigned in a coaching session on October 20th and confirmed as
fully implemented on November 7th.
Example Formative 3.3 Submission and Calculations
Example ESC consists of two LEA’s: Alpha and Beta ISD.
District Name Month # of Educators # Achieving Mastery
Alpha ISD June 10 9
Alpha ISD July 15 9
Beta ISD June 5 3
Beta ISD July 5 4
Example Formative 3.3 Calculations
June # of Educators 15 (10+5)
June # Achieving Mastery 12 (9+3)
June Metric Outcome 80% (12/15)
July # of Educators 20 (15+5)
July # Achieving Mastery 13 (9+4)
July Metric Outcome 67% (13/20)
26
Revised on 10.20.21 - Version1.1Chapter 4 – ESC Metric Submission Calendar
Month Activity Date
September TEA Finalizes ESC Metric Denominator Rosters September 1st
Deadline for ESC revisions to campus denominator assignments October 1st
October
Monthly ESC Submission – should include March-September Activity October 15th
November Monthly ESC Submission - should include October Activity November 15th
December Monthly ESC Submission - should include November Activity December 15th
February Monthly ESC Submission - should include December & January Activity February 15th
March Monthly ESC Submission - should include February Activity March 15th
Monthly ESC Submission - should include March Activity
April April 15th
*VIP Sign-Ups no longer submitted/accepted
Monthly ESC Submission - should include April Activity
May May 15th
*VIP Sign-Ups no longer submitted/accepted
Final ESC Submission - should include May Activity
June June 15th
*VIP Sign-Ups no longer submitted/accepted
27
Revised on 10.20.21 - Version1.1Metric Submission Information
Monthly ESC submissions will consist of TIL Action Step Mastery Updates, ESF Diagnostic Opt-In Updates, and VIP Sign-
Ups. Data should be email to Joel Leagans at joel.leagans@tea.texas.gov.
NOTE: The last month for VIP Sign-Up submissions is March 15, 2022. This submission will include all February 2022 sign-
ups.
Communication and Contact Information
Direct communication is available through the Texas ESC Slack workspace at https://texasesc.slack.com/. Each ESC has a
dedicated channel in Slack for team communication and direct communication with TEA.
ESC Metric dashboards, as well as the most current version of this calculation guide, may be found at
https://siperformancegoals.esc13.net/.
Contact Joel Leagans at joel.leagans@tea.texas.gov for assistance setting up your Slack workspace, website password
requests, or any other SI Metric support.
28
Revised on 10.20.21 - Version1.1Metric Guide Version History
Version 1.1
• Addition of Continuous Improvement and Strategic Adjustment Page – pg. 4
o Page added to provide further understanding of the ESC SI Metrics system and the rationale
behind its creation and support.
29
Revised on 10.20.21 - Version1.1You can also read


