2018 Spring Update Customer Service - WE MAKE ENERGY HAPPEN - Williams
←
→
Page content transcription
If your browser does not render page correctly, please read the page content below

WE MAKE ENERGY HAPPEN

2018 Spring Update                  NYSE: WMB
                                    williams.com
Customer Service
Forward-looking Statements

> The reports, filings, and other public announcements of Williams Partners L.P. (WPZ) and Transcontinental Gas Pipe Line Company, LLC (Transco) may
   contain or incorporate by reference statements that do not directly or exclusively relate to historical facts. Such statements are "forward-looking
   statements" within the meaning of Section 27A of the Securities Act of 1933, as amended, and Section 21E of the Securities Exchange Act of 1934, as
   amended. We make these forward-looking statements in reliance on the safe harbor protections provided under the Private Securities Litigation Reform Act
   of 1995. Forward-looking statements can be identified by various forms of words such as “anticipates,” “believes,” “seeks,” “could,” “may,” “should,”
   “continues,” “estimates,” “expects,” “forecasts,” “intends,” “might,” “goals,” “objectives,” “targets,” “planned,” “potential,” “projects,” “scheduled,” “will,”
   “assumes,” “guidance,” “outlook,” “in service date” or other similar expressions. These forward-looking statements are based on management's beliefs and
   assumptions and on information currently available to management and include, among others, statements regarding:
       –   Our and our affiliates future credit ratings;
       –   Amounts and nature of future capital expenditures;
       –   Expansion and growth of our business and operations;
       –   Financial condition and liquidity;
       –   Business strategy;
       –   Cash flow from operations or results of operations;
       –   Rate case filings;
       –   Seasonality of certain business components
       –   Natural gas, natural gas liquids, and olefins prices, supply, and demand; and
       –   Demand for our services
> Forward-looking statements are based on numerous assumptions, uncertainties and risks that could cause future events or results to be materially different
   from those stated or implied in this presentation. Many of the factors that will determine these results are beyond our ability to control or predict. Specific
   factors that could cause actual results to differ from results contemplated by the forward-looking statements include, among others, the following:
        – Availability of supplies, market demand, and volatility of prices;
        – Inflation, interest rates, and fluctuation in foreign exchange rates and general economic conditions (including future disruptions and volatility in the
           global credit markets and the impact of these events on customers and suppliers);
        – The strength and financial resources of our competitors and the effects of competition;
        – Whether we are able to successfully identify, evaluate and execute investment opportunities;
        – Our ability to acquire new businesses and assets and successfully integrate those operations and assets into our existing businesses as well as
           successfully expand our facilities;
        – Development of alternative energy sources;
        – The impact of operational and developmental hazards and unforeseen interruptions;
        – Costs of, changes in, or the results of laws, government regulations (including safety and environmental regulations), environmental liabilities,
           litigation, and rate proceedings;

                                                                                                                                                                      2
Forward-looking Statements (cont’d)

        – Williams’ costs and funding obligations for defined benefit pension plans and other postretirement benefit plans;
        – Our allocated costs for defined benefit pension plans and other postretirement benefit plans sponsored by our affiliates;
        – Changes in maintenance and construction costs;
        – Changes in the current geopolitical situation;
        – Our exposure to the credit risk of our customers and counterparties;
        – Risks related to financing, including restrictions stemming from debt agreements, future changes in credit ratings as determined by nationally-recognized
          credit rating agencies and the availability and cost of capital;
        – The amount of cash distributions from and capital requirements of our investments and joint ventures in which we participate;
        – Risks associated with weather and natural phenomena, including climate conditions and physical damage to our facilities;
        – Acts of terrorism, including cybersecurity threats and related disruptions;
        – Additional risks described in our filings with the Securities and Exchange Commission (SEC)
>   Given the uncertainties and risk factors that could cause our actual results to differ materially from those contained in any forward-looking statement, we caution
    investors not to unduly rely on our forward-looking statements. We disclaim any obligations to and do not intend to update the above list or announce publicly the
    result of any revisions to any of the forward-looking statements to reflect future events or developments.
>   In addition to causing our actual results to differ, the factors listed above may cause our intentions to change from those statements of intention set forth in this
    presentation. Such changes in our intentions may also cause our results to differ. We may change our intentions, at any time and without notice, based upon
    changes in such factors, our assumptions, or otherwise.
>   Investors are urged to closely consider the disclosures and risk factors in WPZ’s and Transco’s annual reports on Form 10-K filed with the SEC on Feb. 25, 2015,
    and each of our quarterly reports on Form 10-Q available from our offices or, in the case of WPZ, from our websites at www.williams.com and
    www.investor.williams.com

                                                                                                                                                                            3
Commercial Operations - Customer Services

                                                     Gary Duvall
                                                    VP Transco
                                                    Commercial

                                                   Hector Alatorre
                                                      Director
                                                  Customer Services

       Keith Higginbotham                           John Cassapo                              Suzanne Heiser
                                   Bill Eiser                         Martha Janousek
           Manager                                                                            Laurie Catlett
                                                                         Manager
                                                                                                  Leads
                                   Business           Business
                                Development –      Development –      Customer Service
        Customer Service        Production Area     Market Area          Contracts            Transportation
                                                                                                Marketing

                                                                            Paul Prodoehl
               Toi Anderson
                                                                            Celyna Ebohon
              Cindy Hungate
                                                                          Laarni Hernandez
              Andrea Beltran
                                                                            Karen Gallardo
               James Corley
                Liz Hughes
                                                                          Contract Analysts
                 Sean Xin
             Customer Service
             Representatives

                                                                                                               4
Strategic Asset Position

                            CONNECTING THE BEST
                                 SUPPLIES
                               Marcellus-Utica,
                                 Gulf Coast
                            TO THE BEST MARKETS
                            New York City, Washington
                            D.C., Philadelphia, Florida,
                               Atlanta, LNG export

                           • Nations largest-volume interstate
                             pipeline system
                           • 9,700 miles of pipeline with 14.98
                             MMdth of gas per day for system-
                             wide delivery capacity (As of
                            12/31/17)
                           • 50 compressor stations, four
                             underground storage fields and
                             one LNG storage facility
                           • Competitively positioned between
                             strong supply and demand areas
                             along eastern seaboard

                                                             5
Transco Peak Day Deliveries and System Capacity

Note: Includes all system deliveries and all Zones.

                                                      6
Weather

   Location     January 4, 2018   January 5, 2018   January 6, 2018
                  High / Low        High / Low        High / Low
    New York        29 / 19            19 / 9            13 / 6

    Charlotte       34 / 18            36 / 8           34 / 12

     Atlanta        35 / 20           38 / 16           39 / 20

     Tampa          56 / 38           60 / 35           61 / 41

                                                                      7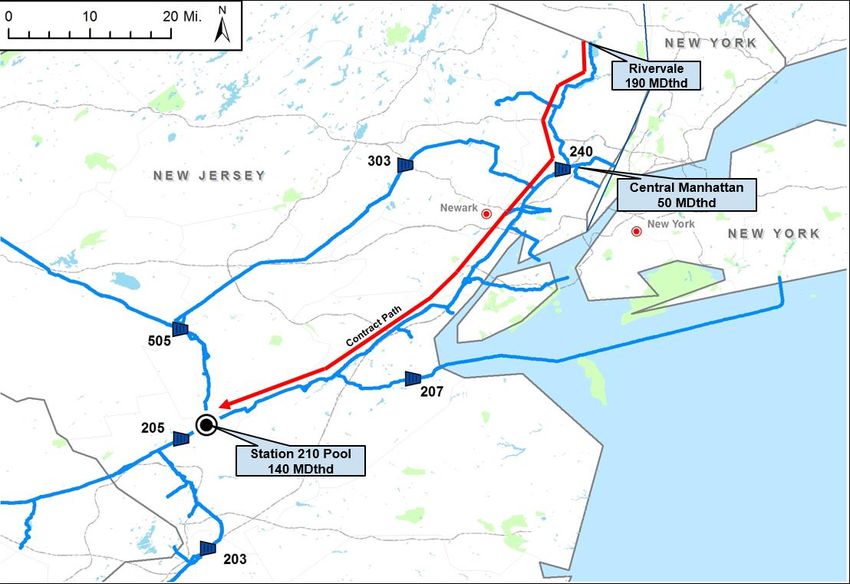
Peak Day Delivery Quantities by State

         3,500

         3,000

         2,500
MMscfd

         2,000

         1,500

         1,000

          500

            0
                 TX   LA   MS   AL       GA      SC        NC      VA   MD   PA   NJ   NY

                                     1/5/2018   1/8/2017   1/18/2016

                                                                                            8
Takeaways From Winter &
    Opportunities Going Forward
>   Transco system was stressed, but performed well. Many teams worked long hours managing equipment
    issues, storage changes, gas scheduling activity, etc.

>   Peak day occurred on a Friday which allowed the system to recover over the weekend.

>   OFO issuance and limitations on availability of non-primary firm transportation helped manage capacity
    and system suppliers performed well given the temperatures and potential production freeze off issues.

>   The Transco system continues to expand and has transformed into a bi-directional system, highlighting the
    need for additional collaboration between Pipeline Control and Operations and customer activity driving
    dynamic system operations, requiring frequent operating changes.

>   Large deliveries dependent on a fixed set of assets requiring timely and frequent communication and
    coordination, both internal and external.

>   Increase opportunities for dialogue and collaboration between Pipeline Control and customers, better
    understanding their needs and enhancing operating relationships.

>   Opportunities for additional pipeline control focus and engagement on near and longer term system
    outage and modernization needs.

                                                                                                                9
Supply / Demand Forecast: 2016-2021
Anadarko, Arkoma and Appalachian Basin
+15
23 38
+1 +1 +2
14 15 11 12 15 17
+1
13 14
+3
35 38 +10 +3
26 36 12 15
Regional Production change,
2016 to 2021 (Bcf/d) (1)
Regional Demand change,
2016 to 2021 (Bcf/d) (1)
(1) Size of bubble indicates magnitude of 2021 production or demand
Source: Wood Mackenzie 1H 2017, excludes impact of net Canadian imports.
Data contained in this slide is property of Wood Mackenzie. Per Williams’ agreement, data may only be used for
individual customer meetings unless prior consent is received. Do not duplicate or alter information in any way.
10Receipt
or
Volume (MMscf)
Receipt or Receipt / Delivery / Net Supply Overview
Lateral 04-01-2016 to 04-01-2017 to
% Chg
03-31-2017 03-31-2018
McMullen 61 / (17) / 44 61 / (33) / 28 (36%)
CTGS 204 / (96) / 108 164 / (29) / 135 25% Leidy
SWLA 105 / (80) / 25 82 / (852) / (770) (3180%) Lambertville
CENLA 102 / (5) / 97 121 / (9) / 112 15% Rivervale
Lower Chanceford
Zone 3 M/L Total 751 1,503 100%
Pleasant Valley
SELA 185 / (92) / 93 138 / (52) / 86 (8%)
Zone 6
Sta85 Receipts 2,110 2,399 14% Nokesville
Mobile Bay 559 / (1,333) / (774) 517 / (1,198) / (681) (12%)
Boswells Tavern
Black Warrior 25 31 23%
Cascade Creek 109 125 15%
Boswells Tavern 176 95 (46%) Cascade Creek
Nokesville 68 66 (4%)
Zone 5
Pleasant Valley/Cove 75 66 (12%)
Point
Lower Chanceford 828 846 2%
Sta85 Receipts
Lambertville 67 72 7% Peak Day Information
Rivervale 213 209 (2%) Peak Day deliveries to Cheniere affect SWLA and
Zone 4 Mainline interconnects in Zone 3.
Leidy 2,976 / (972) / 2,004 3,107 / (983) / 2,124 6%
Black Warrior Station 85 receipts at 3.3 BCF.
Zone 3 Mobile Bay flow southward peaks as Florida sees
Zone 2
peak conditions.
Mobile Bay
Large increases in numerous mid Atlantic receipts as
Zone 1 gas demand rises in Zone 5.
McMullen
SWLA Large decrease in deliveries to Elba.
SELA
Cove Point Pipeline sends over 500 MMCF to
CENLA
CTGS Transco.
Leidy receipts at over 4.0 BCFMarket Transitions Drive More Volume Southward
Sta090
Northbound Flow
Sta130
Sta065
Sta165
Sta030
Southbound Flow
Sta195
Sta045
12Transco Deliveries to End Users by State
2,000,000
1,800,000
1,600,000
1,400,000
1,200,000
Dth
1,000,000 2013
2014
800,000 2015
2016
600,000 2017
400,000
200,000
0
13Growth Volumes Well Balanced Among Customers
LDC / Industrial LNG Exports
19% 23%
Distribution of total
volume growth (7.2
Bcf/d) for 2017 to 2020
32% 26%
Producer Power Generation
14Leidy Line & Wharton Storage Update &
System Maintenance
Leidy Line
> Transco has completed the requirements of the Corrective Action Order (CAO).
> In addition to CAO compliance activities, integrity testing was also performed on other pipelines on the Leidy system.
This includes over 325 miles of pipeline.
> The tests included the use of various pigging technologies, hydrotests, etc.
> All of Transco Leidy Lines are back to normal operations.
Wharton Storage
> Transco is currently undertaking a comprehensive assessment of Station 535, the storage field and the related injection
and withdrawal lines to and from storage.
> The target is to have the assessments and all necessary repairs complete on both the storage field and the compressor
station in time to provide service for the 2018-2019 withdrawal season.
> The objective of the assessment is to ensure that that all of the Wharton Storage Facilities continue to operate in a safe
and reliable manner once the repairs are complete and placed back in service.
> Transco intends to continue to implement measures designed to mitigate potential impacts of this event on its ability to
provide Rate Schedule GSS service.
> We will keep you appraised of any additional developments, including any limitations on the availability of storage
services provided under Rate Schedule GSS.
System Maintenance
> Williams takes steps for prevention measures through a continual Operations and Maintenance Program.
> Schedule found at www.1Line.Williams.com.
15Modernization Program
> Modernization Program – Evaluation
– A strategic and defined program to upgrade and/or replace HP/Compression and
pipeline facilities that
• Require replacement based on risk profile
• Require upgrades to meet new / emerging PHMSA and EPA rules
• Provides reliability improvements to meet current and future flow conditions
– Focuses on capital optimization that evaluates systems with a life-cycle viewpoint
– An evaluation of the various cost recovery methods acceptable to FERC policy (PL15-
01-000)
– Transco will continue to keep Customers updated on the progress of the modernization
program
16Priority of Service Summary
> No-notice priorities of service offered by Transco: Traditional, Non-Traditional, Secondary
and IT to continue providing additional flexible service
– Flexible services will continue to be available when operationally feasible
– Only Traditional and IT no-notice are provided by current tariff in Section 5.1 (b) of Rate Schedule FT, FTG, FDLS
and IT
> No-notice is related to the primary contract path
– Supported in current tariff in Section 4.7 of Rate Schedule FT, FTG, and FDLS
> Removal of Path for HBLV no-notice requests without a supply of gas
– No-notice is received and delivered at the point of delivery and is supported by Section 5.1 (b) of Rate Schedule FT,
FTG, and FDLS
> Imbalances held in zone of receipt; HBLV no-notice receipt is at the SSDP
– No changes to Imbalance Resolution GT&C Section 25 or Cash Out GT&C Section 37
> No additional capacity needed to use Station 95 Pool; No transportation fee or fuel
between Station 85 and Station 95 transactions
– Segmentation allows shipper to relocate low burn requests from OIA 1 to OIA 2
– Proposed tariff changes to GT&C Sections 28, 37, 51 and 52 to accommodate additional Station 95 pool in Zone 4
> Transportation and fuel charges assessed as provided in current tariff
– No additional charges are proposed for transactions on system
17Regulatory Update
> On March 16, 2018, Transco filed to change the pooling rules in its tariff effective October 1, 2018 to
begin charging commodity and fuel rates on transactions leaving the zones 5 & 6 pools rather than
applying those charges to transactions going into those pools. The proposed change will make
Transco’s pooling rules consistent at all of its market area pools.
> On March 27, 2018, Transco filed an application with the Commission to abandon approximately 1.4
bcf of Eminence capacity effective April 1, 2018, due to the company’s decision to operate the
caverns at a lowered pressure.
> On March 15,2018, the Commission issued a revised Policy Statement in Docket No. PL17-1-000,
which revises its policy regarding the recovery of income tax costs in rates of jurisdictional natural
gas pipelines. Because the Commission found that an impermissible double recovery results from
granting a Master Limited Partnership (MLP) pipeline both an income tax allowance and a return on
equity pursuant to the discounted cash flow methodology, the Commission revised its policy and will
no longer permit an MLP to recover an income tax allowance in its cost of service. The Commission
further found that, while all partnerships seeking to recover an income tax allowance will need to
address the double-recovery concern, the Commission will address the application of its revised
Policy Statement to non-MLP partnership forms as those issues arise in subsequent proceedings.
> The Commission also issued a contemporaneous Notice of Proposed Rulemaking in Docket No.
RM18-11-000, that proposes a process that will allow it to determine which jurisdictional natural gas
pipelines may be collecting unjust and unreasonable rates in light of the recent reduction in the
corporate income tax rate in the Tax Cuts and Jobs Act and the FERC’s revised Policy Statement.
Transco is evaluating the impact of these issuances on its business.
18Rate Case Update
> As agreed in Article VI of the Stipulation and Agreement in Docket No. RP12-993, et al.,
Transco will file a NGA Section 4(e) general rate case no later than August 31, 2018.
> Assuming that the filing date is August 31, 2018, the base period for the rate case will be
June 1, 2017 – May 31, 2018 and the test period will be June 1, 2018 – February 28,
2019.
> Assuming a full five month suspension period for the new rates, the effective date of the
rates will be March 1, 2019.
19Unsubscribed Capacity
FT Capacity
313,850 FT; Non-seasonal; Mobile Bay MP261 to Pooling Station 85 Z4A
37,346 FT; Non-seasonal; Southeast Louisiana Lateral Station 62-65
3,763 FT (ACQ) Available 8/1/2018; Seasonal (March 1- November 30) Telescoped
Capacity
Washington Storage
124,200 dt Storage Capacity; Withdrawal 1,307 dt/d; Injection 690 dt/d.
available 5/1/2018.
262,678 dt Storage Capacity; Withdrawal 2,765 dt/d; Injection 1,459 dt/d.
available 8/23/2018, pending the outcome of an open season.
Eminence EESWS
62,201 dt; Withdrawal 7,446 dt/d; Injection: 621 dt/d.
Eminence ESS Rate Schedule
2,018,705 dt; Withdrawal: 239,949 dt/d; Injection: 20,042 dt/d.
54,996 dt; Withdrawal 6,518 dt/d; Injection 544 dt/d. available 11/1/2018, pending the
outcome of an open season.
47,484 dt; Withdrawal 5,684 dt/d; Injection 474 dt/d. available 3/1/2019, pending the
outcome of an open season.
20Atlantic Sunrise (ASR) Project – 1Line Changes
> New “ROUTE” data element will be added to 1Line with the ASR Project in-service date
– The Atlantic Sunrise (ASR) project will include the new Central Penn Line South (CPLS), giving
shippers an alternate route option for some Zone 6 transactions.
• A NAESB nomination element, ROUTE, will be required for affected Zone 6 transactions and will be effective with the
ASR Project in-service date.
• Valid Route options will be displayed in 1Line for affected nominations and secondary capacity release transactions.
• EDI and Flat File formats will include the new ROUTE option. To ensure EDI files work correctly, customers must
participate in testing.
• Presentations with more details on the new ROUTE element, including EDI and Flat File testing information:
– http://www.1line.williams.com/Transco/files/EDIASRCommunication.pdf
– http://www.1line.williams.com/Transco/files/presentations/NewNominationDataFieldWebinar.pdf
> River Road Transfer Point
– The junction of the new Central Penn Line South (CPLS) and Transco’s mainline, north of Station 195
will be a Transfer Point
• Delivery and Receipt volumes at the Transfer Point must match for each transaction.
• “Lesser of” rule will apply for out of balance transactions across Transfer Point
• Transport charges will apply on both deliveries to and receipts from Transfer Point
21Atlantic Sunrise (ASR) Project – 1Line Changes
> Nominations and non-ASR secondary Leidy -
capacity releases with paths that cross or Dominion
are within any of the red brackets require
Sta. 517
Route selection.
> 3 Route Options
– Non-CPLS: transaction moves on the
North-CPLS
Mainline or Leidy Line only
– South-CPLS: transaction moves DOWN
CPL-South (CPLS)
the CPLS to the Mainline
– North-CPLS: transaction moves UP the 210 Pool
South-CPLS
CPLS to the Leidy Line
> Valid Route options will be displayed in
1Line.
> No Route option for:
– Transactions with paths that do not cross
into the bracketed triangle Sta. 195
River Road
– Primary capacity releases Zone 6 Transfer
– Secondary capacity releases of ASR
contracts Zone 5 BG&E
22Major Expansion Projects
Gateway Project Mdt/d
Pre-construction Atlantic Sunrise Q1 2021
Rivervale Atlantic Sunrise 1,700
Under construction Mid 2018
Q4 2019
In Service Garden State 180
Garden State
Q3 2017 / Q1 2018 Gulf Connector 475
St. James Supply 162
Southeastern Trail Northeast Supply
Q4 2020 Q4 2019 / Q1 2020 NESE 400
Hillabee – Phase II 207
Hillabee Phase 2 Rivervale South to Market 190
Q2 2020 Southeastern Trail 296
Gulf Connector Gateway 65
Q1 2019
Total Expansion Capacity 3.26
Current Transco Capacity* 14.98
Total Post-Expansions 18.24
St. James Supply
Q2 2019 * Includes 20 MDth/d for Garden State and
400 MDth/d for Atlantic Sunrise placed in service in 2017
23Northern Market: Continuing Strong Growth
Rivervale South to
Market New York Bay
• 195 Mdt/d • 115 Mdt/d
• Q4 2019 • October 6, 2017
Leidy Hub
Gateway New York City
• 65 MDth/d
• Q1 - 2021
Atlantic Sunrise
• 1,700 Mdt/d
• Mid 2018 210 Northeast Supply
Enhancement
• 400 Mdt/d
• Q4 2019 / Q1 2020
195
Garden State
• 180 Mdt/d
• March 23, 2018
VA
Note: In-service dates and capacities for projects not yet in service represent expected in-service dates and capacities
24Power Generation Fuels Southern Market Expansions
Virginia Southside II
• 250 Mdt/d
• December 1, 2017
165
Dalton Expansion
160
• 448 Mdt/d
• August 1, 2017
Hillabee Expansion Ph I
• 818 Mdt/d
• July 11, 2017 Southeastern Trail
• 296 Mdt/d
• Late 2020
Hillabee Expansion Ph II
85 • 207 Mdt/d
• Q2 - 2020
Note: In-service dates and capacities for projects not yet in service represent expected in-service dates and capacities
25Gulf Coast Area Expansions Serving LNG and
Industrial Customers
65
Gulf Connector
• 475 Mdt/d
• 1st half 2019 50
45 St. James Supply
• 161 Mdt/d
• Q2 2019
30
Gulf Trace
• 1,200 Mdt/d
• February 1, 2017
Note: In-service dates and capacities for projects not yet in service represent expected in-service dates and capacities
26LNG Opportunities
Gas Flows to Sabine Pass in Bcf/d
> Contracted with four of six
3.5
LNG facilities currently 3.0
Daily
in-service or under 2.5
construction (~2 Bcf/d) 2.0
1.5 LNG
– Market access to the other two 1.0
0.5
export facilities -
> Contracted with Sabine
Pass Liquefaction; took
delivery of nearly 90 Bcf
in Nov. 2017 LNG
> Seven additional projects
in development to
LNG
support LNG exports LNG
LNG
LNG
Sabine Pass, Contracted
Other Contracted
Market Access
27Eastern Interstates – Projects in Execution
We are currently executing a total of 10 different expansion opportunities
Constitution
Q3 2019
Station 240 Modernization
Q4 2019
New York Bay Expansion
Rivervale South to Market Q4 2017
Q4 2019
NE Supply Enhancement
Gateway Q4 2019 / Q1 2020
Q1 2021
Atlantic Sunrise Garden State Phase I
Mid 2018 Q3 2017
Garden State Phase II
Southeastern Trail Q1 2018
Q4 2020
Virginia Southside II
Q4 2017
Gulf Trace Dalton Expansion
Q1 2017 Q3 2017
Gulf Connector
Q1 2019
Projects shaded in yellow are Hillabee Phase 1
starting or under construction. Q3 2017
Projects shaded in green are in
service. Stars represent power St. James Supply Hillabee Phase 2
generation Q2 2019 Q2 2020
Shipper FERC Certificate FERC FERC Major
Construction In-service
Commitments Application Filed EIS / EA Certificate
Activities
REGULATORY MILESTONES FOR FULLY CONTRACTED REGULATED EXPANSIONS
NE Supply Enhancement Rivervale South to Atlantic Sunrise Gulf Trace - ISD 2/17
Constitution
Filed 3/17 Market Received 12/14 Began 3/17 Hillabee Ph 1 - ISD 7/17
Rivervale South to Market Received 3/18 Hillabee Ph 2 Gulf Connector Dalton - ISD 8//17
Filed 9/17 Received 2/16 Began 2/18 Garden St Ph 1 - ISD 9/17
Gateway St. James Garden St Ph 2 – ISD 3/18
Filed 11/17 Began 4/17 New York Bay - ISD 10/17
Southeastern Trail VSS II - ISD 12/17
Filed 4/18 28Garden State
Project Status:
• Phase I in service on Sept 9, 2017 (20 MDth/d);
• Phase II placed in-service on March 23, 2018 (160 MDthd).
505
Zone 6
207
PA
210 Pool
205
Trenton
> Expansion from Station 210 in Mercer County, NJ
to a new delivery point with New Jersey Natural NJ
203
on Transco’s Trenton Woodbury Lateral in
Burlington County, New Jersey New Meter and
Compressor
> Service will be provided under Transco’s FT Station
Service.
> Capacity: 180 MDth/d
> Phase I – 20 MDth/d and
> Phase II – 160 MDth/d
> Shipper: New Jersey Natural Gas Company
29Atlantic Sunrise
Project Status:
• All regulatory authorizations/ permits received with
construction underway on all project facilities;
• Target in-service date: Mid 2018.
> Expansion of Transco’s Leidy Line to Mid-
Atlantic and Southeast Markets
New York City
> Provides access to markets in Zones 6, 5 and 4 Zone 6
> Service will be provided under Transco’s FT 195
To River Road:
Service 500 Mdt/d
> Capacity: 1,700 Mdt/d
To Pleasant Valley:
> Shipper: Numerous 350 Mdt/d
Shipper Dth/d
Anadarko 44,048
Zone 5 SWN 44,048
Inflection 26,429
Zone 4 Chief 420,000
Cabot 850,000
Seneca 189,405
85
WGL Mid. 44,048
MMGS 22,024
Southern Co. 60,000
Total 1,700,002
30Gulf Connector
Project Status:
• Construction commenced in February 2018;
> Expansion of Transco's mainline from • Target In-Service Date: Q1 2019.
Station 65 to LNG delivery points in Zone 2 MS 85
and Zone 1 LA Zone 4
> Will be provided under Transco’s FT Service
Zone 3
> Capacity: 475 Mdt/d 65
Zone 2 45
TX
Zone 1
30
Freeport LNG – 75 Mdt/d
CCLNG - 400 Mdt/d
31St. James Supply
Project Status:
• Received FERC Certificate on January 18, 2018;
> Incremental transportation from Transco’s • Construction commenced in April 2018;
Station 65 to a new interconnect with the • Target In-Service Date: Q2 2019. 85
proposed YCI M1 facility
> Will be provided under Transco’s FT Service
> Capacity: 161.5 Mdt/d
> Shipper: YCI St. James Enterprises LLC Zone
4
65
Zone
SELA
45 82
3
YCI St. James
Enterprises
62
32Station 240 Modernization
Project Status:
• Transco filed a 30-day advance notice with FERC on
March 1, 2018
• Target In-Service Date: Q4 2019
Project Facts:
• Replace liquefaction plant at Station 240 in Carlstadt,
New Jersey to resolve safety and emissions issues,
liquefaction degradation, operational/reliability
issues.
• Facilities:
Gas Pretreatment
10 MDth/d Liquefaction
Compression
Control System and Transformers
Background:
• Station 240 is a peak-shaving LNG plant constructed in
1964.
• Consists of liquefaction, vaporization, and storage.
• The vaporization was replaced/upgraded in 1991.
• Total Storage is approximately 2,000 MDT
• Contractual Vaporization of 400 MDthd; Contractual
Liquefaction of 10 MDth/d.
33Rivervale South to Market
Project Status:
• FERC Application filed on August 31, 2017;
• Received EA on March 16, 2018;
> Expansion from the Rivervale interconnect with • Target In-Service Date: Q4 2019.
Tennessee Gas Pipeline in Bergen County, NJ to
the existing Central Manhattan M&R and Station
210 Pool.
> Will be provided under Transco’s FT Service
Rivervale
> Capacity: 190 Mdt/d
> Shipper(s): Direct Energy (187.5 Mdt/d), UGI
Energy Services (2.5 Mdt/d)
Zone 6 New York City
210 Pool
34Northeast Supply Enhancement
Project Status:
• FERC Application filed on March 27, 2017;
• Draft Environmental Impact Statement received on
March 23, 2018;
• Target In-Service Date Q4 2019 / Q1 2020.
303
> Expansion from Station 195 in York County, PA to
the Rockaway Lateral in New York Bay. Narrows
> Will be provided under Transco’s FT Service.
> Capacity: 400 Mdt/d
Rockaway
> Shipper: National Grid 207 Delivery Point
205 210 Pool
200
Atlantic Sunrise
Project
Proposed River
Transfer Point
195
35Hillabee Phase 2
Project Status:
• FERC Order on Feb 2, 2016 and all other permits
Zone have been received;
4 • Limited work completed to-date;
• Target In-Service Date: Q2 2020.
> Point-to-point lease with Sabal Trail from Station 85
to a new interconnect in Hillabee, AL
> Leased capacity will be used by Sabal Trail to
provide access to Station 85 for its greenfield
pipeline, which will extend to central Florida to
serve Florida markets
> Capacity: 207 Mdt/d
> Shipper: Sabal Trail Transmission
36Gateway
> Expansion from the proposed PennEast
Pipeline Company interconnect in Mercer
County, NJ to the existing Paterson M&R
and Ridgefield M&R.
> Will be provided under Transco’s FT Service
> Capacity: 65 Mdt/d
> Shipper(s): PSEG Power (54 Mdt/d), UGI
Energy Services (11 MDt/d)
210 Pool
Project Status:
• FERC Application filed on Nov 15, 2017;
• Target In-Service Date: Q1 2021.
37Southeastern Trail
> Firm transportation from the existing Zone 5
Pleasant Valley Interconnect with Dominion’s Cove
Point Pipeline south to our existing Zone 3 Pool at Zone 6
Station 65.
> Will be provided under Transco’s FT Service
> Capacity: 296.375 MDt/d
> Shipper(s): PSNC, SCE&G, City of Buford (Ga), City of
LaGrange (Ga), Virginia Natural Gas.
Zone 5
Zone 4
Project Status:
• FERC Application filed on April 10, 2018;
• Target In-Service Date: Q4 2020.
38WE MAKE ENERGY HAPPEN
Projects in Development
39Adelphia Connection Expansion
In Development
Martins Creek Terminal
From MARC1
on Leidy Lower Mud Run
Project Facts:
• Path from MARC 1 and a proposed
interconnection with Adelphia Gateway Pipeline
to markets on Transco's Marcus Hook / Trenton
Woodbury Lateral.
• Facilities: Potential pipeline replacement,
compression addition and meter station 207
additions/ uprates.
• Capacity: 250 MDth/d 210 Pool
205
• Proposed ISD: November 1, 2021
Pennsylvania
203
200
Trenton New Jersey
Woodbury
Lateral
Contract Path
Proposed Interconnect
with Adelphia Gateway
Pipeline
40South Louisiana Market
In Development
Contract Path
Project Facts: Zone
• Path from Transco’s Station 65 to a new interconnect with 3
the methanol facility in St. James Parish, LA.
• Facilities: 0.6 miles of 20-inch Greenfield lateral
• Capacity: 202 Mdt/d
• Proposed ISD: 2021
45
41Bluebonnet Market Express
In Development
Waha Supply Header
Contract Path
Katy Delivery Header
Station 30
Station 35
Station 17
Project Facts: Agua Dulce
• Greenfield pipeline from the Waha Supply Hub in the
Permian basin to the Katy Hub landing area on Transco.
• Facilities: 476 miles of Greenfield pipeline, 5 Greenfield
compressor stations totaling 224,000 hp and 12 receipt
and delivery meter stations.
• Capacity: 2,000 Mdt/d
• Proposed ISD: Late 2020
42You can also read