Wind Atlas for South Africa (WASA) - Atlas of extreme wind and gust for South Africa
←
→
Page content transcription
If your browser does not render page correctly, please read the page content below
Wind Atlas for South Africa (WASA)

 Atlas of extreme wind and gust for South
 Africa

 Final Report for WASA Phase III
 Xiaoli Guo Larsén1, Andries Kruger2, Rogier Floors1, Dalibor Cavar1 and
 Andrea Hahmann1

 1
 Technical University of Denmark (DTU)
 2
 Weather Service of South Africa

 DTU Wind Energy E-0220
 ISBN: 978-87-93549-88-3

 March 2021

 1
Contents

1. Introduction ..................................................................................................................................... 3
2. Methods........................................................................................................................................... 4
 2.1. WRF-modeling and the estimation of the extreme wind ........................................................ 4
 2.2. The GASP method .................................................................................................................. 5
 2.3. Observations ........................................................................................................................... 5
 2.4. Calculation of the extreme gust values ................................................................................... 8
3. Results ............................................................................................................................................. 9
 3.1. The 50-year gust ..................................................................................................................... 9
 3.2. The 10-min 50-year wind...................................................................................................... 11
 3.2.1. WRF-WASAIII ............................................................................................................. 12
 3.2.2. GASP ............................................................................................................................ 14
4. Comparison of measurements and model data.............................................................................. 15
 4.1. Comparison between WRF-WASAIII, WRF-WASAI and observation ............................... 15
 4.2. Comparison between GASP results and measurements........................................................ 16
 4.3. The 50-year 3-s gust values .................................................................................................. 17
5. Discussion and conclusion ............................................................................................................ 17
6. References ..................................................................................................................................... 18

 2
1. Introduction

This report outlines the final results for the Wind Atlas of South Africa project for the extreme wind
and gust statistics for planning of wind farms (Work Package 5).

In addition to an extreme wind atlas based on meteorological measurments, the following relevant
products were produced in terms of modelling in WASA Phases I and II:

 1) The 50-year wind at 10 m, 50 m and 100 m from WRF modeling at a spatial resolution of 4
 km for two areas in South Africa.
 2) The 50-year wind at 10 m from the spectral correction method in connection with the use of
 the reanalysis data CFSR I, at a special resolution of 40 km.
 3) Generalized 50-year wind from 1) over the two areas that can be further applied to
 microscale, linear computational model LINCOM, to obtain local extreme wind at a
 resolution of tens of meters.
 4) Generalized 50-year wind from 2) over South Africa that can be further applied to the
 microscale, linear computational model LINCOM, to obtain local extreme wind statistics at a
 resolution of tens of meters.
In WASA Phase III, benefiting from the long term, high spatial resolution (3.3 km) mesoscale
modeled data over the entire country, we obtained

 5) The 10-min values of 50-year wind at 10 m, 50 m, 100 m and 200 m. The 10 m winds were
 not one of the direct outputs from the mesoscale modeling but serve as output for this project.
 The output of the 10m wind speed was used to estimate the 1:50 year wind statistics and these
 were critically compared to the outputs from historical observations, also at 10 m height.
 6) Generalized 50-year wind from 5) that can be further applied to microscale, linear
 computational model LINCOM, to obtain local extreme wind statistics at a resolution of tens
 of meters.
WASA III benefitted from the ongoing GASP project, where the method outlined in 4) is applied to
the whole globe and downscaled using LINCOM to a spatial resolution of 250 m. Thus we estimated

 7) The 10-min values of 50-year wind at 50 m, 150 m and 200 m at a spatial resolution of 250 m
 over South Africa.
The results from the two mentioned WASAIII datasets were compared to earlier WASA datasets as
well as measurements.

In addition to the above, final calculation was done of

 8) The 3-s values of the 50-year gust at 10 m at a spatial resolution of 3.3 km.
The methods for 5) – 8) are briefly summarized in section 2. The results are presented in section 3,
followed by discussion and conclusion.

 3
2. Methods

The methods introduced here are for the calculations in WASA III.

2.1. WRF-modeling and the estimation of the extreme wind

The details of the WRF setup and modeling can be found in Hahmann et al. (2020). Briefly, the model
was forced by ERA5 data and it ran for the period from 1990 to 2019. The spatial resolution for the
innermost model domain is 3.3 km, covering entire South Africa. The outputs are saved every 30
minutes.

The annual wind maxima at each mesoscale grid point are identified. For the 30 samples of the annual
maximum values, we apply the Gumbel distribution and obtain the 50-year value. The winds at 50 m,
100 m and 200 m are obtained through interpolation of values at the relevant model levels. The wind
at 10 m is not an output, here we use the values from other heights and a logarithmic fit to obtain it,
see Fig. 1. As metioned earlier, these values are for comparison with the many historical
measurements that were made at this height. Fig 1 shows that (1) it is not a good method to use data
from all the three levels in connection with a 2nd order polynomial regression. (2) When using a linear
fit, there are some differences between using data from three levels and data from the first two levels.

 Fig. 1. Obtaining wind speed at 10 m using data from other heights.

Primarily we use the values at 10 m derived from 50 m and 100 m. The values are compared with
those derived using all three heights (50 m, 100 m and 150 m).

Products 5) and 6) listed in Section 1 were produced using this method.

Product 6) was obtained from the so-called “generalization”, which cleans the speed-up effects caused
by mesoscale topography and roughness length change, and convert the winds to a homogeneous
surface with a roughness length of 5 cm (see Larsén and Kruger (2016) for the details). The
“cleaning” is done sectorwise. For each WRF grid point, the wind time series is grouped into 36
sectors. Each sector has its own speedup effect depending on the upwind orography and roughness
length change. Here we used the data prepared in WP3. Afterwards, after assuming the same

 4
geostrophic wind, the winds are converted from the WRF roughness length (used in the modelling) to
a standard 5 cm.

2.2. The GASP method

The details of the method can be found in the report Larsén et al. (2020). Briefly, the global reanalysis
data are used in connection with the spectral correction method, as done in Larsén and Kruger (2015),
and in addition, the calculation is continued using the microscale flow model LINCOM for
downscaling to a spatial resolution of 250 m.

2.3. Observations

The 50-year winds at 111 stations have been prepared by the South African Weather Service. Table 1
shows the station names, coordination, and 1:50 year gust estimations at 10 m. In the estimation
process the roughness length was considered (observations have to be done in fairly open terrain),
topography and statistical estimation method. More information on the approach can be found in
Kruger (2011).

 Table 1. Observational estimates of the 1:50 year gusts for 111 South African Weather Service
 stations with at least 10 years of data. The stations are arranged according to latitude.

 Number Name lat lon 1:50 yr gust
 3108 STRUISBAAI -34.8008 20.0589 41
 6386 HERMANUS -34.4325 19.2247 44
 10682 STILBAAI -34.3708 21.3964 30
 7699 TYGERHOEK -34.1497 19.9031 37
 5609 STRAND -34.1411 18.8489 44
 14545 PLETTENBERGBAAI -34.0939 23.3289 31
 14123 KNYSNA -34.0594 23.0914 34
 15692 TSITSIKAMMA -34.0269 23.9086 28
 12661 GEORGE WO -34.0167 22.3832 33
 35209 PORT ELIZABETH -33.9844 25.6108 40
 21178 CAPE TOWN WO -33.97 18.6 38
 20618 ROBBENEILAND -33.7989 18.3744 29
 33556 PATENSIE -33.7653 24.8233 33
 21823 PAARL -33.7217 18.9719 31
 34763 UITENHAGE -33.7142 25.435 39
 22729 WORCESTER -33.6639 19.4186 42
 41388 MALMESBURY -33.4725 18.7183 33
 56917 GRAHAMSTOWN -33.2906 26.5028 32
 40192 GEELBEK -33.1961 18.1242 29
 59572 EAST LONDON WO -33.03 27.83 36
 41841 PORTERVILLE -33.0125 18.9769 39
 0061298-8 LANGEBAANWEG-AWS -32.97 18.16 29
 0063807-2 EXCELSIOR-CERES -32.96 19.43 30
 0060620-9 CAPE-COLUMBINE -32.83 17.86 34

 5
78227 FORT BEAUFORT -32.7881 26.6294 38
0088293A6 SUTHERLAND -32.4 20.66 34
92081 BEAUFORT-WES -32.3572 22.5775 39
96072 GRAAFF - REINET -32.1933 24.5431 31
0084671-0 CLANWILLIAM -32.18 18.89 29
0098190B6 CRADOCK-MUN -32.17 25.63 34
83572 LAMBERTSBAAI -32.03 18.3298 28
0113025A2 FRASERBURG -31.92 21.51 35
123685 QUEENSTOWN -31.92 26.88 44
0106880A2 VREDENDAL -31.67 18.5 27
127272 UMTATA WO -31.53 28.67 41
0134479A3 CALVINIA-WO -31.48 19.76 32
150620 ELLIOT -31.3381 27.845 44
0144791_2 NOUPOORT -31.19 24.96 33
0148517A9 JAMESTOWN -31.12 26.81 32
0155394A5 PORT_EDWARD -31.07 30.23 35
0182591A4 MARGATE -30.85 30.33 32
0182465_7 PADDOCK -30.75 30.26 32
0169880-1 DE-AAR-WO -30.67 23.99 42
0173032-4 GARIEP-DAM -30.56 25.53 36
0190868-1 BRANDVLEI -30.46 20.48 33
0184491-4 KOINGNAAS -30.2 17.29 28
0210099A7 IXOPO -30.15 30.07 27
0240808A2 DURBAN_SOUTH_AWS -29.97 30.95 33
0232654_4 WEPENER -29.92 26.85 33
241076 VIRGINIA -29.767 31.05 31
0291570-1 FAURESMITH -29.75 25.32 32
0241072_9 MOUNT_EDGECOMBE -29.7 31.05 24
0214700B2 SPRINGBOK-WO -29.67 17.88 35
0224400-8 PRIESKA -29.67 22.74 35
0239699_7 ORIBI_AIRPORT -29.65 30.4 34
0239698_5 PIETERMARITZBURG -29.63 30.4 29
0268016AX GIANTS_CASTLE_AWS -29.27 29.52 42
0268883_6 MOOI_RIVER -29.22 30 36
0247668A4 POFADDER -29.12 19.39 29
261516 BLOEMFONTEIN WO -29.1 26.3 36
0270155_9 GREYTOWN -29.08 30.6 34
0304357_6 MTUNZINI -28.95 31.7 32
0296709AX FICKSBURG -28.83 27.9 35
0290468A9 KIMBERLEY-WO -28.81 24.77 37
0276196-8 VIOOLSDRIF-AWS -28.77 17.62 29
0305134_6 RICHARDS_BAY_AIRPORT -28.73 32.08 29
0281606A5 AUGRABIES-FALLS -28.6 20.34 32
274034 ALEXANDERBAAI -28.5728 16.5364 32

 6
0300454_3 LADYSMITH -28.57 29.77 36
0317475A8 UPINGTON-WO -28.41 21.26 36
0333682A9 VAN_REENEN -28.38 29.39 36
0321110_7 POSTMASBURG -28.35 23.08 33
0337738_2 ULUNDI -28.3 31.42 31
0331585_9 BETHLEHEM_WO -28.25 28.33 33
339732 CHARTERS CREEK -28.2 32.417 28
364300 WELKOM -27.9947 26.6658 40
0372527_1 VRYHEID -27.78 30.8 28
0370856_3 NEWCASTLE -27.77 29.98 36
356880 KATHU -27.6719 23.0106 33
0365398_8 KROONSTAD -27.67 27.31 36
0362189_7 BLOEMHOF -27.65 25.62 34
0360453A0 TAUNG -27.55 24.77 34
0412148_6 MBAZWANA_AIRFIELD -27.48 32.6 33
0393806-4 KURUMAN -27.43 23.45 27
0405326A9 VREDE -27.42 29.17 32
0410175_X PONGOLA -27.41 31.59 30
441416 STANDERTON -26.93 29.23 34
0436204-1 KLERKSDORP -26.9 26.62 31
0437104A4 POTCHEFSTROOM -26.74 27.08 32
0438784-3 VEREENIGING -26.57 27.96 33
0479870-X ERMELO-WO -26.5 29.98 33
0461208-4 TWEE-RIVIEREN -26.47 20.61 36
0476762A3 SPRINGS -26.21 28.44 21
0476399-0 JOHANNESBURG-INT-WO -26.14 28.23 32
0472278-0 LICHTENBURG -26.13 26.16 33
0513239_0 GRAND_CENTRAL -25.98 28.13 33
0513385A2 IRENE-WO -25.91 28.21 33
0515320-8 WITBANK -25.83 29.19 34
0508047-0 MAFIKENG-WO -25.8 25.54 31
0517041-2 BELFAST -25.69 30.03 31
0511399-X RUSTENBURG -25.66 27.23 30
0520691-2 KOMATIDRAAI -25.51 31.91 30
0594626B9 GRASKOP-AWS -24.94 30.84 31
0585341-8 MADIKWE-GAME-RESERVE -24.69 26.2 32
0587725CX THABAZIMBI -24.58 27.41 29
0633882-7 MOKOPANE -24.2 29.01 31
0677802BX POLOKWANE-WO -23.86 29.45 35
0679194-5 TZANEEN-WESTFALIA-ESTATE -23.74 30.11 20
0674341-8 LEPHALALE -23.68 27.71 29
0675666-2 MARKEN -23.59 28.39 29
0723664-6 THOHOYANDOU-AWS -23.08 30.38 33

 7
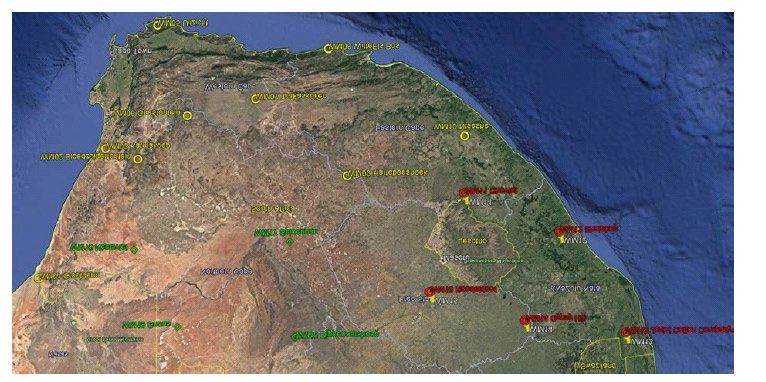
Out of 19 WASA stations (Fig. 2), at eight stations the measurements of winds at 60 m are
sufficiently long to be used for estimation of the 50-year wind.

 Fig. 2. 19 met stations from WASA project (from Mortensen et al. 2021)

2.4. Calculation of the extreme gust values

The corresponding gust values are obtained based on the 50-year wind at 10 m using a boundary-layer
turbulence model, the Kaimal model for the along-wind components:

 102 ∗2 ( / )
 ( ) = (1)
 (1+33 / )5/3

where u* is the friction velocity and it can be approximately calculated through κU/u∗ = ln(z/z0) for
neutral conditions, here κ = 0.4 is the von-Kámán constant. We use the 30-min values (as the WRF
model output) of 50-year wind as input for U in Eq. 1. The spectrum is used to calculate the zero and
second-order spectral moments following
 2
 = � ( )
 1

with i = 0 and 2, respectively. Here f1 determines the period over which the gust is calculated and f2
determines to what resolution the calculation will be done. The time scales we apply here are f1= 1/
(1800 s), and f2 the Nyquist frequency for a temporal resolution of 3 s, namely 0.1667 Hz.
The spectral moments are used to obtain the peak factor

 2 0.577
 = �2 ln � 0 � � +
 0

 �2 ln � 0 � 2 �
 0

where T0 is the period the gust is calculated over and the gust is obtained through

 50, = 50 + � 0

 8
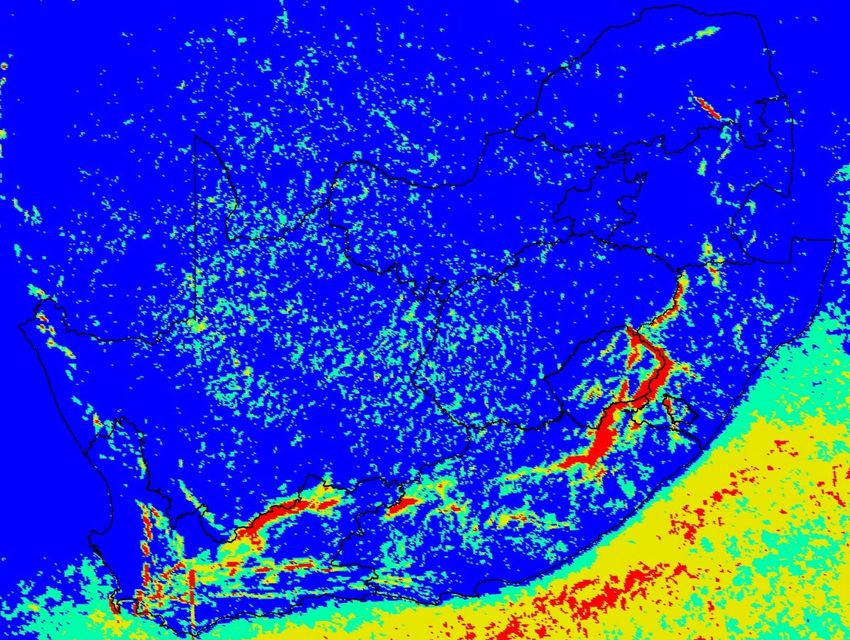
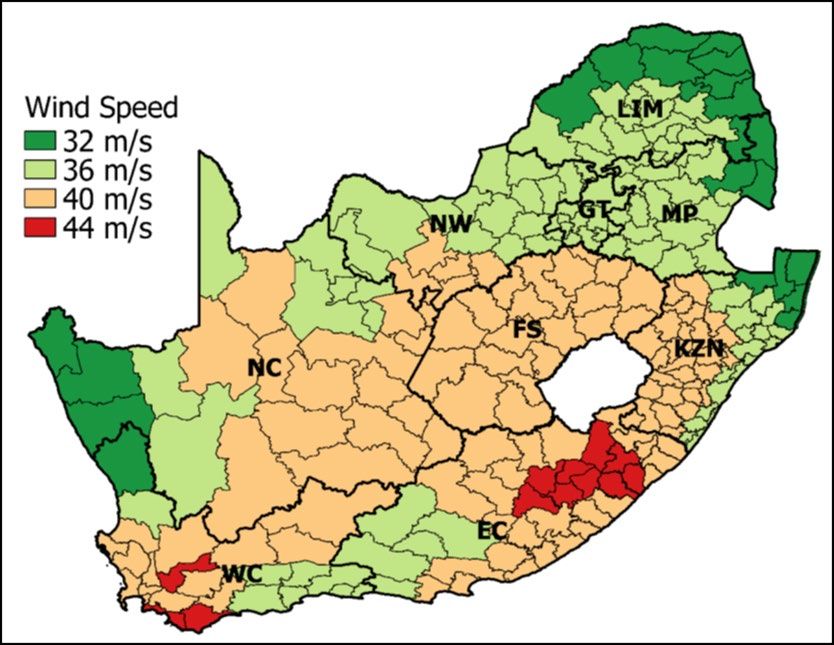
3. Results

3.1. The 50-year gust

Most regions in South Africa are affected by thunderstorms. As a consequence, using the typical
boundary-layer turbulence model underestimates the turbulence and therefore the gust values. We
tested using coefficients larger than 102 in connection with the use of Eq. 1 for these areas, which
improves the overall estimation of gust values at stations in these areas. However, differential
estimations over adjoining regions caused artificial discontinuities and therefore the original modelled
values were revisited. It was established by categorizing the estimated gusts and increasing the
estimated values to the top category value for conservativeness. For example, all 1:50 year wind gusts
estimated lower than 36 m/s were designated a value of 36 m/s, 36 to 40 m/s a value of 40 m/s, 40 to
44 m/s a value of 44 m/s and all values above 44 m/s were categorized as the top-most category.
Regions in the highest category should be treated with caution for any infrastructure development,
including wind farms. In the modelling process some point estimations in these regions were well
above 50 m/s.
The categorization of wind gust values in the intervals above made it convenient to compare the new
map to a recent map developed from only observations, for the revision of the South African loading
code. The last mentioned map, presented in Fig 4, indicates somewhat higher values over the central
interior but due to the lack of sufficient observations over higher lying areas did not fully succeed to
reflect the very high values likely over the escarpment. In addition, the spatial resolution of the
observations necessitated to provide estimates for municipal districts, with the additional motivation
that it makes reference to design wind speed values explicit.

 Fig. 3. The original 3 s value of the 50-year gust at 10 m.

 9
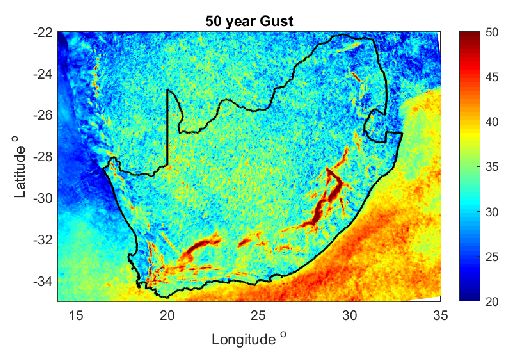
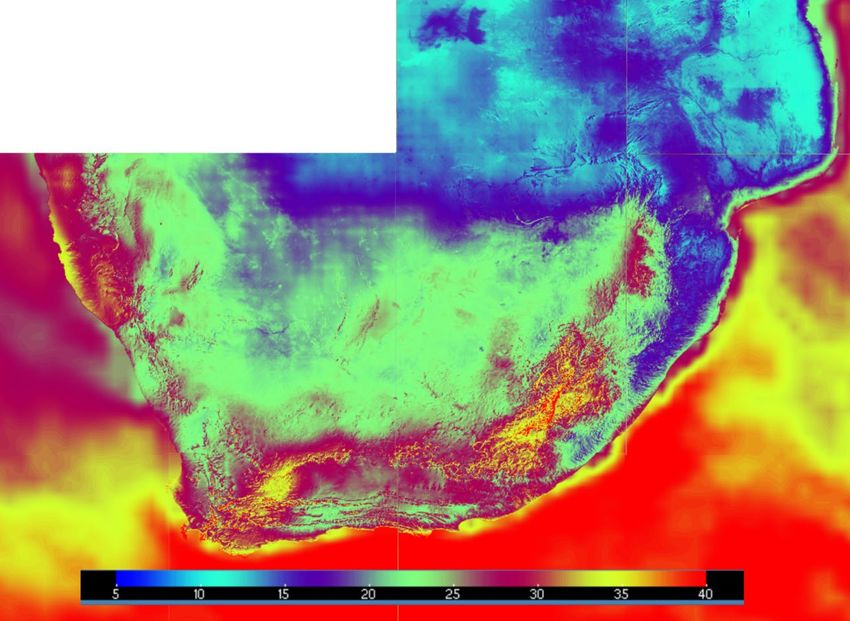
Fig. 4. Developed map of fundamental value of basic wind speed (developed for revision of SANS
wind loading code), provides the 1:50 yr gust values closest to values estimated from measured data
 (Kruger et. al, 2017).

Fig 5 presents the final WASA III map for the 50-year gust, V50. A critical comparison between Fig 4
and Fig 5 and comparison of the results from the analysis of 111 stations show that the final map
compares well to the updated design values in Figure 4, considering the following:
 • The East Coast: most stations along the KwaZulu-Natal coast estimate a 1:50 year gust in the
 region of 35 m/s, therefore 35 m/s or 36 m/s (as in the case of the SANS map) is appropriate.
 Towards the south at the Eastern Cape coast wind speeds are somewhat higher and in
 northern KwaZulu-Natal somewhat lower.
 • Top of escarpment should be higher than the 40 m/s of the SANS map, as indicated by
 measurement estimations and provision for conservativeness. Modelling shows values much
 higher than 44 m/s in isolated areas.
 • The interior, excluding the escarpment, influenced by thunderstorms and synoptic-scale
 systems to varying degrees - SANS map and results from measurements provide most reliable
 input, and is significantly higher than modelling in places. Therefore a design value of not
 lower than 36 m/s is indicated for the interior.
 • Eventually most of the country is close to a value of 36 m/s with the remainder mostly
 between 36 and 40 – therefore a common interval of 4 m/s could be used (36, 40, 44 m/s, and
 greater than 44); the latter category additional to those in the SANS map.

 10
Fig. 5. Final WASA III map for the 50-year 3-s gust V50 at 10 m, derived from modelling and verified
 by measurements.

3.2. The 10-min 50-year wind
The 10-min values of the 50-year wind at turbine hub height are one of the key design parameters for
deciding which kind of turbine to be used for a particular site (see Table 2). For instance, a turbine
class using e.g. annual average wind speed of class III and turbulence category B, together with 10-
min values of the 50-year wind of class II is designated class IIIB,II.

In sections 3.2.1 and 3.2.2, the 10-min 50-year winds are presented from the WASA III project as
well as from the GASP project.

 11
Table 2: Basic parameters for wind turbine classes 1

3.2.1. WRF-WASAIII

The WRF model outputs are 30-min instantaneous values at a spatial resolution of 3.3 km. The
eventual 50-year winds need to be corrected to 10-min values. We applied the spectral analysis to the
10-min values of measured and modeled time series from 19 stations from the WASA I-III projects
(see Fig. 2 for the locations of these WASA stations). We found that on average the spatial smoothing
effect between the model output and the targeted 10-min resolution is 6% using the method from
Larsén and Kruger (2014). Fig. 6 shows such an example of the spectral smoothing effect in the
modeled data for the relatively high frequencies, showing as the tapered-out tail in the power
spectrum in comparison with the measurements (blue). We will simply apply 6% on top of the 30-min
model outputs to obtain the corresponding 10-min values.

However, the model not only misses the high frequency fluctuations, it could also introduce
systematical bias in the calculation, such as overestimation or underestimation. Such a systematical
bias is more difficult to correct as the whole physics system is involved, including the input data,
model setup and model physics. This part is not corrected.

1
 IEC FDIS 61400-1 (2017), INTERNATIONAL ELECTROTECHNICAL COMMISSION

 12
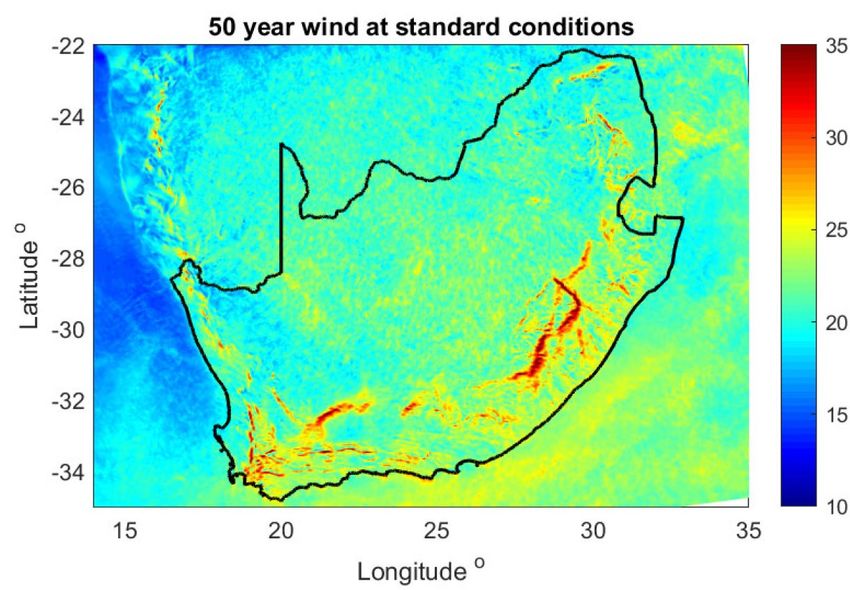
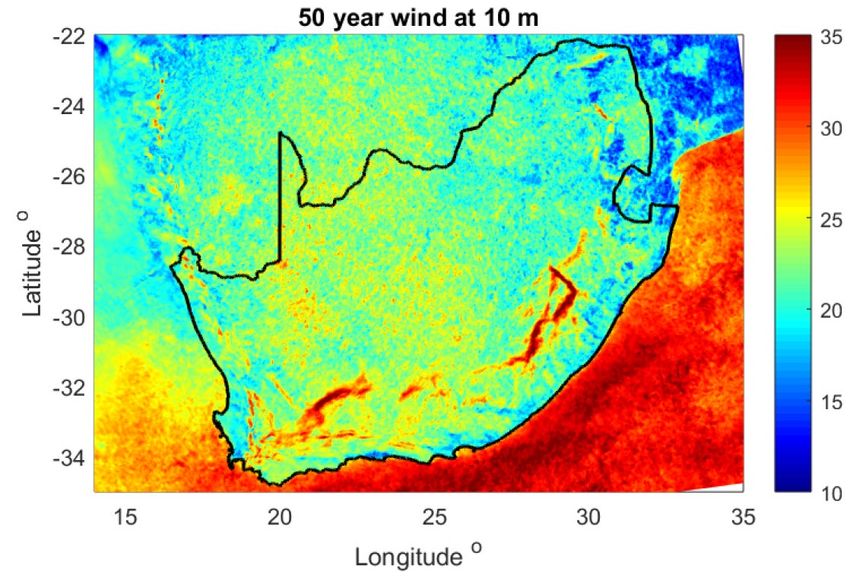
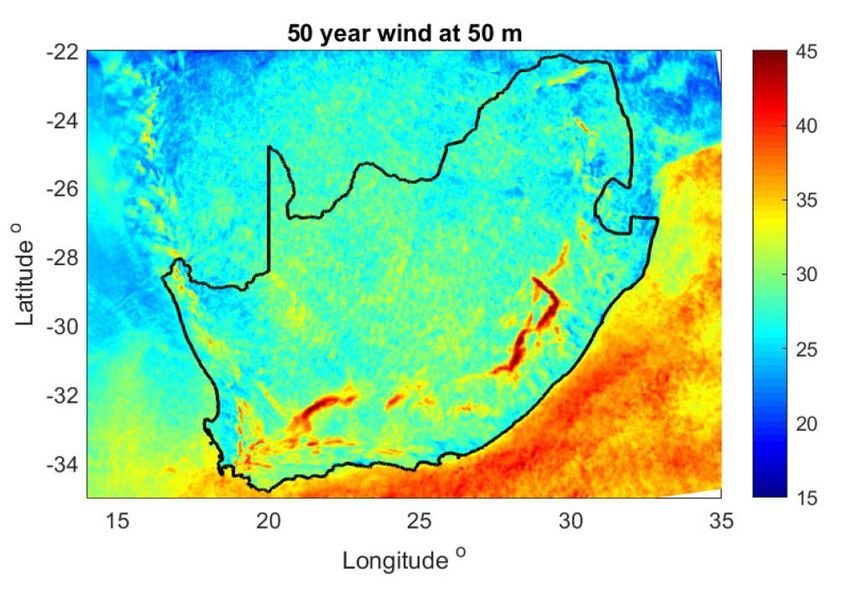
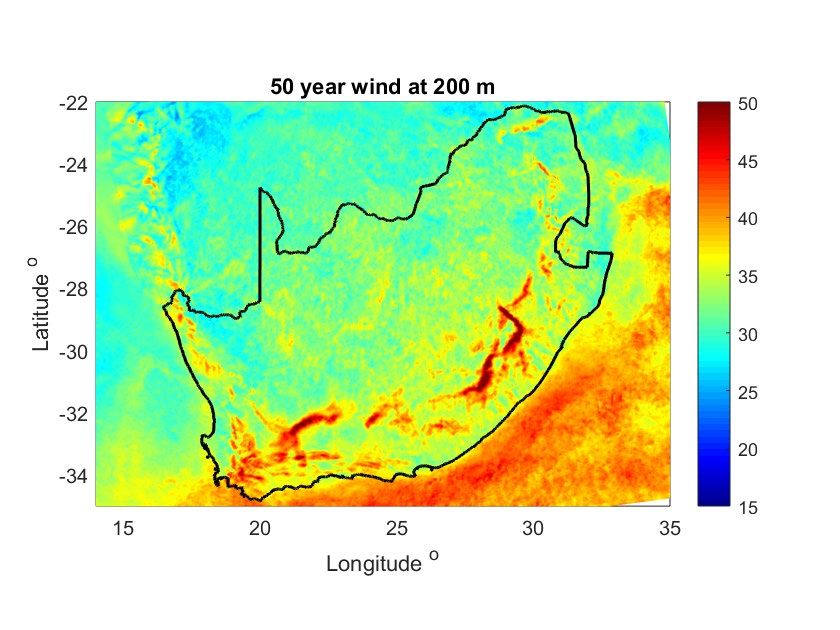
Fig. 6. Comparison of the power spectrum of wind speed at 60 m, from 10-min time series of
 measurements and 30-min time series of WRF modeled data.

Fig. 7 is the map of the 50-year wind at 10 m of 10-min values, obtained using values from 50 m and
100 m using the method shown in Fig. 5. The 10-m values obtained from 50 m, 100 m and 200 m are
systematically smaller than those from 50 m and 100 m for the extrapolation (see Fig 1 for the
difference). So there is additional uncertainty from the method of obtaining the 10-m values. In
connection with the use for design parameters, we choose the more conservative estimates, namely
using 50 m and 100 m.

In Fig. 8 the map of the so-called basic wind velocity is presented, the 10-min values of 50-year winds
that are generalized to z = 10 m over a homogeneous surface with roughness length of 5 cm. This is a
parameter that is often used in building standards, such as the Eurocode EN 1991-1-4. In our method,
this variable is used as forcing for the microscale LINCOM model to resolve the local topographical
and roughness length effect.

 Fig. 7. The 50-year wind at 10 m at a spatial resolution of 3.3 km, from 30-year mesoscale modeled
 wind (1990-2019), with spectral correction, shown for the range 10 – 35 m/s.

 13
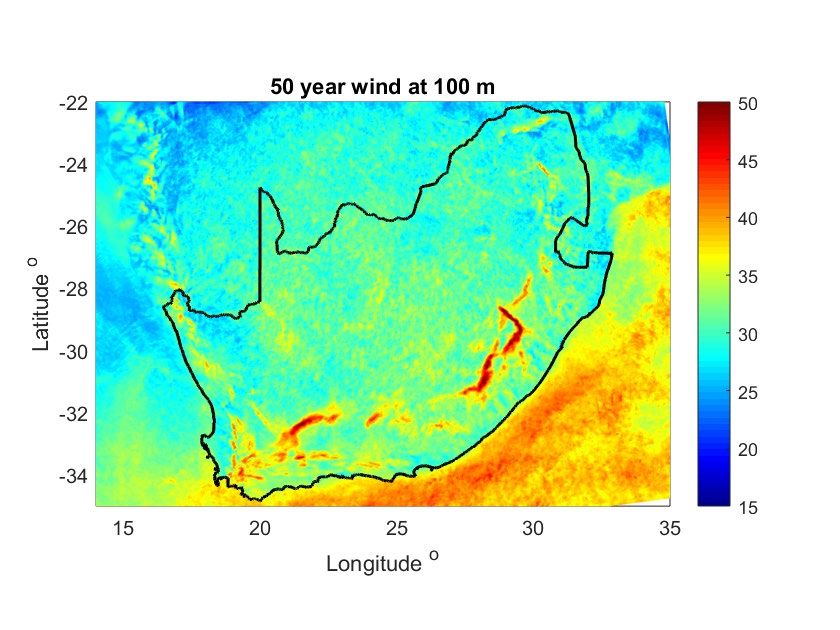
Fig. 8. The 10-min values of 50-year wind at standard conditions (10 m, over roughness length of 5
 cm) at a spatial resolution of 3.3 km, from 30-year mesoscale modeled wind (1990-2019), with
 spectral correction, shown for the range 10 – 35 m/s.

The figures of the 50-year winds at 50 m, 100 m and 200 m can be found in Appendix.

3.2.2. GASP

The results from GASP are 50-year winds of 10-min values at 50 m, 100 m and 150 m. The spatial
resolution is 250 m, much finer than the data from the WRF output. The 10 m values can be
extrapolated in a similar way as described in section 2. The corresponding map for 10 m was not
produced here due to the large amount of data. It can easily be done for particular sites, as done for
validation here (see Fig 9).

 14
Fig. 9. The 10-min values of the 50-year wind at 50 m at a spatial resolution of 250 m, shown for the
 range 5 – 40 m/s (GASP project output).

4. Comparison of measurements and model data

The modeled and measured 50-year 10-min as well as 3-s gust values are compared briefly in the
following.

4.1. Comparison between WRF-WASAIII, WRF-WASAI and observations

The scatter plot in Fig. 10 include four groups of data, of which WASA III 10m and WASA 60 m
correspond to the modeled data as described here with 3.3 km and 33-year long, and the WASA I and
WASA II correspond to the mesoscale modeling performed in WASA I and II with a spatial
resolution of 4 km and half the length of simulation.

 15
Fig. 10. Comparison of the 50-year wind at 10 m between observation and WRF model, blue:
 WASAIII-111 stations; red and green: 12 stations from WASAI and II; purple: WASA stations with
 measurements at 60 m.

4.2. Comparison between GASP results and measurements

For the 111 stations, the 10-m values from the GASP database are extracted and plotted together with
the measured ones in Fig. 10. For the WASA stations, the 60-m values are plotted in purple.

Note that in Fig. 10, we used logarithmic extrapolation of winds at 50 m and 100 m to 10 m and we
applied an extra 6% for spectral correction. In Fig. 11, we used the same logarithmic extrapolation,
though the results are very similar if we use 50 m and 100 m, or 50 m, 100 m and 150 m, or even
second order polynomial fit. Overall, the values are on average underestimated in the GASP data by
approximately 6%.

 Fig. 11. 10-min values of the 50-year wind at 10 m from measurements versus those from the GASP
 project.

 16
4.3. The 50-year 3-s gust values

Fig. 12 shows the scatter plot of the 3-s values of the 50-year gust, measured and modeled at the 111
stations from Table 1.

 Fig. 12. Comparison of the 3-s values of the original 50-year gust at 10 m at 111 stations, based on
 Fig. 10.

5. Discussion and conclusion

Extreme winds are key design parameters. The 10-min values of the 50-year wind at turbine hub
height are needed together with turbulence intensity and mean wind speed to decide turbine classes.
At the same time, the hub height gust magnitude should also be given for the standard wind turbine
classes. In addition, for the wider engineering sector and built environment, the extreme wind
statistics as included in the national loading code is essential to design for specific extreme winds.

In the WASA III phase, we used the high-resolution mesoscale model results to produce the following
products over the entire country:

 a. The 10-min values of the 50-year wind at several heights, including 10 m.
 b. The 10-min values of the 50-year wind of the standard conditions (at 10 m over roughness
 length of 5 cm).
 c. The 3-s values of the 50-year wind at several heights, including 10 m.
Note that these data are available at a spatial resolution of 3.3 km. The WRF model outputs are at 50
m, 100 m and 200 m, which makes it possible to derive the corresponding values at any hub height
between the land surface to 200 m. These data are useful for regional planning. For a particular site, in
order to obtain even finer resolution calculation, e.g. at a spatial resolution of 10 m, one can use
dataset-b as input to the LINCOM model in WAsP Engineering.

 17
At the same time, the 10-min values of the 50-year wind and turbulence intensity at several heights, as
well as turbine classes can also be assessed through the GASP project output over South Africa. This
data are available at a spatial resolution of 250 m, and they can be used as reference to the ones
calculated in the WASA project.

6. References

GASP project: https://www.vindenergi.dtu.dk/english/research/research-projects/gasp.

Hahmann A et al. (2020) WASA III report: Mesoscale and Microscale Downscaling for the Wind
Atlas of South Africa (WASA) Project -- Phase 3.

Kruger, AC. (2011): Wind climatology of South Africa relevant to the design of the built
environment. PhD thesis, Stellenbosch University. Available at:
http://www.hdl.handle.net/10019.1/6847.

Kruger AC et al. (2017) Development of an updated fundamental basic wind speed map for SANS
10160-3. J. S. Afr. Inst. Civ. Eng. 2017:59(4), Art. #1739, 14 pages. http://dx.doi.org/10.17159/2309-
8775/2017/v59n4a2

Larsén X. and Kruger A. (2014): Application of the spectral correction method to reanalysis data in
South Africa, Journal of wind engineering and industrial aerodynamics. 133 (2014) 110-122.

Larsén X. and Kruger A. (2016): Calculation of extreme winds and extreme gusts for WASA II
domains – modeling. WASA II report.

Larsén X., Davis N., Hannesdóttir A., Kelly M., Olsen B., Floors R. and Nielsen M. (2020)
Calculation of Global Atlas of Siting Parameters. DTU Wind Energy E-Report-0208

Mortensen N., Hansen J. C., Prinsloo L., Prinsloo E., von St. Age U. and Mabille E. (2020): WASA
Observational wind atlas for 10 met. Stations in Northern, Western and Eastern Cape provinces. Risø-
I-Report.

 18
Appendix: Extreme winds at various heights derived from
 WRF model output

 19
Atlas of extreme wind and gust for South Africa (WASA Phase III)

Copyright ©

All rights reserved. No part of this publication may be reproduced, stored in a retrieval system, or transmitted in
any form or by any means, without the express written permission of the copyright owners.

 20
You can also read