Commercial Market Insights April 2022 - National Association of REALTORS Research Group - National Association ...
←
→
Page content transcription
If your browser does not render page correctly, please read the page content below

Commercial Market Insights
April 2022
National Association of REALTORS®
Research Group
Overview
Commercial real estate market poised to continue to recover
amid rising interest rates and high inflation

 Strong fundamentals in property segments of the multifamily, office, industrial, and retail
 markets are likely to keep the commercial market recovery going although at a moderate
 pace amid rising interest rates and elevated inflation of over 2% during the next two years.
 The hotel market is expected to slow amid rising air fare, transportation costs, and belt-
 tightening by consumers as inflation outpaces wage gains.

 In the apartment market, rising mortgage rates will tend to increase the demand for rental
 units. Given the pace of home price appreciation (+23% from March 2021 through May 2022
 based on NAR median existing-home sales price) and the rise in 30-year fixed mortgage
 rates (+2.1 percentage points), the monthly mortgage payment has increased by about
 $750 dollars, pricing out about 4 million 25-44 year old renter households. As of April,
 multifamily rents are up 9.4% year-over-year, ahead of the inflation rate of 8.5%, making
 multifamily rental acquisitions a good investment hedge against inflation. Moreover, 27%
 of metro areas are experiencing double-digit rent growth, mostly in the South region,
 specifically, Florida (see p.8). Rents are rising faster in Class B/C buildings than in Class A
 buildings, an indication of the desire for more affordable units.

 Another good hedge against inflation is the industrial property market. with rents up 11%
 year-over-year, with 37% of 390 markets posting double-digit rent growth. Again, the
 fastest rent growth is in the South region, the only region to experience net domestic
 migration from 2019 through 2020, according to US Census Bureau data. To be clear, this
 sector is also facing headwinds: demand is expected to ease somewhat as consumer
 spending slows because inflation is rising higher than wage growth. However, the rising
 cost of oil could increase the demand for fulfillment centers as businesses seek to cut back
 on rising transportation costs should oil prices remain elevated. The demand for
 warehousing is also likely to increase as logistics operators and businesses engage in ‘just-
 in-case’ inventory management from “just-in-time” management to minimize raw
 material supply disruptions (see p.10).

 In the office market, asking rents continue to increase although rents are still below the
 inflation rate, which reduces its attractiveness as an inflation hedge. Still, asking rents
 continue to recover, with an average growth of 1.3% year-over-year as of April. Only the
 Washington, DC metro area is suffering from a 0.2% year-over-year rent decline. Given the
 ongoing construction of about 150 MSF, vacancy rate will likely remain above 10%, but
 rents will continue to increase modestly (see p.9).

 Retail stores such as strip centers, neighborhood centers, and power centers are likely to
 be less impacted than malls which the ongoing recovery in malls could likely slow, as
 evidenced by the faster rent growth of these stores types (over 4%) compared to malls
 (below 4%). However, with little construction underway, rent growth is not likely to decline,
 rising at the mid-3%. With rents rising at below the inflation rate, retail properties are not
 as good as an inflation hedge as against multifamily and industrial properties (see p.11).

 The hotel industry faces renewed headwinds in 2022, with rising airfares and gas prices
 that could slow personal travel and therefore demand for lodging. A slowing economy
 could also lead businesses to cut back on business meetings and conferences (see p.12).

 Enjoy this month’s issue!
Economic Conditions
Job growth still solid amid rising inflation and interest rates

20.8 million jobs as of April 2022
                                                            20.8 Million Payroll Jobs Created With 1.2
Non-farm payroll employment                                Million Lost Jobs to Recover as of April 2022
increased by 428,000 jobs in April, with
20.8 million net jobs created relative to               155                         152.5                             151.3
February 2020, or 95% of the 22.4

                                            Millions
                                                       150
million jobs lost during March and April               145
                                                       140
2020. There are just 1.2 million nonfarm                135
payroll jobs still to be recovered. The                130
unemployment rate held at 3.6%, just a                  125                         130.5
                                                       120
tad over the 3.5% rate in February 2020.                 115
The largest net job creation is in

                                                                Mar/2021
                                                                May/2021
                                                                  Jul/2019
                                                                Sep/2019

                                                                May/2020
                                                                Jan/2020

                                                                Nov/2020
                                                                 Jan/2021

                                                                Nov/2021
                                                                Jan/2022
                                                                 Jan/2019

                                                                May/2019

                                                                Nov/2019

                                                                Mar/2020

                                                                Mar/2022
                                                                Mar/2019

                                                                 Jul/2020
                                                                Sep/2020

                                                                  Jul/2021
                                                                 Sep/2021
professional/business services
(+738,000) followed by transportation
and warehousing (+674,000), which
                                             Source: BLS Establishment Survey
bode well for the recovery of demand
for office space and sustained demand
for industrial space. Even retail trade
                                                               Net Nonfarm Payroll Job Gains as of April
jobs were up (+284,000). Jobs in the                               2022 vs. February 2020 (in ‘000)
finance and insurance industry
increased (+87,000) while real estate,                                                 738Prof/Business Services
rental, and leasing jobs have still not                                                674 Transportation & Warehousing
recovered (-16,000).                                                               284     Retail Trade
                                                                                 87       Finance    and Insurance
As of April 2022, non-farm employment                                           48         Information   Services
                                                                                4          Construction
in 33% of 401 metro areas has surpassed
                                                                           -8              Utilities
the level of nonfarm employment in
                                                                          -16              Real Estate, Rental & Leasing
February 2022. The largest job gains are                                 -32               Educational Services
mainly in the South and West                                            -56                Manufacturing
(Mountain division), led by Dallas,                                     -57                Wholesale Trade
Austin, Atlanta, Riverside, ad Nashville.                               -73                Mining and Logging
The larges job losses are in the primary                            -278                   Other Services
markets like New York, Los Angeles, San                            -377                    Health Care & Social Assistance
Francisco, Washington DC, Chicago,                              -690                       Government
Boston, Minneapolis, Philadelphia, and      -1,438                                         Leisure & Hospitality

Pittsburgh.

           Source: BLS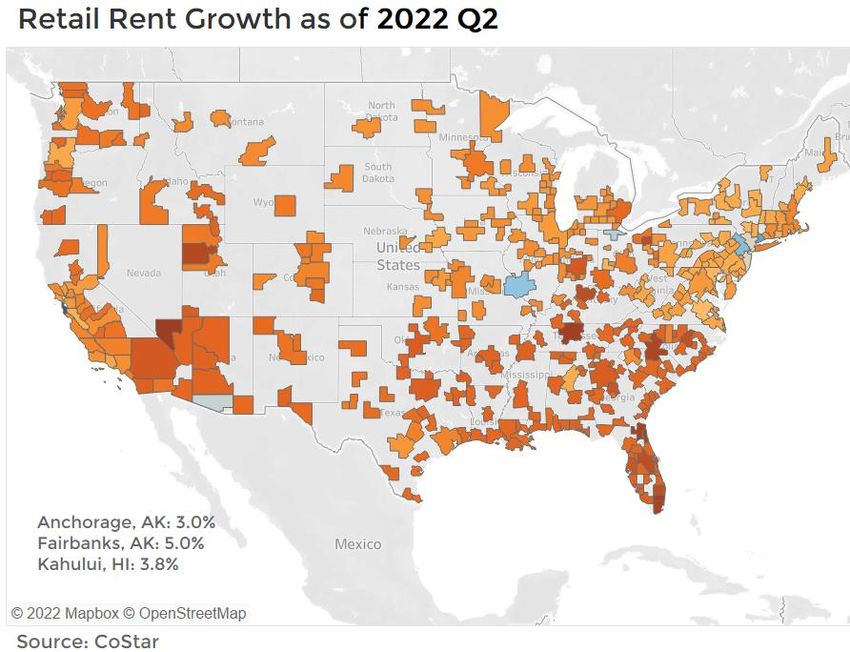
Economic Conditions
Teleworking due to the pandemic continues to decline
Fraction of workers who teleworked due to
the pandemic decreases to 8%
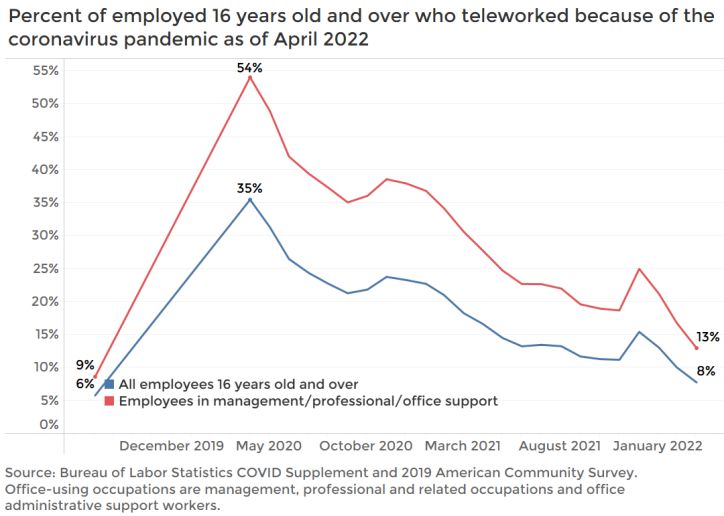
Workers continue to head back to the office.
As of April 2022, just 8% of employed workers
16 years old or over teleworked because of
the pandemic, down from a peak of 35%, but
still twice than the 6% rate prior to the
pandemic. The fraction of workers working
from home could be higher because of a
permanent shift towards full-time remote or
hybrid work schedule. Google Trends tracks
the number of visitors to workplaces relative
to the pre-pandemic level. In the District of
Columbia, visits to workplaces is still down
39% compared to the pre-pandemic level,
and down by close to 20% in New York, New
Jersey, Massachusetts, California, and
Colorado.
Inflation rate accelerates to 8.5% in March
The inflation rate measured using the
consumer basket (CPI) accelerated to 8.5% in
March, with the strongest uptick for items
like used cars and trucks (35%), energy
services and commodities (32%), and airline
fares (26%). Food consumed at home rose
10% while food consumed away from home
was up 6.9%. Source: US Census Bureau
Even with a tight labor market, wage growth
has been tame at 4.7%. This is a good sign
that there is no wage-price spiral, but
negative income growth will tend to reduce Inflation Rate
consumer spending. 40.0
30.0 32.0
Y/Y Year Percent Change in Average 20.0
Weekly Wages and Inflation Rate 10.0 8.5
0.0
10.0
8.5 -10.0
8.0
-20.0
6.0
4.7 -30.0
4.0
Nov/2020
May/2020
Sep/2021
Jan/2020
Jan/2021
May/2021
Nov/2021
Jan/2022
Mar/2020
Mar/2021
Mar/2022
Jul/2020
Sep/2020
Jul/2021
2.0
0.0
Jan/2019
Jul/2019
Sep/2019
Jan/2020
May/2020
Nov/2020
Jan/2021
May/2021
Nov/2021
Jan/2022
May/2019
Mar/2021
Nov/2019
Mar/2020
Jul/2021
Mar/2019
Jul/2020
Sep/2020
Sep/2021
Headline infation Energy
Source: US Census Bureau
Y/Y Percent Change in Average Weekly Wages
Inflation
Source: US Census Bureau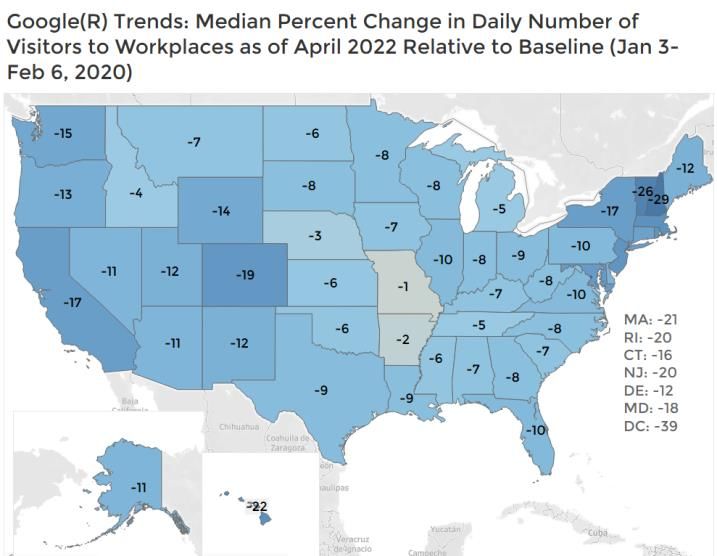
Economic Conditions
Rising inflation and interest rates are slowing down spending
Retail sales decreased 4% in real terms in
March 2022
Nominal Y/Y Percent Change in Retail
With rising inflation, retail sales rose 4.9% year- Sales in March 2022
60.0
over-year in March in nominal terms, but
adjusted for inflation that has increased 8.5%, 40.0
retail sales are down about 4%. 20.0
0.0 4.9
New orders of non-defense capital goods
-20.0
rose 8% in real terms in March 2022
Jul/2021
Jan/2020
Jan/2022
Jul/2020
Jan/2021
Apr/2021
Oct/2021
Apr/2020
Oct/2020
New orders of non-defense capital goods rose
16.7% year-over-year in March in nominal
terms, and by about 8% when adjusted for
inflation. Higher investment spending means Source: US Census Bureau
businesses are still broadly optimistic about
the medium-term outlook of the economy.
Y/Y Percent Change in New Orders of
CRE loans up 7% year-over-year in March Non-defense Capital Goods
2022 150.0
100.0
Commercial real estate loans outstanding held
by commercial banks started picking in the 50.0
second half of 2021, and as of March 2021, loans 16.7
0.0
outstanding rose to $2.6 trillion, up nearly 7%.
Commercial real estate loans are loans for the -50.0
purchase of commercial real estate (like
mortgage loans for the personal real estate). -100.0
Jan/2020
May/2020
Nov/2020
Jan/2021
May/2021
Nov/2021
Jan/2022
Mar/2022
Mar/2020
Jul/2020
Mar/2021
Sep/2020
Jul/2021
Sep/2021
Rising loan volume indicates that businesses
hold a positive outlook of economic and
business conditions.
Source: Institute of Supply Management
However, investors see greater economic risks
ahead compared to last year, as indicated by
the tighter spread between the 10-year T-note Year-over-year Percent Change in
(2.75%) and 30-year T-note (2.81%). Commercial Real Estate Loans
10-Year and 30-Year T-Note Yields at 8.0
Constant Maturity 7.0 6.6
7.00 6.0
5.0
6.00
4.0
5.00 3.0
4.00 2.81 2.0
3.00 1.0
2.00 2.75 0.0
Mar/2022
Jan/2020
May/2021
May/2020
Sep/2020
Mar/2021
Sep/2021
Nov/2021
Mar/2020
Jul/2020
Nov/2020
Jan/2021
Jul/2021
Jan/2022
1.00
0.00
Nov/2003
Nov/2010
May/2007
Jul/2015
Sep/2016
May/2021
Jan/2005
May/2014
Mar/2020
Mar/2006
Jan/2012
Nov/2017
Jan/2019
Jul/2001
Sep/2002
Jul/2008
Sep/2009
Mar/2013
Source: Federal Reserve Bank
10-year T-note yield 30-year T-note yield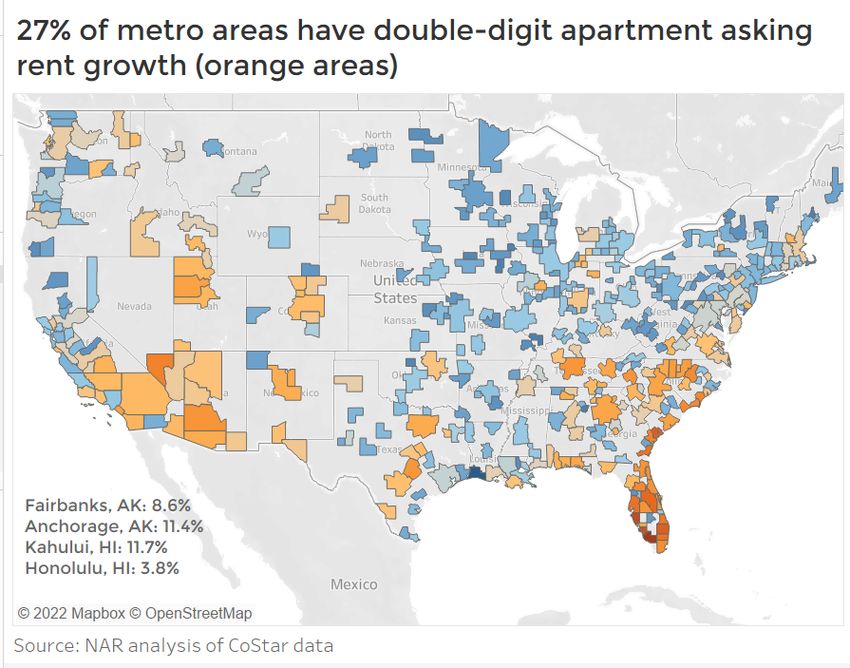
Commercial Market Overview
Occupancy still rising amid higher interest rates

  All commercial sectors experienced net
  positive absorption in the last three months
  through April 2022.

  With rising mortgage rates, absorption of
  multifamily units in the past three months as
  of April 2022 rose to about 77,000 units, an
  increase from 58,000 units in 2021 Q1.
  However, deliveries over the past 12 months
  of 414,000 units outpaced absorption of
  380,000, leading to a slight uptick in the
  vacancy rate to 5.2%. Rent growth
  moderated to 9.4% after rising at double-
  digit pace in the second half of 2021.

  In the office market, 20.2 million square feet
  (MSF) was absorbed on a net basis in the
  past three months as of April, up from just
  3.4 MSF in 2022 Q1. However, there is still
  about 115 MSF returned to the market since
  2020 Q2, pushing up the vacancy rate to
  12.2%, from 9.7% in 2020 Q1. Asking rents are
  now rising at over 1% year-over-year.

  In the industrial market, 103 MSF of industrial
  space was absorbed in the past three
  months as of April 2022, up from 98.5 MSF in
  2022 Q1. The industrial sector has the lowest
  vacancy rate among the core property
  markets and the strongest rent growth, at
  11.2% year-over-year.

  In the retail property market, net absorption
  totaled 22 MSF in the past three months
  ended April 2022, slightly lower than the 24
  MSF net absorption in 2022 Q1. Net
  absorption in the past 12 months totaled 100
  MSF compared to just 22.4 MSF in net
  deliveries, pushing down the vacancy rate to
  4.4% and propping up rent growth to 3.9%.

  Rent growths for multifamily and industrial
  assets are outpacing inflation, making these
  assets a good hedge against inflation.
  However, rent growth is running below the
  inflation rate in the office and retail property
  markets.
Commercial Market Overview
Multifamily and industrial assets offer a hedge against
inflation
 The volume of investor acquisitions over the 12-
 month period ended April 2022 slowed
 somewhat compared to the 12-month level
 ended in March 2022, but acquisitions are still
 outpacing the level one year ago. Total
 acquisitions for multifamily, office, industrial,
 and retail properties totaled $544.8 billion. Sales
 deals are 13% below the $623 billion in 12-month
 acquisitions ended March 2022 but are up 70%
 from the 12-month sales deal volume of $365
 billion ended 2021 Q2. Of total acquisitions, 46%
 of dollar volume went into multifamily
 acquisitions.

 On average, sales prices of industrial properties
 were up 15% from one year ago, yielding a 19%
 total return on sold properties.
 Multifamily property prices rose 10.5%, yielding a
 total return of 12.7%. Both these assets are
 earning rental income and returns that are
 higher than the current inflation rate, which
 make them attractive assets to hold at a time of
 high inflation.

 Retail properties also fetched decent prices, up
 5% from one year ago. On average, sellers
 gained a 10% return on their investment.
 Continuing worker re-entry is driving the
 demand for office space, with sales price up
 2.4% on average with sellers earing a 7% total
 return on investment. However, the rent growth
 on these assets is lower than the inflation rate.
 The low vacancy rate on retail properties
 reduces the drag of low rent growth on net
 operating income, but not generally so for office
 properties which are suffering from high
 vacancy rates.
Multifamily
Rents in Class A/B buildings rising at a double-digit pace

 In the apartment market, Class A and B
 buildings offer a good hedge against
 inflation, with asking rents up 10% year-
 over-year. However, Class C apartment rents
 are rising below the rate of inflation.
 However, it will be hard to adjust rents on
 Class C apartments. These are less
 expensive and would likely be occupied by
 renters with lower incomes. With average
 weekly wages rising by just 4.7%, adjusting
 rents to keep pace with inflation will make
 these units unaffordable for renters.

 As of April 2022, asking rents are up at a
 double-digit pace in 27% of 390 markets
 tracked by CoStar®. The highest rent
 growths are metro areas in in the South
 region, led by 10 metro areas in Florida led   Apartment Outlook as of May 2022
 by Naples (26%), Fort Myers (24%), Orlando
 (20%), Palm Beach (19%), and Fort
                                                             2021 Actual 2022 F    2023 F
 Lauderdale (18%).                              Vacancy Rate        5.2%      4.8%     4.8%
                                                Rent Growth         8.3%     12.8%    12.8%
 Outlook for 2022-2023                          Price Growth        9.5%     12.2%    11.8%
 Rising mortgage rates will prop up demand
 for apartments, which will tend to lower       Cap Rate            5.5%      5.2%     5.3%
 vacancy rates in 2022-2023 and sustained
 double-digit rent and price growth which
 will further push down cap rates to the
 lower 5%.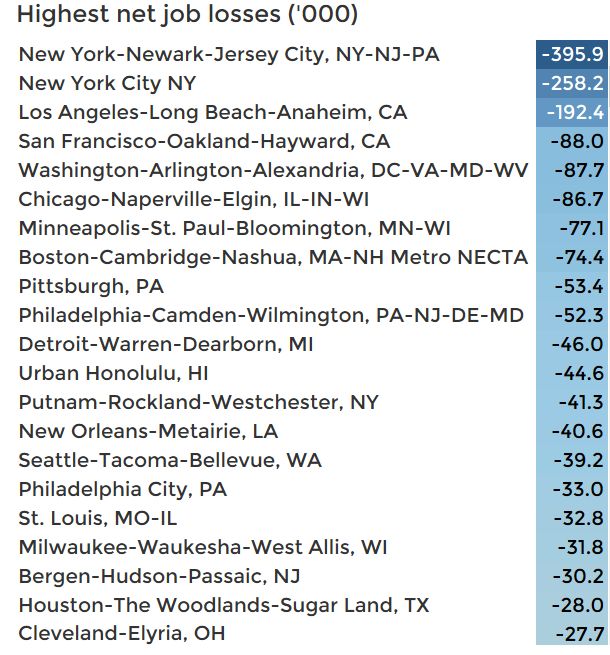
Office
Rents likely to keep rising as more workers return to the
office
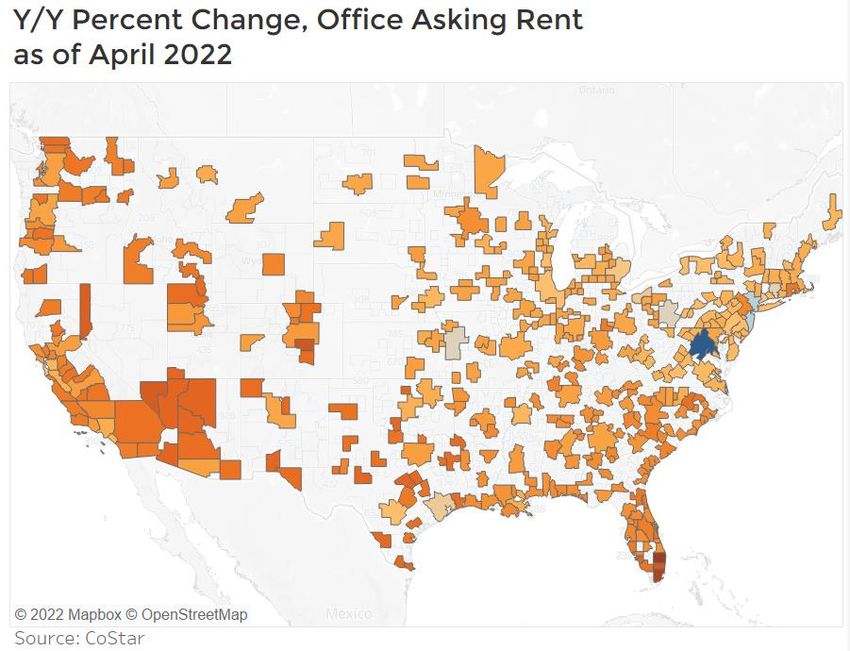
In the office property market, asking rents
continue to improve, with asking rents up
1.3% year-over-year on average nationally.
Rents are growing faster in Class B/C office
buildings at 1.5% to 2% while asking rents are
up below 1% year-over-year on Class A
buildings. That’s because Class A buildings
are on average suffering from higher
vacancy rates, at 16.6%, while vacancy rates
are lower for Class B, at 11%, and Class C
buildings where the average vacancy rate is
4.9%.
Asking rents are now up across all 390
markets tracked by CoStar except in
Washington, DC metro area where office
rents are -0.2% year-over-year (blue area in
map). In New York metro area, asking rents
are at par with the level one year ago. Office Outlook as of May 2022
However, rents are rising below inflation
even in the top rent growth markets led by 2021 Actual 2022 F 2023 F
Palm Beach, Miami, Colorado Springs, Fort Vacancy Rate 12.0% 12.0% 11.8%
Lauderdale, and Las Vegas. Rent Growth -0.8% 1.4% 2.0%
Price Growth 0.5% 2.5% 2.6%
Outlook for 2022-2023
Cap Rate 6.4% 6.0% 6.0%
With workers continuing to head back to
the office, the higher demand for office
space is expected to moderate the decline in
demand due to slower new business
formation. This will slightly reduce vacancy
rates although the vacancy rate will likely
remain above 10%. Rent and price growth
will remain modest, but the stronger sales
price appreciation will push cap rate towards
6%.
Source: NAR analysis of CoStar data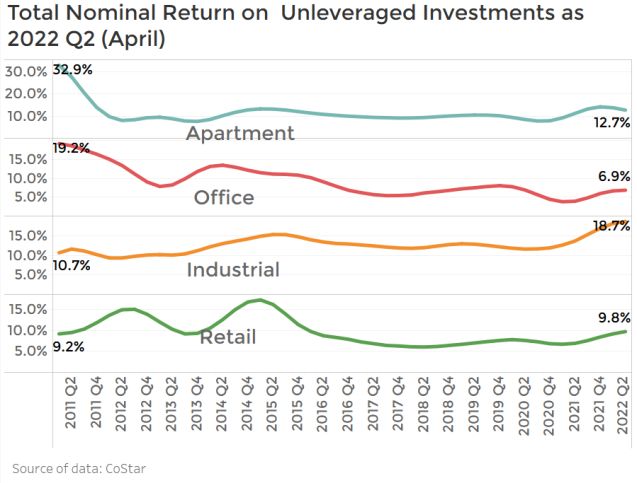
Industrial
Migration to the South region spurs demand for logistics
In the industrial property market, logistics
(warehouse, distribution, fulfillment centers)
has been the growth driver. Asking rents for
logistics space is up on average 12.4% year-
over-year compared to 8.5% for flex space.
The strong growth for logistics space is being
driven by e-commerce sales, which accounts
for 16% of sales, up from 13% before the
pandemic.
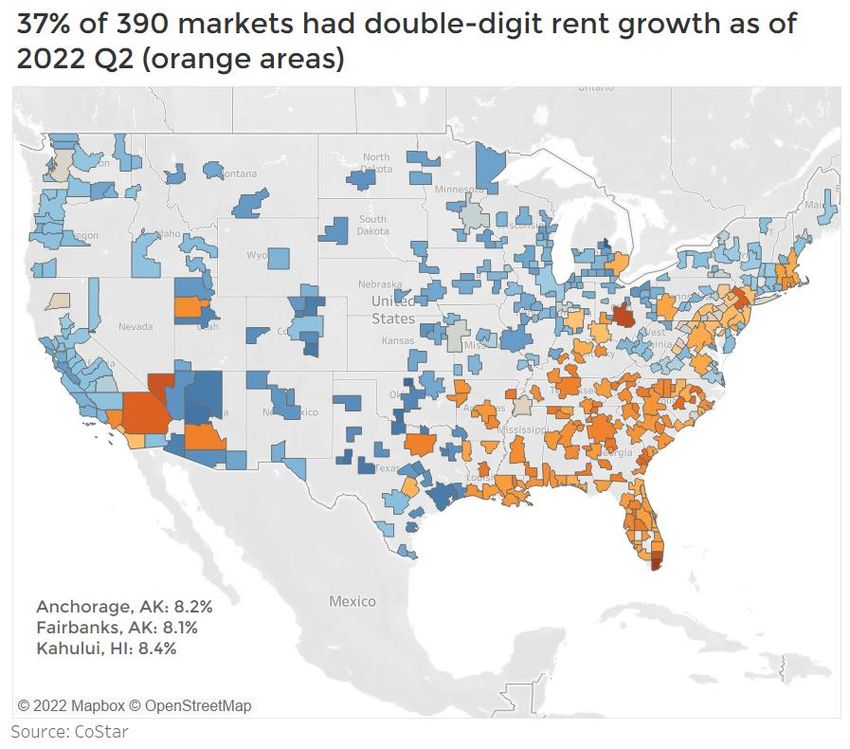
Asking rents are rising at a double-digit pace in
37% of 390 markets tracked by CoStar .Several
metro areas with the fastest rent growth are in
the South region. According to US Census
Bureau population statistics, the South region
was the only region that had positive net
domestic migration of 657,682 (the movement
of people from one area to another within the
United States) between 2020 and 2021. Rising Industrial Outlook as of May 2022
population means more demand for goods 2021 Actual 2022 F 2023 F
which pulls the demand for logistics space.
Vacancy Rate 4.8% 4.3% 4.8%
Outlook for 2022-2023 Rent Growth 7.4% 10.7% 9.8%
Price Growth 11.5% 13.1% 9.2%
Demand is expected to ease somewhat as Cap Rate 6.4% 6.0% 6.2%
consumer spending slows with inflation
outpacing wages. However, the rising cost of oil
and fuel is expected increase the demand for
fulfillment centers even more as businesses
seek to cut back on rising transportation costs
should oil prices remain elevated. The demand
for warehousing is also likely to increase as
logistics operators and businesses engage in
‘just-in-case’ inventory management from
“just-in-time” management.
Source: NAR analysis of CoStar dataRetail
Strip, neighborhood, and power centers less at risk to
consumer spending cutbacks than are malls
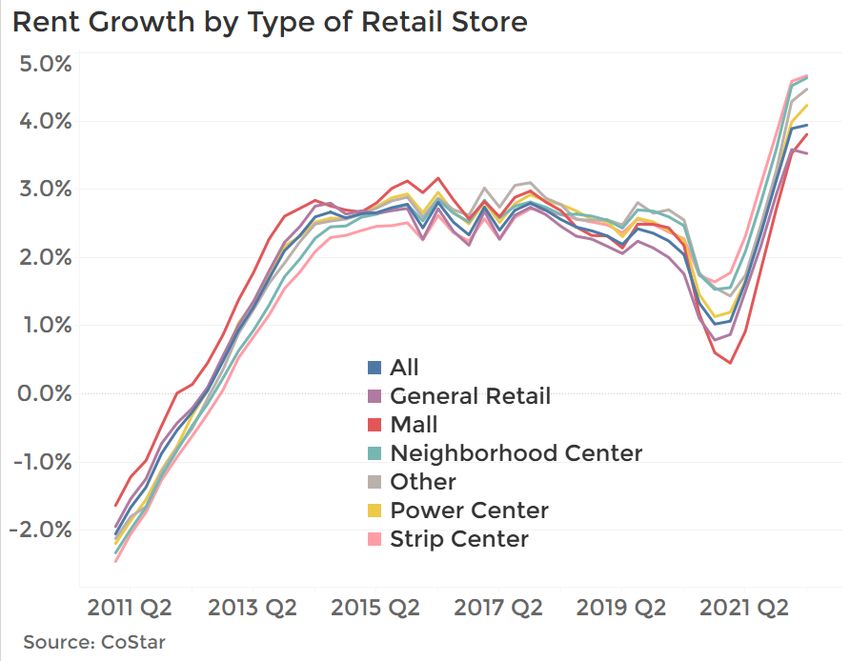
Rents are rising across all types of retail stores.
However, stores that provide essential
products and discounted prices such as strip
centers, neighborhood centers, and power
centers continued to outpace rent growth in
malls. These type of stores* provide essential
items and discounted prices, which make the
less vulnerable to slowing consumer demand
under inflationary economic conditions.
As of 2022 Q2, rents in strip centers rose at the
highest pace of 4.7%, followed by
neighborhood centers, at 4.6%. In power
centers, rents were up 4.2% year-over-year. On
the other hand, rents were up 3.8% in malls.
As of April 2022, rents were up in 72% of 390 *Strip centers are anchored by convenience/mini-mart
metro areas, with the strongest rent growth in stores; neighborhood centers are anchored by
supermarkets; power centers or category killers are
the South region and Mountain division areas, anchored by home improvement, discount stores,
led by Las Vegas, Nashville, Jacksonville, Fort warehouse clubs.
Lauderdale, Miami, Charlotte, and Salt Lake
City, with rents rising above the inflation rate. Retail Outlook as of May 2022
2021 Actual 2022 F 2023 F
Outlook for 2022-2023 Vacancy Rate 4.9% 4.8% 5.0%
Rising inflation pose headwinds to retail real Rent Growth 4.9% 3.4% 3.0%
estate as consumers cut back on spending in Price Growth 3.3% 2.8% 2.6%
real terms, more so because wages are rising Cap Rate 6.5% 6.2% 6.3%
below inflation. However, retail stores such as
strip centers, neighborhood centers, and
power centers are likely to be less impacted
than malls which the ongoing recovery in
malls could likely slow. However, with little
construction underway, rent growth is not
likely to decline, rising at the mid-3%.Hotel Slower economic growth and inflation stall the hotel recovery Rising inflation and a slowing economy have taken some wind out of the recovery in the hotel sector. Hotel occupancy slipped to 52,5% in April 2022 after rising to 66% in August last year. However, the average daily rate per room rose to $143/room, up 35% year- over-year. The revenue per available room (RevPAR) also increased 57% year-over-year to $88/room, an indication of improving financial position. Sales acquisitions have been rising since 2021. As of April, the 12-month sales volume rose to $10.5 billion, from just $2.4 billion one year ago. Sales data does not provide information if the investors intended to continue operating the hotels as hotels or undertake an adaptive reuse, such as for residential purposes. However, most acquisitions were of luxury, upper upscale, and upscale hotels. As of April 2022, occupancy rates in the luxury and upper upscale segments was below 60%, which indicates the hotels may end up being converted for other uses. Outlook for 2022-2023 In 2022, rising airfares and gas prices could put a dent on personal travel and therefore demand for lodging. A slowing economy could also lead businesses to cut back on business meetings and conferences. ADR is the total revenue/number of rooms. RevPAR is ADR x occupancy rate.
COMMERCIAL MARKET INSIGHTS REPORT
April 2022

LAWRENCE YUN, PhD
Chief Economist & Senior Vice President for Research

GAY CORORATON
Senior Economist & Director of Housing and Commercial Research

MEREDITH DUNN
Research Manager

Download report at https://www.nar.realtor/commercial-market-insights

Download other NAR Commercial reports at Commercial Research

©2022 National Association of REALTORS®
All Rights Reserved. May not be reprinted in whole or in part without permission of the National
Association of REALTORS®.

For question about this report or reprint information, contact data@nar.realtor.
The National Association of REALTORS® is America’s largest trade association,
representing more than 1.5 million members, including NAR’s institutes, societies
and councils, involved in all aspects of the real estate industry. NAR membership
includes brokers, salespeople, property managers, appraisers, counselors and
others engaged in both residential and commercial real estate. The term
REALTOR® is a registered collective membership mark that identifies a real estate
professional who is a member of the National Association of REALTORS® and
subscribes to its strict Code of Ethics. Working for America's property owners, the
National Association provides a facility for professional development, research and
exchange of information among its members and to the public and government
for the purpose of preserving the free enterprise system and the right to own real
property.

NATIONAL ASSOCIATION OF REALTORS®
RESEARCH GROUP

The Mission of the NATIONAL ASSOCIATION OF REALTORS® Research Group is to
produce timely, data-driven market analysis and authoritative business intelligence
to serve members, and inform consumers, policymakers and the media in a
professional and accessible manner.

To find out about other products from NAR’s Research Group, visit
www.nar.realtor/research-and-statistics

500 New Jersey Avenue, NW
Washington, DC 20001
202.383.1000
You can also read