Wall Street vs r/wallstreetbets: Exploring the Predictive Power of Retail Investors on Equity Prices
←
→
Page content transcription
If your browser does not render page correctly, please read the page content below
Wall Street vs r/wallstreetbets: Exploring the
 Predictive Power of Retail Investors on Equity Prices
                                   Stanford CS224N Custom Project

                                          Anshul Gupta
                                  Department of Computer Science
                                        Stanford University
                                   agupta21@cs.stanford.edu

                                             Abstract

         The COVID-19 pandemic has accelerated the rapid growth of retail investors as
         legitimate market participants. In a David v Goliath showdown, retail investors,
         organizing via the subreddit "wallstreetbets" (hereafter, r/wallstreetbets), helped
         orchestrated a short squeeze of Gamestop stock, leading to a meteoric rise in the
         equity’s value and a massive loss amongst some notable hedge funds [1]. This
         research explores whether ’chatter’ on that subreddit provides any predictive ability
         on a stock’s price the following day. Specifically, performance on Gamestop and
         Tesla stock, as they are two of the most heavily discussed stocks on the subreddit
         [2]. Our top models perform at roughly 52 and 58 percent accuracy, moderately
         improving upon our ’random’ baseline of ~50 percent.

1   Key Information
       • Mentor: None
       • External Collaborators (if you have any): None
       • Sharing project: None

2   Introduction
In the last few years, investment brokerage platforms such as Robinhood have democratized access to
investing in the equity markets via their free commission structure and mobile-first offering. In fact,
Robinhood saw over 200,000 sign-ups a month in 2020 and over 3 million monthly sign-ups in the
first few months of 2021 [3]. With the onset of the COVID-19 pandemic, many folks found their lives
disrupted due to shelter-in-place policies and shift to remote work. Buoyed by government stimulus,
millions of individuals found themselves opening up a brokerage account to continue investing in
the equity markets. While the US economy suffered a hit due to the pandemic, the equity markets
kept moving up and to the right, with the NASDAQ index for example rising 43 percent in the year
2020 [4]. Looking for an online forum to discuss trades and investment opportunities, people found
themselves at the Reddit sub-forum known as "r/wallstreetbets", which saw it’s subscriber count
double in 2020 and astonishingly increase nearly 5.5 fold (from 1.7M to 9.5M) [5].
What prompted this meteoric rise in Robinhood sign-ups and r/wallstreetbets subscribers in late 2020
and early 2021? A large part of it is Gamestop, a brick and mortar retailer of video games. Noticing
that Gamestop stock had massive short interest from institutional investors (ex. hedge funds), a group
of investors convinced other users, and eventually the general public, to continue buying shares and
call options of Gamestop (ticker symbol $GME). This caused a ’short squeeze’ where the investors
who were short needed to buy back stock to cover their shorts and cap their losses (which were rising
by the day). This demand to buy back the stock also pushed the stock’s price up as well. As reference
prices, a share of GME was $4.37 on March 16,2020, $19.26 on December 30, 2020 and $347 on

Stanford CS224N Natural Language Processing with Deep Learning
January 27,2021 – at one point, it rose 1500% in 2 weeks [6]. This banding together of individuals
on a forum like r/wallstreetbets captured media attention and even that of Congress and the SEC.
This research paper explores if the content posted on r/wallstreetbets actually had any predictive
power on whether a stock goes up or down the following day. The thesis is that for the stocks being
explored (Gamestock, Tesla), their volatility has largely been fueled by retail interest insofar as
they are two of the most discussed equities on r/wallstreetbets. As such, leveraging NLP techniques
to conduct semantic analysis on these posts and weighting the more popular ones perhaps backs
into what the consensus ’retail’ sentiment may be thinking and from there, one can explore the
predictability on the equity price. Note that the novelty of this project lies primarily in the recency
of the aforementioned dynamics as well as the data set curation and application to the stock trading
task. The model architectures are fairly ’standard’ in terms of what is seen in academic research or
industry.
3 Related Work
Accurately predicting equity price movement is a fundamentally difficult task that has been explored
in various research and is consistently attempted using billions of dollars under management by
quantitative hedge funds and active traders worldwide.
Part of the reason is due to a well-established belief known as the ’efficient market hypothesis’, which
effectively states that the stock price reflects all public information and sentiment [7]. Because the
stock price incorporates all available information, having ’alpha’ or predictability over a sustained
period of time based off publicly available information is very challenging. As a result, baselines on
stock prediction tasks are generally 50 percent. Furthermore, the thesis here is that the r/wallstreetbets
phenomenon is A) very recent and so perhaps not ’priced in’ and B) perhaps the content on this
sub-reddit actually influences the price of these equities given the recent rise in perceived power of
retail influence.
On a topical basis, there are some relevant research papers that this study builds on the fundamentals
of. Vargas et al. apply deep learning to stock market prediction. Specifically, their approach it
leveraged both financial news titles and various technical indicators to forecast the daily directional
movement (up or down) of the S&P 500 [8]. This approach is of interest and drawn upon in this
paper as it provides insight into combining word embeddings with other input data in the financial
context. Ding et al. also have an interesting approach in which instead of embedding news as words,
they introduce an event embedding model from which a structured representation of actor, action,
object tuples provides more insight and precision over baseline models [9].
From an architectural perspective, the aforementioned Vargas et al. paper is incredibly insightful as it
is one of the first to apply an RCNN (Recurrent Convolutional Neural Network) model to the financial
domain [8]. This paper draws upon a variation of what was implemented by Vargas. On the notion of
embedding, BERT has been used in stock trading and has resulted in significant improvements in the
stock prediction context as compared to conventional methods [10]. Lastly, drawing upon Qiu, Wang,
and Zhou, there is evidence that adding attention into networks with LSTMs improve performance in
forecasting stock prices [11]. As such, the following presentation leverages BERT and an attention
mechanism as well. Lastly, There is evidence that standard MLPs work well in forecasting stock
movement suggesting that more complex model architecture isn’t necessarily better [12].Ultimately,
this paper draws upon state of the art NLP-based techniques in the financial/trading domain and
applies them to a novel dataset and question prompted by a very recent phenomenon.
4 Approach
4.1 Task
Our task is on day t, predicting whether stock Y goes up (1) or down (0) on day t+1. The data will be
described more deeply in the following section, but it involves Reddit posts pertaining to the given
stock, the stock’s movement on day t (0 or 1), as well as other ’analytics’-related variables on the
Reddit posts for the day.
We use four primary neural network architectures based on the aforementioned papers for processing
the word embeddings.
24.2 MLP
Our basic MultiLayer Perceptron model is a standard densely connected neural network with 32-
neuron Dense layer with ReLu activation, dropout with probability 0.3 to tackle the overfitting
challenge, and then flattening of our vector. Recall during dropout that X percent (in our case X =
30) of sample data is randomly removed during training with the hopes of preventing ’co-adaption’
between features [13].
4.3 CNN
Our Convolutional Neural Network architecture was implemented as follows. First, there was a
1-D convolution layer with 64 output filters, window/kernel size of 3, and even padding. We then
passed through a 1-d max pooling layer which downsamples the input representation by taking the
maximum value over the window (we use window size of 3). From there we have a dropout layer
with probability 0.3 to once again minimize overfitting. From there, we have another 1-D convolution
layer with 32 output filters. Lastly, we have a Global Max Pooling layer, whose window size is the
entire input, as a final layer (in lieu of flattening).
4.4 RNN
Our RNN architecture is very simple – we utilize a bidirectional LSTM, which have empirically done
well in tasks relating to time-series based financial predictions [11]. The Bi-LSTM has 64 layers and
is followed by Batch Normalization which re-centers and re-scales the output from the Bi-LSTM.
4.5 RCNN
The Recurrent Convolutional Neural Network was of great interest in experimenting with due to
its recent success in the financial domain. The hypothesis behind its success is that it combines the
benefits of both RNNs and CNNS, specifically due to CNNS purported superior ability to extract
semantic information from texts and the RNNs purported advantage in capturing temporal notions as
well as contextual characteristics [8].
Drawing upon the reference paper, the overall architecture involved a 1-d convolution layer with 64
output layers, a window size of 5, and even padding. This is then followed by a MaxPooling-1D
layer with size 3. From there, we add a Dropout layer with probability 0.3. Next, we have a 32 node
Bi-LSTM, followed by batch normalization as described above.
However, drawing upon research on attention, we expand upon previous models by adding a Self-
Sequence Attention layer with sigmoid activation [14]. The key formulas and math here are relevant:
In this case, our self-attention considers the global context for each time step. The formulas show
how the attention distribution and resulting weighted sum is calculated via the tanh and sgimoid
functions and the learned weight vectors.
Note, Each of the outputs of these architectures is then concatenated with our normalized ’auxiliary’
data (explained in the following section) and ran through the following layers:
34.6 Final Layers
After concatenation, we pass the combined input through a 128 neuron Dense Layer with r2 regular-
ization (to avoid overfitting), a Dropout layer with probability 0.3, a 64 neuron Dense Layer with
ReLu activation, a 32 neuron Dense Layer with ReLu activation, and finally a finally a sigmoid layer
for our 2 class output (1 or 0).
An example of the full architecture for our CNN model can be seen in the Appendix in order to
visualize the layers involved in this process.
4.7 Loss
Note we leverage an Adam optimizer and attempt to minimize cross-entropy loss, calculated as
-(y log(p)) + (1-y)*log(1-p)), where y is the binary indicator and p is the predicted probability
observation.
5 Experiments
5.1 Data
Creating the dataset required substantial effort. I draw from the sub-Reddit r/wallstreetbets posts
from the start of 2019 (note the data/activity before than was much more sparse). I use the Reddit
pushshift API to pull all posts that mention Gamestop or Tesla in some way (ticker symbol, company
name, CEO name, etc.). I then filter out posts that mention one of these keys less than 3 times, as a
proxy to eliminate posts that aren’t relevant. For each day, I then concatenate all the posts, ordered by
the most upvoted to the least upvoted. After filtering and tokenize, my final text vector is of length is
the 75th percentile of all concatenated tokens. I zero-pad the days whose posts’ aggregate length is
less than that cutoff. This is then run through BERT. Note that BERT is the state of the art embedding
model in many NLP applications [10]. We use pre-trained BERT embeddings, namely the dataset
based off of 2 billion Twitter posts. We found that Twitter posts worked better than the embeddings
trained on Wikipedia posts across the board of models, given that the conversational vernacular of
Reddit posts is probably more similar to tweets rather than Wikipedia entries. From this process, for
each day, we are left with a 2500 by 100 embedding for Gamestop posts and 1500 by 100 embedding
for Tesla posts.
In addition to the Reddit input data, I include some additional variables for each day. First, I include
the maximum score (up votes) of all related posts for the day, as a potential proxy for the strength of
retail interest. I also include the average (mean) score of all posts on a day as well. These variables
are all scaled and normalized as well. Lastly, if we are predicting the stock’s movement on day
t+1, I include the stock’s movement on day 0. Originally I was considering using macro variables
as seen in [9], but it made more sense to include information unique to reddit posts (as well as the
previous day’s movement) to measure the predictability of retail chatter, rather than macro-economic
correlations. This code to produce and curate the dataset was my main contribution, whereas the
model architecture and self-attention usage were largely drawn from existing Keras implementations
(citations available in the code/.ipynb itself).
These inputs are then run through the models described in the "Approach" section to product our
ultimate 0 or 1 prediction on the stock’s next day movement.s
5.2 Baseline method
Given the aforementioned discussion relating to the efficient market hypothesis and the difficulty of
having any sort of ’alpha’ over market wisdom for a prolonged period of time, a random baseline
is reasonable. Around 50 percent is what we get for training and test on both Tesla and Gamestop,
where we randomly predict 0 or 1 via a random number generator cutoff. For comparison purposes,
the specific accuracy for the Gamestop test set is 48.3% and it is 49.2% for Tesla.
45.3 Evaluation
In the markets, delivering returns requires being right on bets more often than not. As such, the
fundamental metric I am interested in here is simply accuracy, the number of correct predictions
divided by the total number of predictions. In addition to accuracy, I also track the AUC/ROC as well
as the f1 score (and thus precision and recall).
5.4 Experimental details
My model configurations and input / output are described above. In terms of training / test split, for
Gamestop, my training period was 02/06/2019 to 12/21/2020 and the testing period was 12/22/2020
to 2/26/2021 – this was based off a 75:25 split of available data. For Tesla, the training period was
01/03/2019 to 09/28/20 and the testing period was from 09/29/2020 - 2/26/2021. I run between 15-20
epochs, which is about when the loss stabilized. Earlier on in training and validation, I was facing a
big overfitting issue and so adding dropout and a regularizer seemed to mitigate that.
5.5 Results
Our results on the test set were as follows:
GAMESTOP($GME):
Category MLP CNN RNN R-CNN
Accuracy 0.50 0.478 0.434 0.521
AUC-ROC 0.589 .524 .0.487 .4971
Loss .717 1.468 3.029 .689
F1 .66 .65 .07 .67
TESLA ($TSLA):
Category MLP CNN RNN R-CNN
Accuracy 0.584 0.495 0.465 0.594
AUC-ROC 0.657 .546 .0.517 .674
Loss 1.025 .702 1.484 .726
F1 .53 .66 .47 .67
5.6 Analysis
We see that for both Tesla and Gamestop, the R-CNN and MLP models outperform the vanilla CNN
and RNN models on the basis of accuracy with the R-CNN model on Tesla yielding 59.4% accuracy
and the GME R-CNN yielding 52.1% accuracy. F1, which is a weighted average of precision and
recall, is also highest in both cases for the R-CNN.
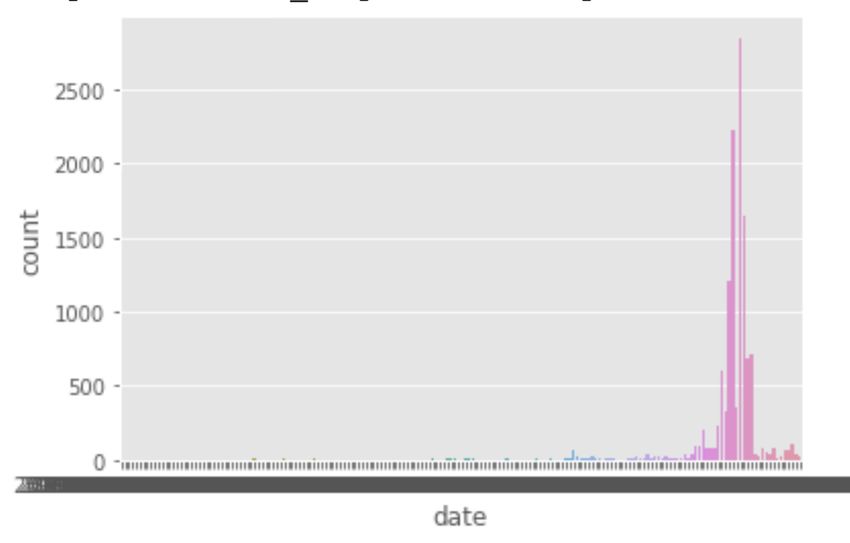
Interestingly, there was (unexpectedly) poorer performance across the board on the Gamestop data
as compared to the Tesla data, with respect to both accuracy as well as the AUC-ROC output. Our
qualitative hypothesis here is the characteristics of the dynamics in the training and testing periods for
Gamestop data are fundamentally different. Specifically, the testing period, due to the 75:25 split, is
12/22/2020 and onwards which roughly coincided with the rapid explosion of posts in Gamestop as
well as the meteoric rise in volatility of the stock. Looking at the chart below, which plots how many
posts are on each day and there’s clearly a spike towards the back-half, a phenomenon which the
training data is not exposed to. This is less true with Tesla insofar as that stock has been steadily rising
for a longer period of time and has historically been much more volatile than Gamestop meaning the
training data has that arguably necessary exposure.
5Having looked through some mis-classifications, it seems that they often occur when the stock’s
direction changes from day to day (ex. in more volatile periods) rather than smooth rises or smooth
falls. This applied both in the Gamestop and Tesla case.
Another interesting point is that while the R-CNN outperformed the RNN and CNN, confirming
our hypothesis and previous research, what was interesting was the relatively similar performance
of the R-CNN and MLP. Perhaps complex architecture or the attention mechanism as crafted were
not more effective, but more analysis here (more hypertuning, increasing the dataset size as time
passes) is needed. Lastly, we noticed that our measures to counter overfitting, such as dropout
and regularization, were not sufficient. One potential fix could have been reducing the number of
additional layers we had post concatenation. Overall, if the model was consistently ~58 percent
accurate in predicting the movement of a stock, that certainly suggests that there is some relevance in
the content coming out of r/wallstreetbets.
6 Conclusions and Future Work
We apply NLP and deep learning on a novel dataset in order to predict equity movement. On Tesla,
we find relatively promising performance using the MLP and R-CNN models. On Gamestop, the
performance on our models doesn’t mark a statistically significant improvement over the random
baseline, potentially due to a combination of overfitting in training and the different volatility
dynamics in the training and testing period as discussed above. Another key learning was that
simpler could be better, as seen with the MLP outperforming the RNN and CNN across most metrics.
Ultimately, if the Tesla performance persists via the R-CNN model and is moderately above 50%,
one could make substantial returns executing trades based on a formulation that draws on semantic
learnings from r/wallstreetbets posts. This arguably speaks to the power and influence of the average,
non-institutional trader.
Note that there are many limitations to this approach that future work could improve upon. More
robust hyperparameter tuning and techniques to avoid overfitting could conceivably improve per-
formance. Additionally, we only tested out two equities that were some of the most popular on the
sub-Reddit [2]. It’s unclear how this would generalize for less-discussed equities or more broad
indices such as the S&P 500. Furthermore, a different word embedding other than pre-trained BERT
could yield more promising results such as a Reddit specific embedding [15]. Adding macroeconomic
features, which is a more conventional approach in predicting stock movement, could also improve
model accuracy as it is probably true that equity valuations aren’t solely based off of an online forum.
Nonetheless, retail traders are certainly an important market force that Wall Street now recognizes
(and potentially fears) and this paper aimed to explore that dynamic.
6References
[1] https://www.cnbc.com/2021/01/30/gamestop-reddit-and-robinhood-a-full-recap-of-the-historic-
retail-trading-mania-on-wall-street.html
[2] https://swaggystocks.com/dashboard/wallstreetbets/ticker-sentiment
[3] https://www.coindesk.com/robinhood-new-user-signups
[4] https://www.macrotrends.net/2489/nasdaq-composite-index-10-year-daily-chart
[5] https://subredditstats.com/r/wallstreetbets
[6] https://www.cnbc.com/2021/01/27/gamestop-mania-explained-how-the-reddit-retail-trading-
crowd-ran-over-wall-street-pros.html
[7] Efficient Capital Markets: A Review of Theory and Empirical Work.
[8] Deep learning for stock market prediction from financial news articles https://ieeexplore-ieee-
org.stanford.idm.oclc.org/stamp/stamp.jsp?tp=arnumber=7995302tag=1
[9] Deep Learning for Event-Driven Stock Prediction by Ding et
al.(https://www.ijcai.org/Proceedings/15/Papers/329.pdf)
[10] BERT-based Financial Sentiment Index and LSTM-based Stock Return Predictability
https://arxiv.org/abs/1906.09024
[11] Qiu J, Wang B, Zhou C (2020) Forecasting stock prices with long-short term
memory neural network based on attention mechanism. PLoS ONE 15(1): e0227222.
https://doi.org/10.1371/journal.pone.0227222
[12] Omer Berat Sezer, A. Murat Ozbayoglu, and Erdogan Dogdu. 2017. An Artificial Neural
Network-based Stock Trading System Using Technical Analysis and Big Data Framework. In
Proceedings of the SouthEast Conference (ACM SE ’17). Association for Computing Machinery,
New York, NY, USA, 223–226. DOI:https://doi-org.stanford.idm.oclc.org/10.1145/3077286.3077294
[13] https://jmlr.org/papers/v15/srivastava14a.html
[14] https://pypi.org/project/keras-self-attention/
[15] https://github.com/adamyi/Word2Vec_Reddit
7A Appendix (optional)
A.1 CNN Layer Architecture
8You can also read