UMS Strategic Planning - Data Book Spring 2022 - University of Maine System

Page created by Annette Fuller
 
CONTINUE READING
UMS Strategic Planning - Data Book Spring 2022 - University of Maine System
UMS Strategic Planning
Data Book
Spring 2022

 Data Book
 March 2022
UMS Strategic Planning - Data Book Spring 2022 - University of Maine System
HURON I 2

Guidelines for Use
The University of Maine System is embarking on its first strategic plan since 2004. To inform measured decisions that will shape a strong,
sustainable future for UMS, the Board of Trustees engaged in a data exercise to understand the current state of the System within the
context of Maine and the higher education marketplace.

The result is a Data Book that illuminates challenges which call for urgency to act and reveals the various strengths of the System. In a
state rich with geographic resources and promising economic development, UMS has an incredible opportunity to leverage its many assets,
including Unified Accreditation, to pave a path to a bright future for the System and the residents of Maine.

The Data Book is intended to establish a baseline of commonly understood knowledge about UMS to support strategic planning activities
and is one of the many inputs that will be weighed in writing a strategic plan for the System.

      Create a common understanding                                                                 Align us on a shared, sustainable
                                                                Engender meaningful collaboration
       of UMS’ demographic, financial                                                                         vision for UMS
                                                                  grounded in a market context
          and competitive situation

   Note: The data presented on UMS is the best and most recent available at date of release.                            © 2021 Huron Consulting Group Inc. and affiliates.
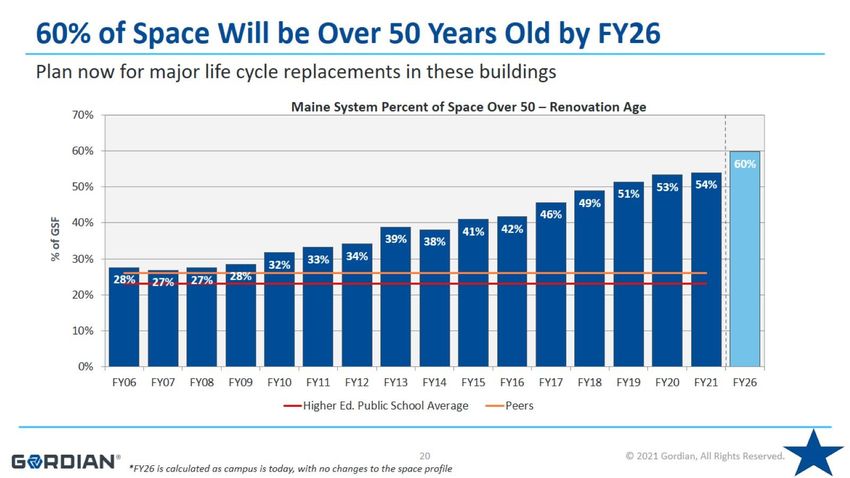
UMS Strategic Planning - Data Book Spring 2022 - University of Maine System
HURON I 3

Data Book Contents
To develop a robust understanding of the current UMS ecosystem, some topics demand broader analysis to understand their full complexity
and relationship to and within the System (e.g., student enrollment and financial health).
Enrollment and Demographics                                             Financials and Personnel
•   Maine high-school graduates pie chart, broken down by future        •   Composite Financial Index Comparison
    pathway                                                             •   Staff & Employees by university over time
•   UMS Enrollment by university over time                              •   Employee Demographics
•   Enrollment Demographics                                             •   Revenues and expenses over time
•   UMS Aggregate Enrollment broken down by in-state/ out-of-           •   State appropriations over time
    state and residential/commuter/online                               •   Tuition trends over time
•   Adult Learner Opportunity and Overview                              •   Capital expenditures and deferred maintenance
                                                                        •   Net revenue tuition and fees over time
Academics and Student Success                                           •   Capital Investments over time
•   US, Northeast and Maine Completion Rates over time                  •   Aging physical plant over time
•   Completion Demographics
•   Community College Transfer Student Success
•   Student Migration Post-Graduation                                   Higher Education Market Trends and System Benchmarking
•   Academic Portfolio across the System, Undergraduate and             • US, Northeast and Maine Current and Future Demographic
    Graduate                                                               Trends
•   Cost to Educate by Credit Hour                                      • Access and Affordability trends
•   Return on Investment university                                     • Digital transformation for teaching and learning trends
                                                                        • Lifelong learning and “Non-traditional” student
Economic Development and Research                                       • Corporate Partners and Workforce Development
•  Maine’s Current and Future Industries                                • R&D Priority Areas
•  Maine Occupations for Bachelors, Graduate, and Non-Degrees           • System case studies: UC, SUNY, UW
•  Household Income by Maine County
•  UMS Research funding over time                                                                            © 2021 Huron Consulting Group Inc. and affiliates.
UMS Strategic Planning - Data Book Spring 2022 - University of Maine System
HURON I 4

Data Book Framework

                               UMS Internal Analysis and
                           Higher Education Trends related to:

                     Academics &
   Enrollment &                                                          Financials &
                       Student         Economics         Research
   Demographics                                                           Personnel
                       Success

         System specific trends: Increase of course and program sharing across
   universities, Emphasis on cost-to-educate, Expansion of offerings to non-traditional
                                   student audiences

                                                                           © 2020 Huron Consulting Group Inc. and affiliates.
UMS Strategic Planning - Data Book Spring 2022 - University of Maine System
Internal UMS Analysis

                        5
UMS Strategic Planning - Data Book Spring 2022 - University of Maine System
Enrollment      Academics      Economics        Research        Financial
                                                                                                                                                                                                                     HURON I 6

         Maine High School Graduates: Future Pathways
         According to the MDOE National Student Clearinghouse 2020 Statewide Report, 43% of Maine public high school graduates from 2020 did
         not enroll in college.

                         Maine Public High School College-Going Population, Fall 2020                                  With Maine high school graduates projected to decline between 2025-
                                                                                                                       2035, enrollment growth may or may not be a realistic strategic
                                                                                    Enrolled in the UMS                priority. Growth will require:

                                                                                                                       •    Activating students who currently do not enroll (43% of students in
                         2,196,                                                     Enrolled in 2-Year In-State             2020)
                                                           2,429,
                         28.8%                                                      Public (MCCS)
                                                           31.8%
                                                                                                                       •    Capturing market share from out-of-state competitors (28.8% of
                                                                                    Enrolled in 4-Year In-State             market)
                                                                                    Private Non-Profit
                                                                                                                       •    Capturing market share from Maine privates (13.1% of market)
            248,                                                                    Enrolled in Other In-State
            3.2%                                                                    (Maine Maritime, Private           •    Improving pathways from 2-year institutions (23.1%%) to a UMS
                           997,                                                     for Profits, etc.)                      university
                           13.1%                  1,762,                            Enrolled Out-of-State
                                                  23.1%                                                                Note: Female students enroll in college at a rate of 14 percentage points
                                                                                                                       higher than their male counterparts. On average, 62% of female high
                                                                                                                       school graduates in Maine enroll in college whereas only 48% of male high
                                                                                                                       school graduates enroll in college.

       Implications for UMS: As we set the strategic plan for UMS’ future, all stakeholders will be challenged to think creatively as to how the System can flex over the next
                                                                decade to meet changing supply and demand.

Source: U.S. Department of Education, NESSC Common Data Project, National Center for Education Statistics, IPEDS, Fall Enrollment component 2020 provisional data. Maine DOE. 1 © 2021 Huron Consulting Group Inc. and affiliates.
UMS Strategic Planning - Data Book Spring 2022 - University of Maine System
Enrollment         Academics            Economics            Research             Financial
                                                                                                                                                                                                                                                                               HURON I 7

         UMS Enrollment by University
         In the last decade, all but one UMS university saw a decline in fall enrollment in FTE. From Fall 2012-Fall 2021 UMS experienced
         approximately 10% decline in fall enrollment.
                                                                                                                                                                                                                                                                             10 Year %
                                                                                                                                                                                                                                                    University
                                                                                                                                                                                                                                                                             Change

 20,000                                                                                                                                                                                                                                             UMS Total                -11.0%

                                                                                                                                                                                                                                                    LAW                      -9.2

 15,000                                                                                                                                                                                                                                             UMM                      -42.7

                                                                                                                                                                                                                                                    UMFK                     -23.7
 10,000
                                                                                                                                                                                                                                                    UMA                      -29%

                                                                                                                                                                                                                                                    UMPI                     -12.1%
   5,000
                                                                                                                                                                                                                                                    UMF                      -26.6%

                                                                                                                                                                                                                                                    USM                      -22.1%
        0
            2012                  2013                     2014                     2015                    2016                     2017                     2018                    2019                     2020                     2021
                                                                                                                                                                                                                                                    UM                       9.2%
                                                                                  UM       USM       UMF        UMPI       UMA        UMFK        UMM        Law

       Implications for UMS: UMS continues to experience a decline in fall enrollment like many institutions in the northeast. To maintain the mission of serving residents of
                                          Maine and their local communities, collaboration in the spirit of sustainability is critical.
Source: UMS Institutional Data, Fall FTE (Excludes early college). Note: The formula for calculating FTE (for all campuses except UMF starting in Fall 2006) is as follows: Undergraduate Credit Hours/15 + Professional (Law) Credit Hours/15 + Graduate
                                                                                                                                                                                                                                          © 2021          Credit Hours/9
                                                                                                                                                                                                                                                  Huron Consulting  Group= Inc. and affiliates.
FTE + UMF: Undergraduate Credit Hours/16 + MA Counseling Psychology Credit Hours/15 + Other Graduate Credit Hours/9 = FTE. FTE provides a meaningful combination of full- and part-time students and is used to calculate expenses per FTE and revenues per FTE.
UMS Strategic Planning - Data Book Spring 2022 - University of Maine System
Enrollment        Academics         Economics             Research      Financial
                                                                                                                                                                                                                                 HURON I 8

      UMS Enrollment: Ethnicity, Gender, First-Generation
      While UMS experienced decrease in its first-generation population, it has seen steady growth in its racial/ethnic makeup.
                        Fall 2017 Total Headcount by                           Fall 2017 Total Headcount by Gender
             White              Race/Ethnicity
                                                          3%    1%
                                                                                                0%
             Black/                                             1%
             African American
             Hispanic/
                                                      3%
                                                                0%
                                                                                                                                         Entering first-time and transfer
                                                                                                                                           First Generation Students                             • The population of
                                                                                                                                                    2018-2020
             Latino
             Asian                                             3%                                     41%                                                                                          Black/African American
                                                                                                                               45%
             American Indian/
                                                                3%
                                                                                         59%                                   44%
                                                                                                                                                                                                   and Hispanic/Latino has
             Alaska Native                                      5%
             Native Hawaiian/           81%                                                                                    43%                                                                 increased by 22% and
             Pacific Islander
             Non-Resident Alien                                                                                                42%                                                                 36%, respectively over
                                                                                                                               41%
             Two or More Races                                                     Men        Women     Unknown
                                                                                                                               40%
                                                                                                                                                                                                   the last 5 years.
                                                                                                                               39%
                       Fall 2021 Total Headcount by
            White              Race/Ethnicity                                  Fall 2021 Total Headcount by Gender             38%                                                               • First generation student
                                                                 4%                             1%                             37%
            Black/
                                                                2%                                                             36%
                                                                                                                                                                                                   numbers have declined
            African American                           3%
            Hispanic/                                           1%                                                             35%                                                                 8% over the same period,
            Latino                                                                                    40%                                Fall 2018         Fall 2019         Fall 2020
                                                               0%3%
            Asian                                                                                                                                                                                  mirroring a national
                                                                3%                                                                 Neither parent has a bachelor’s degree (all students)
            American Indian/
            Alaska Native                                       5%
                                                                                         59%
                                                                                                                                                                                                   trend.1
            Native Hawaiian/            79%                                                                                        Neither parent has a bachelor’s degree (full time students)
            Pacific Islander
            Non-Resident
            Alien
            Two or More                                                            Men        Women    Unknown
            Races

                         Implications for UMS: UMS must continue to engage and enroll its diverse populations, especially males, as females enroll at a higher rate.

Source: UMS Fall 2021 Enrollment Report, UMS First-Generation Report January 20201. 1. Numerous national studies have examined this issue and have come to the same conclusion (STRADA, NACE,©NASPA,  College
                                                                                                                                                                                               2021 Huron     Board,Group
                                                                                                                                                                                                          Consulting Common     Application,
                                                                                                                                                                                                                          Inc. and affiliates. etc.)
UMS Strategic Planning - Data Book Spring 2022 - University of Maine System
Enrollment      Academics       Economics          Research      Financial
                                                                                                                                                                                     HURON I 9

     UMS Enrollment Trends: In-state and Out-of-state
     In the last five years, UMS experienced a decline in total Fall Headcount. UMS was able to grow its proportion of out-of-state students,
     however, that growth did not compensate for the loss of in-state students enrolling.

                                                                UMS Fall FTE Enrollment 2015-2020
                                                                                                                                                                   5-year % 5-year Net
                                                                                                                                              Residency
       20,000                                                                                                                                                      Change    Change

       15,000
                                                                                                                                                 UMS
                                                                                                                                                                      37.0%                   1,575
                                                                                                                                              Out-of-State
       10,000

                                                                                                                                                  UMS
                                                                                                                                                                     -12.4%                  -2,091
        5,000                                                                                                                                   In-State

             0
                          2015                      2016                     2017                2018             2019                 2020   UMS Total               -2.4%                    -516
                                      In-State              Out-of-State/Other       Linear (In-State)   Linear (Out-of-State/Other)

         Implications for UMS: UMS supplemented its enrollment population with out-of-state residents as the population of high school graduates in Maine declined.
              Understanding that out of state students have tuition revenue benefits, UMS will need to balance that benefit with the objective of serving the state.

Source: UMS Institutional Data (Fall FTE Enrollment)                                                                                              © 2021 Huron Consulting Group Inc. and affiliates.
UMS Strategic Planning - Data Book Spring 2022 - University of Maine System
Enrollment      Academics        Economics          Research       Financial
                                                                                                                                                                                                                 HURON I 10

     UMS Enrollment: Residential, Commuter, Online
     A point in time comparison between 2019 and 2021 reveals a 60.8% increase in students living off campus and taking their courses fully
     online, an increase largely caused by the pandemic.

        UMS Students by Residency and                                                                                                     Further analysis of representative student profiles across
                                                                              UMS Students by Residency and
                Modality, 2019                                                        Modality, 2021                                      three sample universities (UMA, UMF and UM) illustrates
           (excludes Early College)                                              (excludes Early College)                                 the varied and distinct populations served by
                                                                                                                                          institutions in the System.

                                                                                                                                          100%         UMA, UMF, UM Students by Residency and Modality, 2021
                                                                                                 5,492,                                    90%                       (excludes Early College)
                             6,038,
                                                                                                 21.0%                                     80%
                             22.9%                                                                                                                                                       71.8%
                                                                                                                                           70%

                                                     Resident                                                          Resident            60%                                                                                 55.1%
                                                                             13,142,                                                                                 45.6%
                                    4,585,           Fully Online                                                      Fully Online        50%       42.0%
       15,784,                                                                50.3%                 7,477,
                                    17.4%                                                                                                  40%
        59.8%                                        Commuter*                                                         Commuter*                                                                               29.5%
                                                                                                    28.6%                                  30%                                                   26.0%

                                                                                                                                           20%                                                                         15.4%
                                                                                                                                                             12.4%
                                                                                                                                           10%                                    2.2%
                                                                                                                                            0%
                                                                                                                                                             UMF                         UMA                            UM

                                                                                                                                                                       Resident   Fully Online      Commuter
*Indicates students taking both online and in-person courses.          *Indicates students taking both online and in-person courses.

    Implications for UMS: Students are utilizing the increased availability of distance modalities. UMS has an opportunity to capitalize on its distance and online learning
                             infrastructures in order to increase its reach and prioritize how students want to earn their credential or degree.
Source: UMS Students by Institution, Level, Degree-Seeking Status, Campus-Living Status, and Online Course load Status (Fall 2019 vs. Fall 2021). Note: Data includes both full-time©and part-time as well as degree-seeking and non-
                                                                                                                                                                                     2021 Huron Consulting Group Inc. and affiliates.
degree seeking students.
Enrollment         Academics     Economics         Research       Financial
                                                                                                                                                                                                                 HURON I 11

         Adult Learner Opportunity
         In Maine, an estimated 190k of adults have some college but no degree. The state set an attainment goal of 60% of adults earning a
         significant credential or postsecondary degree by 2025, UMS must access this market more effectively to meet this goal.

                                                                Educational Attainment by Level, 2018
                                                                                                                                                                  In the most recent year that
                         US    5%     7%                  27%                             21%               8%           19%            12%                       data was collected (2018), the
                                                                                                                                                                  headcount of adults who have
                  Maine       3% 5%                      32%                              20%           10%              20%             11%                      some college or less in the
              Portland-
                                                                                                                                                                  state, UMS enrolled 9,270 or
                              2%4%              26%                        19%                  10%                25%                  15%
               Metro                                                                                                                                              1.7%, indicating an
          Central Mid-                                                                                                                                            opportunity in the market for
             Coast            3% 5%                      34%                               21%               10%            17%          10%
                                                                                                                                                                  adult learners as well as an
               Northern
                              4%     7%                         40%                                   20%           11%           13%         6%
                                                                                                                                                                  opportunity to advance an
                Maine
                                                                                                                                                                  important State goal.
                          0%                     20%                      40%                         60%                   80%                100%
                                      Less Than 9th Grade             9th Grade to 12th Grade           High School Diploma                                       *Note: The 2018 headcount of 9,270 students
                                      Some College                    Associate's Degree                Bachelor's Degree                                         is equal to 5,214 FTE.
                                      Graduate Degree and Higher

    Implications for UMS: There is an opportunity to increase UMS’ adult learner population in support of statewide attainment goals, community goals, and workforce needs.

Source: EMSI, U.S. Census Bureau​, MaineSpark. Adult Degree Completion Report, UMS 2018, UMS Institutional Data. Note: Adult learners are classified as 25 years and older.     © 2021 Huron Consulting Group Inc. and affiliates.
Enrollment      Academics           Economics          Research      Financial
                                                                                                                                                                                                                                          HURON I 12

           UMS Adult Learners: Enrollment and Degree Type
           During the fall 2018 semester, a majority of adult students were enrolled in baccalaureate degree programs. When combined with those in
           Associate and non-degree undergraduates, 63% of the UMS 25+ population is pursuing an undergraduate education. Between 2014-2018,
           there was a net decline in adult FTE by 1,350, or 12.7%.
                 UMS Fall FTE Enrollment 2014-2018 By Age                                                                 Enrollment by Program Fall 2018
                                                                                                                                                                                         Radford defines the nontraditional
     35,000
                                                                                                                                                                                         student as having one or more of the
                                                                                                                                                                    3%                   following characteristics:
     30,000                                                                                                                                                        (310)
                                                                                                                                                      9%                                 ✓       Over the age of 25
                                                                                                                    Associate                        (862)
                                                                                                                                         8%
     25,000
                                                                                                                                        (696)
                                                                                                                                                                                         ✓       Financially independent from their
                                                                                                                    Baccalaureate                                                                parents
     20,000         64.1%          66.0%            67.2%                         68.7%
                                                                      68.0%                                                                                                              ✓       Having a child or other dependent
                                                                                                                    Law

     15,000                                                                                                                                                           51%                ✓       Being a single care giver
                                                                                                                    Masters &
                                                                                                                                                                    (4,683)
                                                                                                                    Doctorate
                                                                                                                                                                                         ✓       Delaying postsecondary enrollment
     10,000                                                                                                         Non-Degree
                                                                                                                    Graduate
                                                                                                                                                                                         ✓       Attending school part time
                                                                                                                    Non-Degree         27%
       5,000        35.9%          34.0%             32.8%                                                                            (2,547)
                                                                      32.0%       31.3%                             Undergrad
                                                                                                                                                    2%                                   ✓       Being employed full-time
                                                                                                                                                   (172)
           0                                                                                                                                                                             ✓       Lacking a traditional high school
                   Fall 2014     Fall 2015         Fall 2016      Fall 2017      Fall 2018                                                                                                       diploma
                                     25 or older       Less than 25

           Implications for UMS: UMS should build capacity and wrap around services for the complex needs of adult learners in order to increase market share to support
                                                     statewide attainment goals, community goals, and workforce needs.
                                                                                                                                                                                                         © 2021 Huron Consulting Group Inc. and affiliates.
Source: UMS Institutional Data (Fall FTE Enrollment), Adult Enrollment and Degree Completion Report March 2019, Radford, A. W., Cominole, M., Skomsvold, P. (2015). Demographic and enrollment characteristics of nontraditional undergraduates: 2011-12.
Enrollment    Academics        Economics      Research         Financial
                                                                                                                                                                                                                            HURON I 13

          UMS Adult Learners: Undergraduate Degrees
          63% of all adult learners are undergraduates (e.g. pursuing an Associate, Bachelors, or undergraduate classes under a non-degree designation).

              Fall Adult Undergraduate Degree Students by Degree                                                    Fall 2018 Adult Undergraduate Students,
                              Type, Campus 2018                                                                              Top 10 Academic Plans
       2500                                                                                                 32, 1%         19, 1%
                                                                                                                                                           Liberal Studies
                                                                                                         102, 5%                   12, 1%
                                                                                                                                                           Nursing
       2000                                                                                        132, 6%                                                                                       Across the System, there
                                                                                                                                                           Mental Health & Human Srvcs           are a variety of programs
                                                                                                                                                                                                 and locations that engage
                                                                                                                                             548, 24%      Business
       1500                                                                                            146, 6%                                                                                   adult learners. UMA,
                                                                                                                                                                                                 including its Centers & Sites,
                                                                                                                                                           Management
                                                                                                   161, 7%                                                                                       UMPI YourPace, and the UM
       1000                                                                                                                                                Biology                               Division of Lifelong Learning
                                                                                                                                                                                                 all offer different modalities
                                                                                                     303, 13%                                   440, 19%   Accounting                            and locations enabling the
        500                                                                                                                                                                                      adult learner to engage with
                                                                                                                                                           Applied Science                       their program at a pace and
                                                                                                                                                                                                 mode that best fits their
                                                                                                                        398, 17%                           Education, Public Admin, Library
          0                                                                                                                                                Science, CIS                          lifestyle and academic goals.
                  UMA      USM          UM       UMFK     UMPI         UMM       UMF                                                                       Medical Lab. Tech/PT Assisant

                               Associate     Bachelors   Non-Degree
                                                                                              Note: Category of “other academic plans” not represented.

          Implications for UMS: UMS should leverage its universities and centers with expertise in educating adult learners to increase market share and support statewide
                                                                         attainment and workforce goals.

Source: Adult Degree Completion Report, UMS 2018, UMS Institutional Data. Note: Adult learners are classified as 25 years and older.                                                       © 2021 Huron Consulting Group Inc. and affiliates.
Enrollment     Academics          Economics            Research         Financial
                                                                                                                                                                                                                         HURON I 14

          Student Success: National, Northeast & Maine Outcomes
          When compared to the national average for public four-year universities, the UMS System has an opportunity to increase student
          completion across all age groups. Data includes the most recent year reported.
                                                                 State Level Six-Year Completion Rate Trends by Age, Entering Cohort Year 2015,
                                                                             First-Time Undergraduates (no prior degree or certificate)
                                    National                                                                                  Maine                                                               Combined Average (MA, NH, VT)
                                Public Four-Year                                                                         Public Four-Year                                                               Public Four-year
100.0                                                                                   100.0                                                                          100.0

                                                                                                                                                                                                77.8        79.2        78.4         78.9
 80.0                                                                                    80.0                                                                           80.0      73.9
                         68.7          69.4               69.6           70.4
           67.7                                                                                                                                                                                 79.8                    79.9         80.4
                                                                                                                                                                                  78.4                        66.3
                                                          68.0            69.0                                   61.7           62.3           61.0             62.5
                                       67.7                                                        58.9                                                                          60.1             69.1                  57.7         56.7
                         65.7
 60.0      64.7                                             59.8             61.6        60.0                                                                           60.0
                                         59.3
                                                                         57.7                                                   58.5           57.8             59.2
                                                          54.8                                                   56.5                                                                                                   56.4
                                         52.4                                                      54.0                                                                           53.7                                               53.6
           49.6          50.4                                                                                                                  37.6                                              48.3       47.5
 40.0                                                                                    40.0      33.0          35.2                                                   40.0
                                                                                                                                30.4                            31.4

                                                                                                   32.1          31.2           31.3           33.4
 20.0                                                                                    20.0
                                                                                                                                                                29.3    20.0

  0.0                                                                                      0.0                                                                           0.0
           2011          2012          2013               2014           2015                      2011         2012            2013           2014             2015              2011          2012        2013        2014         2015

                                                                 All                  20 and Younger (Traditional Age)                 >20-24 (Delayed entry)          Older than 24 (Adult Learners)

        Implications for UMS: Across all age groups, the national six-year average completion rate was 69%, for the Northeast it was 61.3% and for Maine it was
                      59.2%. There is opportunity for UMS to improve completion rates across all age groups, both for student and financial benefit.
  Source: “Completing College National and State Reports”, NCES. Note: Data includes six-year college completion rates by tracking the enrollment and completion outcomes for the fall© 2015  cohort
                                                                                                                                                                                        2021 Huron   of first-time
                                                                                                                                                                                                   Consulting Groupundergraduates
                                                                                                                                                                                                                    Inc. and affiliates.
  only and their age at entry.
Enrollment        Academics         Economics            Research           Financial
                                                                                                                                                                                                                                                   HURON I 15

   Student Completion Demographics
   Women earned 61.8% of all degrees and certificates in 2019-20 and across all award levels and universities. Women are completing at a slightly
   higher rate than men when compared to their enrollment ratios. 83% of all awards were conferred to white students, slightly higher than the ratio of
   enrolled white students. 10.2% of all awards were conferred to racial/ethnic minorities with 2.2% and 4.3% conferred to non-resident aliens and
   unknown race/ethnicity, respectively. Of note, adult learners complete their degrees at a third of the rate of their under 20 peers.
                                 Total Completions by Campus & Gender 2019-20                                                                      Total Completions by Campus & Race Ethnicity 2019-20
                                                                                                        100%
        100%
                    53.2%                                                               65.9%   64.6%   50%
                                  71.0%         70.2%       78.0%         77.7%
         50%
                    46.8%                                                                                0%
                                  29.0%         29.8%                     22.3%         34.1%   35.4%                    UM                 UMA                UMF                 UMFK                   UMM               UMPI                 USM
                                                            22.0%
           0%
                     UM           UMA           UMF         UMFK          UMM           UMPI     USM       American Indian or Alaska Native                   Asian                                               Black or African American
                                                                                                           Hispanic or Latino                                 Native Hawaiian or Other Pacific Islander           White
                                                    Men        Women                                       Two or more races                                  Nonresident Alien                                   Unknown

                                                                                                                                                  Total Completions by Award & Race Ethnicity 2019-20
                             Total Completions by Award Level & Gender 2019-20
                                                                                                        100%
        100%

                                    63.5%           59.1%                           56.0%       52.5%
                     71.7%                                           70.8%                              50%
         50%

                                    36.5%           40.9%                           44.0%       47.5%    0%
                     28.3%                                           29.2%
           0%                                                                                                         Certificate             Associate's             Bachelor's             Master's                Doctoral                    Law
                   Certificate    Associate's     Bachelor's        Master's       Doctoral     Law
                                                                                                               American Indian or Alaska Native                 Asian                                                Black or African American
                                                                                                               Hispanic or Latino                               Native Hawaiian or Other Pacific Islander            White
                                                    Men        Women                                           Two or more races                                Nonresident Alien                                    Unknown

 Implications for UMS: UMS must focus on retention, persistence, and completion across all demographic groups. Some groups, like males or non-white
                           students, require more tailored support to succeed at rates comparable to other peer groups.
                                                                                                                                                                                                                © 2021 Huron Consulting Group Inc. and affiliates.
Source: UMS 2019-2020 Completions Report; Adult Enrollment And Degree Completion , March 2019
Enrollment      Academics      Economics       Research        Financial
                                                                                                                                                                                                         HURON I 16

     Student Success: Community College Transfer Students
     The Maine Community College System (MCCS) falls below the national average of 30.8% community college of students who transfer out
     of the community college to a four-year institution, averaging 20% over the last 4 years across the System.
                     4-year average of first-time, full-time degree or certificate-seeking students who enrolled
                                                  at another institution after MCCS                                                                •    In Fall 2020, of the MCCS students who
       35.0%
                                                                                                                                                        continued their education, 641 graduates
                                                                                                                                                        enrolled at a UMS university. In fall
       30.0%
                     26.3%                                                                                                                              2020, 15,890 students were enrolled in
                                      25.5%
       25.0%
                                                                                                                                                        credit courses.
                                                         22.3%              21.8%

       20.0%                                                                                                                                       •    Articulation agreements have been
                                                                                             18.0%
                                                                                                                                                        identified as one of the biggest
                                                                                                                 15.0%
       15.0%                                                                                                                     14.0%                  improvements to increase the ease of
                                                                                                                                                        transitions for students.1 The Block
       10.0%                                                                                                                                            Transfer agreement between UMS and
                                                                                                                                                        MCCS is a high value tool established to
        5.0%                                                                                                                                            increase the pipeline of transfer students
                                                                                                                                                        between systems, a direct result of the
        0.0%
                                                                                                                                                        Public Higher Education Systems
                     SMCC              YMCC              EMCC               CMCC             KVCC                NMCC            WCCC
                                                                                                                                                        Coordinating Committee.
                                            Transfer Out %         National benchmark %         MCCS Average %

  Implications for UMS: UMS and MCCS should leverage their existing partnership by refining articulation agreements in parallel with the Unified Catalog to
                        enhance transfer pathways and increase the number of transfer students from an MCCS institution to UMS.
Source: 1.Tracking Transfer: Measures of Effectiveness in Helping Community College Students to Complete Bachelor’s Degrees Report and 2021 Data Update; MCCS 2021-2022 Fact Sheet,
                                                                                                                                                                         © 2021 Huron2021 UMSGroup
                                                                                                                                                                                      Consulting Transfers  Report,
                                                                                                                                                                                                     Inc. and          IPEDS
                                                                                                                                                                                                              affiliates.
Enrollment     Academics      Economics      Research       Financial
                                                                                                                                                                      HURON I 17

     Student Migration Post-Graduation
     Nationwide, state university graduates generally stay within state lines with an average distance of 330 miles from their alma mater, and
     40% are within 50 miles of the university. As a state, Maine retains between 30-40% of its postsecondary graduates (which includes in-state
     and out-of-state students).
                                     Average Migration Distances by Type of School, 2008-2018

                                                                                                                •     On average, a student who attends a
                                                                                                                      community college will stay within
                                                                                                                      300 miles of the college and 61% live
                                                                                                                      within 50 miles of the college.

                                                                                                                    • Graduates of elite schools flock to big
                                                                                                                      cities and tend to move nearly 700
                                                                                                                      miles away from their universities.
                                                                                                                      Nearly 40% are over 500 miles from
                                                                                                                      the university.

                                                                                                                •     Graduates of schools with large (or
                                                                                                                      fully) online offerings live all over the
                                                                                                                      U.S., and over 60% are more than
                                                                                                                      500 miles away from their university's
                                                                                                                      central location.

     Implications for UMS: UMS has the opportunity to reduce “brain drain” through continued economic and workforce development initiatives particularly
                                                                 through R&D initiatives.
                                                                                                                                     © 2021 Huron Consulting Group Inc. and affiliates.
Source: How Your School Affects Where You Live, EMSI; EMSI Analysis of Resumes and Social Profiles, 2008-2018
Enrollment     Academics   Economics    Research      Financial
                                                                                                                                                                                          HURON I 18

     Academic Portfolio: Bachelor Degree Programs
     Bachelor degree enrollment in programs like Humanities, Business, Social Sciences, Health professions, and Physical Sciences hold the
     largest share of enrollments across UMS. The balance of liberal arts and technical degree offerings position UMS to adapt to future market
     demands.
                                                                          Bachelor Degree Enrollment by Program, 5-year average
           5000                                                                                                                                                                            15.0%
                                                                                                                                       12.1%
           4500
                                                                                                                                                                                           10.0%
           4000
                                                                                                                                                                                           5.0%
           3500                                        1.5%
                                       -0.1%
                                                                                                                                                                          -1.4%            0.0%
           3000                                                                            -3.0%           -3.6%              -3.6%
                                                                           -5.6%
           2500                                                                                                                                                                            -5.0%
                                                                                                                                                      -9.6%
           2000
                                                                                                                                                                                           -10.0%
           1500
                                                                                                                                                                                           -15.0%
           1000        -19.3%
                                                                                                                                                                                           -20.0%
            500

               0                                                                                                                                                                           -25.0%
                     Humanities      Business    Social Sciences        Health       Physical Sciences   Engineering      Education   Computer   Communications            Arts
                                                                      Professions                                                     Sciences

                                                                                      5 year average        5 year % change

 Implications for UMS: UMS offers a comprehensive academic portfolio to serve its students. The System will need to both underpin foundational areas like
               humanities and capitalize on areas of growth like computer science to meet workforce and state economic development needs.
                                                                                                                                                         © 2021 Huron Consulting Group Inc. and affiliates.
Source: UMS Institutional Data
Enrollment     Academics       Economics         Research         Financial
                                                                                                                                                                                                                    HURON I 19

      Academic Portfolio: Graduate Degree Programs
      Graduate degree enrollment in programs like Education, Social Sciences, Physical Science, Business and Health Professions
      hold the largest share of enrollments across UMS. The balance of liberal arts and technical degree offerings position UMS to
      adapt to future market demands.
                                                                                        Graduate Degree Enrollment by Program, 5-year average
           1400                                                                                                                                                                                                       160%
                                                                                                                                                                          147.2%
                                                                                                                                                                                                                      140%
           1200
                                                                                                                           121.6%                                                                                     120%
           1000
                                                                                                                                                                                                                      100%

            800                                                                                                                                                                                                       80%
                                              69.2%
            600                                                                                                                                                                                                       60%

                                                                                                                                                                                                                      40%
            400             31.1%
                                                                                                                                                                                                                      20%
                                                                 12.0%                 13.2%                                                                                              15.2%
            200                                                                                       2.2%                                    2.8%                                                          4.8%
                                                                                                                                                            -0.6%                                                     0%

               0                                                                                                                                                                                                      -20%
                      Education      Social Sciences   Physical Sciences      Health           Humanities            Business            Legal       Engineering    Computer       Arts           Communications
                                                                                                                                                                     Sciences

                                                                                                       5 year avg.              5 year % Change

 Implications for UMS: UMS has a broad portfolio of academic offerings with significant growth in business and computer science. UMS will need to leverage
                        their academic offerings and recent R1 status at UM to prepare its students for future workforce demands.

Source: UMS Institutional Data. Note: Architecture included under engineering.                                                                                                     © 2021 Huron Consulting Group Inc. and affiliates.
Enrollment     Academics        Economics     Research        Financial
                                                                                                                                                                                                                 HURON I 20

   UMS Degree: Cost per Credit Hour
   In FY2020, across the University of Maine System, the average cost to deliver a credit hour was $1,821.81.

                                                  5-year average institutional cost per credit hour FY2016-2020 (includes Early College)
         $3,000
                          $2,720.56

         $2,500

                                                     $1,996.81
         $2,000                                                                  $1,912.39                  $1,888.40

                                                                                                                                        $1,542.19
         $1,500                                                                                                                                                     $1,419.48
                                                                                                                                                                                                    $1,272.84

         $1,000

          $500

              $-
                             UM                      USM/Law                       UMM                         UMF                        UMPI                        UMA                            UMFK

     Note: These calculations show a high-level, aggregate view. Further internal analysis should be conducted to gain a more nuanced understanding as costs often vary widely by program.

   Implications for UMS: To continue to deliver on its mission of affordability, UMS must leverage its system-wide resources to deliver its academic portfolio in a cost-
                                                                                effective way.
                                                                                                                                                                                © 2021 Huron Consulting Group Inc. and affiliates.
Source: IPEDS, UMS Fall 2020 Enrollment Report. Note: Maine Law and USM are combined due to their financial structure. Note: Methodology used total expenses divided by total credit hours per campus.
Enrollment       Academics   Economics     Research          Financial
                                                                                                                                                                                                        HURON I 21

     Maine Current and Future Industries
     In 2020, Maine’s Real Gross Domestic Product (RGDP) was $57.7 billion, down from $59.4 in 2019 in part due to the COVID-19
     pandemic as consumers cut back spending and businesses cut back investments. UMS contributes $1.5 billion annually to the state
     economy.
                           Current Industries in Maine                                                                                Future Industries in Maine
                       Top 5 industries in full state in 2021:
                     Healthcare, Government, Retail, Tourism,                                  The Maine Economic Development Strategy 2020-2029 outlines a
                                  Manufacturing                                                plan to leverage intersections of established industries and emerging
                                                                                               technologies to transform the state’s assets into quality jobs. Priorities
                               Regional Breakdown:                                             include:
                                                              Northern Maine
                                                              Holds a strong footprint in
                                                                                               •     Bio-based alternatives including fuels and building materials
Greater Portland-Metro                                        manufacturing, forestry &        •     Climate change solutions focused on green energy sources
Leads with industries in                                      logging.                         •     Responsible food sources and technologies such as
tourism, healthcare,
professional services, and
                                                                                                     aquaculture1
boasts unique industries                                                                       •     Artificial Intelligence (AI) growth and data center management
like shipbuilding.                                                                             •     ConnectMaine will facilitate the universal availability of
                                                   Central Mid-coast region
                                                   Driven by industries in                           broadband to all Maine households and businesses by 2025.
                                                   tourism, healthcare, and a
                                                   high concentration of fishing
                                                   and agricultural industries.
                                                                                               In addition, the next slide forecasts Maine’s 10 largest industries
                                                                                               and forecasted job growth in 2030.

      Implications for UMS: Maine plans to address their economic development with new talent, engaging workers not currently in the labor pool, and by investment in
                       knowledge and skill development across varied populations. UMS should prepare to meet the demand for new workforce skills.
                                                                                                                                                                       © 2021 Huron Consulting Group Inc. and affiliates.
Source: 1. Maine Economic Development Strategy, 2020-2029; EMSI; FRED Economic Data. https://www.maine.edu/governmental-affairs/wp-content/uploads/sites/29/2019/11/UMSEconomicImpactInfographic.pdf
Enrollment          Academics        Economics    Research      Financial
                                                                                                                                                                                        HURON I 22

     Maine’s Future Industries and Economic Outlook
     Between 2021-2030, job growth in Maine is forecasted to be flat at .2%, growing modestly from 692,835 to 694,020 total jobs. Compared to
     national job growth projected at 6.7% over the same period, Maine’s projected job growth lags significantly.

                                                                10 Largest Maine Industries and Forecasted Jobs by 2030                             • Retirement risk is high in Maine-
                     120,000
                                                                                                                      9%
                                                                                                                                            10%     the national average of the
                     100,000
                                                                                                                                                    population ready to retire for an
                                                                                                                           5%               5%
                                           4%                                                                                   4%                  area of this size is 401,837 people
      Jobs in 2030

                      80,000                                                              2%                                                        55 or older. In Maine, there are
                                                                                                                                            0%
                      60,000                                                 (2%)
                                                                                                          (1%)                                      504,250
                                                      (5%)                                                                           (5%)   (5%)
                      40,000                                                                                                                        •The flow of new workers is low-
                                                                                                                                            (10%)   Maine has 244,824 millennials
                      20,000                                     (11%)
                                                                                                                                                    (ages 25-39). The national average
                          0                                                                                                                 (15%)   for an area this size is 278,228

                                                                                                                                                    • Flat job growth, a high volume of
                                                                                                                                                    retirements, and a lower volume of
                                                                                                                                                    workers to replace those jobs
                                                                                                                                                    creates a gap that UMS is uniquely
                                                                                                                                                    positioned to address
                                                                            2030 Jobs          2021 - 2030 % Change

 Implications for UMS: UMS can shape Maine’s future economy by investing in initiatives to drive new job and industry growth while producing a credentialed workforce to
                                                                       meet those needs.
                                                                                                                                                       © 2021 Huron Consulting Group Inc. and affiliates.
Source: EMSI
Enrollment       Academics        Economics        Research         Financial
                                                                                                                                                                                                                HURON I 23

  Occupations in Maine: Bachelor’s Degrees
  Overall, employment is projected to grow 3% from 2022-2026 for occupations requiring a Bachelor’s degree and less than five years of
  experience in Maine. Management Analysts (depicted in light blue) make up one of the largest and fastest growing occupations.
                                  5 Largest Occupations in Maine,                                                  Fastest Growing/Declining Occupations in Maine, % Employment
                                    # of Jobs Projected in 2026*                                                                 Change Projected from 2022-2026*
             11,609
                                                                                                                                  Information Security Analysts                                                               12%
                                   5,438
                                                     2,965                2,860          2,558
                                                                                                                       Medical and Health Services Managers                                                         7%

          General and      Personal Service        Management           Financial     Medical and      Education and Childcare Administrators, Preschool and
                                                                                                                                                                                                                  7%
          Operations          Managers              Analysts            Managers     Health Services                         Daycare
           Managers                                                                    Managers
                                                                                                                                          Management Analysts                                                     7%
   *Note: Occupations requiring a Bachelor’s degree and < 5 years experience.
                                                                                                                                             Financial Managers                                                5%
            Occupation                                             Relevant Skills
                                                                                                                        Advertising and Promotions Managers                         -2%
  General and Operations…                     Critical Thinking, Speaking, Social Perceptiveness
                                                                                                                            Emergency Management Directors                       (3%)
  Personal Service Managers                   Time Management, Reading Comprehension
                                                                                                        Agents and Business Managers of Artists, Performers,
                                                                                                                                                                                  -3%
                                                                                                                           and Athletes
  Management Analysts                         Decision Making, Critical Thinking, Analysis
                                                                                                                                                          Editors        -6%
  Financial Managers                          Speaking, Active Listening, Social Perceptiveness
                                                                                                                                    Labor Relations Specialists          -7%
  Medical and Health Serv…                    Critical Thinking, Decision Making                          *Note: Occupations requiring a Bachelor’s degree and < 5 years experience.

  Implications for UMS: Occupations forecasted to grow in the state requiring bachelor’s degree will require a mix of skills. UMS has the opportunity to
                             leverage its academic portfolio to prepare students for successful entry into the workforce.
                                                                                                                                                                               © 2021 Huron Consulting Group Inc. and affiliates.
Source: EMSI; O*NET Online. Note: Data is in line with projections from Maine Center for Workforce Research and Information (CWRI).
Enrollment        Academics          Economics          Research           Financial
                                                                                                                                                                                                                                HURON I 24

  Occupations in Maine: Graduate Degrees
  Overall, employment is projected to grow 1.63% from 2022-2026 for occupations requiring a Graduate degree (Master’s, Doctoral, or
  Professional) and less than five years of experience. Mental Health workers (depicted in light blue) make up one of the larger and fastest
  growing occupations.
                                     5 Largest Occupations in Maine,                                                            Fastest Growing/Declining Occupations in Maine, % Employment
                                       # of Jobs Projected in 2026*                                                                           Change Projected from 2022-2026*
             7,431

                                                                                                                              Marriage and Family Therapists                                                                         15%
                                     2,590                    2,277
                                                                                      1,471         1,408                           Orthotists and Prosthetists                                                         10%

                                                                                                                           Mental Health and Social Workers                                                  5%
        Postsecondary               Lawyers             Physicians, All          Educational   Mental Health and
          Teachers                                          Other                Counselors     Social Workers
                                                                                                                                                    Veterinarians                                            5%

    Note: Occupations requiring a graduate degree and >5 years of experience.
                                                                                                                                       Psychologists, All Other                                             5%

            Occupation                                                   Relevant Skills                                              Pediatricians, General                         (2%)

  Postsecondary Teachers                        Instructing, Writing, Active Learning                                     Obstetricians and Gynecologists                          (3%)

  Lawyers                                       Critical Thinking, Persuasion, Speaking                               Surgeons, Except Ophthalmologists                           (3%)

  Physicians, All Others                        Reading Comprehension, Active Learning                                                            Pharmacists                     (4%)

  Educational Counselors                        Social Perceptiveness, Active Listening                                                      Farm Management          (8%)

  Mental Health and Social                      Active Listening, Monitoring, Social Perceptiveness                Note: Occupations requiring a graduate degree and >5 years of experience.

Implications for UMS: Occupations forecasted to grow in the state requiring a graduate degree will require subject matter expertise and professional skills.
                  UMS has the opportunity to leverage its academic and research portfolio to prepare students for professional careers.
                                                                                                                                                                                               © 2021 Huron Consulting Group Inc. and affiliates.
Source: EMSI; O*NET Online. Note: Data is in line with projections from Maine Center for Workforce Research and Information (CWRI).
Enrollment     Academics           Economics      Research          Financial
                                                                                                                                                                                                                HURON I 25

  Occupations in Maine: Postsecondary Non-Degrees
  Overall, employment is projected to decline 1.03% from 2022-2026 for occupations requiring a post-secondary non-degree and less than
  five years of experience. Computer Support Technicians (depicted in light blue) make up one of the larger and fastest growing occupations.
                                 5 Largest Occupations In Maine,                                                    Fastest Growing/Declining Occupations in Maine, % Employment
                                    # of jobs projected in 2026*                                                                  Change Projected from 2022-2026*
          7,511

                                4,420                                                                                    Wind Turbine Service Technicians                                                                    23%
                                                     2,489
                                                                             835          761          Computer Numerically Controlled Tool Programmers                                                           15%

                                                                                                                               Audio and Video Technicians                                                 10%
       Teaching       Medical Assistants Computer User                   Psychiatric    Massage
   Assistants, Except                   Support Specialists              Technicians   Therapists
    Postsecondary                                                                                                                       Massage Therapists                                                 9%

       *Note: Occupations requiring a post-secondary non-degree award.
                                                                                                                           Ophthalmic Medical Technicians                                             6%

             Occupation                                           Relevant Skills                                                        Library Technicians                  (6%)

  Teaching Assistants…                         Learning strategies, Social Perceptiveness
                                                                                                                                   Medical Transcriptionists                 (7%)

  Medical Assistants                           Speaking, Reading Comprehension, Monitoring                   Hairdressers, Hairstylists, and Cosmetologists                 (8%)

  Computer User Support…                       Active Listening, Critical Thinking, Instructing                         Prepress Technicians and Workers                    (9%)

  Psychiatric Technicians                      Social Perceptiveness, Active Listening                                                          Order Clerks      (14%)

  Massage Therapists                           Speaking, Active Learning, Service Orientation             *Note: Occupations requiring a post-secondary non-degree award.

   Implications for UMS: Occupations forecasted to grow in the state requiring postsecondary non-degrees will require varied skills, most of which are
                   technical. UMS has the opportunity to develop its academic portfolio to meet the needs of these workforce sectors.
                                                                                                                                                                              © 2021 Huron Consulting Group Inc. and affiliates.
Source: EMSI; O*NET Online. Note: Data is in line with projections from Maine Center for Workforce Research and Information (CWRI).
Enrollment       Academics   Economics      Research   Financial
                                                                                                                                                                          HURON I 26

   Median Household Income by County
   In 2019, the median household income in Maine was $57.9k, $4.9K below the national median household income of $62.8K. On average,
   the Cost of Living Index is 116.7 for Maine, indicating that Maine has a higher cost of living compared to the national average of 100.
                                                                                                                             Median
                                                                                                                                        Cost of Living             Population by
                                                                                                       County Name          Household
                                                                                                                                        (COL) Index                  County
                                                                                                                          Income (2019)

                                                                                                    Cumberland           $73,072        123.4                    292,307
                                                                                                    York County          $67,830        119.1                    204,316
                                                                                                    Sagadahoc            $63,694        123.2                    35,452
                                                                                                    Knox County          $57,751        120.5                    39,759
                                                                                                    Lincoln              $57,720        119.8                    34,201
                                                                               UMS Universities     Hancock              $57,178        120.3                    54,601
                                                                                                    Kennebec             $55,365        116.6                    121,753
                                                                                                    Androscoggin         $53,509        114.7                    107,602
                                                                                                    Waldo County         $51,931        115.6                    39,539
                                                                                                    Franklin             $51,422        114.8                    29,982
                                                                                                    Penobscot County     $50,808        113.4                    151,774
                                                                                                    Oxford               $49,204        113.1                    57,550
               $53.5                              $57.8
                                                                                                    Somerset             $44,256        111.7                    50,520
                                          $57.7
                                                                                                    Washington           $41,347        114.2                    31,491
                                    $63.6
                                                                                                    Aroostook County     $41,123        112.8                    67,809
                                                                                                    Piscataquis County   $40,890        114.5                    16,836

      Implications for UMS: The varying in income levels across the state indicate that UMS will need to provide affordable options for Maine residents to access a
                                                                 postsecondary degree or credential.
                                                                                                                                         © 2021 Huron Consulting Group Inc. and affiliates.
Source: EMSI, American Community Survey
Enrollment        Academics      Economics         Research         Financial
                                                                                                                                                                                                    HURON I 27

   UMS Degree: Return on Investment
   UMS universities offer a fair ROI based on their 40-year Net Present Value ranging between $582K-$1.34M which aligns with the median
   NPV for public college bachelor degrees of $765,000. The private college median NPV is $838,000 and median NPV for New England
   public flagships is $1,058,000.
                       Note: Maine Law included with USM. *UMFK, UMM list 2019 values as they were excluded from updated 2022 data.
                                                          % Earning                                                                                  •   Both the Maine Community College
                                            40-year Net  more than a                                                                       7-year
                                                                       Median 10-yr                                         Graduation                   System and Husson University deliver
                   Institution             Present Value high school                            Net price   Median debt                  repayment
                                                                        earnings                                               rate
                                               (NPV)    graduate after                                                                      rate         a higher ROI for students based on 40-
                                                           10 years
                                                                                                                                                         year NPV, than do UMPI, UMA, UMF,
   Maine Maritime Academy                    $1,571,000             85%               $72,837   $23,239       $24,250           73%        91%
                                                                                                                                                         UMFK, and UMM.
   Colby College                             $1,520,000             86%               $71,127   $17,777       $17,500           90%        94%

   Bowdoin College                           $1,404,000             82%               $66,864   $21,910       $14,000           95%        91%       •   Maine Maritime Academy delivers a
   Bates College                             $1,314,000             89%               $64,706   $29,321       $12,610           90%        93%           high ROI due to the nature of its STEM-
   University of Southern Maine              $1,054,000             75%               $49,223   $12,339       $13,000           40%        74%           focused programs.
   University of Maine                        $927,000              75%               $44,376   $17,558       $16,000           58%        81%
                                                                                                                                                     •   UMS Universities, after MCCS, are the
   Husson University                          $904,000              73%               $43,582   $18,286       $21,500           56%        65%
                                                                                                                                                         most affordable in the state with the
   MCCS (Median values)                       $789,500              56%               $32,810    $8,782        $7,625           28%        60%
                                                                                                                                                         lowest average net price at $13k;
   University of Maine at Presque Isle        $755,000              57%               $35,807   $10,637        $9,099           36%        64%
                                                                                                                                                         however, UMS graduation rates are well
   University of Maine at Augusta             $735,000              55%               $34,202   $10,631       $13,215           16%        48%           below the private institutions in the state
   University of Maine at Farmington          $734,000              56%               $35,051   $14,548       $16,756           55%        80%           suggesting UMS faces challenges with
   University of Maine Fort Kent*             $710,000              N/A               $33,400   $12,228       $12,500           35%        74%           student retention, persistence, and
   University of Maine Machias*               $582,000              N/A               $27,500    $9,317       $11,125           30%        68%           completion.

                                 Implications for UMS: To be remain competitive, UMS must maintain its affordability while increasing its ROI by focusing on
                                                           student outcomes including time to graduation and career placement.
                                                                                                                                                                   © 2021 Huron Consulting Group Inc. and affiliates.
Source: 1. Ranking 4,500 Colleges by ROI, Georgetown Center on Education and the Workforce.
Enrollment        Academics         Economics          Research           Financial                                                                                                                                                        HURON I 28

         UMS Research and Development Activity
         UMS has a strong research footprint and a successful record of securing funding.

                                            UMS R&D Activity FY19-FY21                                                               Largest Sources for UMS                                              FY21 Expenditure Amount
                        $160
                                                                                                       $1.689                  Federal (including pass through)                                                           $67.5M
            Thousands

                        $155
                                                                                                                               State Government-Maine                                                                     $22.1M
                        $150                                                                        $5.48
                                                                                                                               Private Non-Profit                                                                          $3.1M
                        $145
                                                                        $1.394
                                                                                                                               Miscellaneous (E&G)                                                                        $61.3M
                        $140               $0.994
                                                                     $5.64
                        $135                                                                                                                               Key National Trends in Research Funding
                                      $6.65
                        $130                                                                       $146.8                     •      The largest federal sponsors in FY21 were National Science Foundation, Dept. of
                                                                                                                                     Defense, Dept. of Agriculture, Dept. of Commerce, Dept. of Energy, and Dept. of
                        $125                                        $134.2                                                           Health and Human Services.
                                     $129.9
                        $120
                                                                                                                              •      Since 2000, federal funding as a percentage of university R&D has fallen from
                                                                                                                                     60% to below 45%, while corporate funding has risen from 20% to 30%.1 In 2021,
                        $115                                                                                                         UMS federal research activity comprised 58% of the research portfolio, well
                                     FY2019                         FY2020                         FY2021                            above the national benchmark. In the future, UMS may explore increased
                                                                                                                                     corporate funded research opportunities, to align with market trends.
                                           UM/UMM          USM       All Other Universities

      Implications for UMS: UM’s recent designation as an R1 institution will advance opportunities for new strategic partnerships and continue to augment the support of
                                                                                                            R&D activity across UMS universities.
Source: UMS Research Summary, 2021 Research Report University of Maine, UMS Research & Development Plan. Note: The UMS Research data was derived using a blended approach including NSF HERD and UMS SRECNP reports.© 1. www.axios.com,
                                                                                                                                                                                                                      2021              “The shift
                                                                                                                                                                                                                           Huron Consulting   Groupto private
                                                                                                                                                                                                                                                      Inc. andR&D  investment may
                                                                                                                                                                                                                                                               affiliates.
curtail innovation”.
Enrollment    Academics      Economics        Research     Financial
                                                                                                                                                             HURON I 29

   UMS Financial Health: Composite Financial Index
   The financial health of the University of Maine System can be evaluated using industry benchmarks and ratios. The following ratios and
   related benchmarks are derived from Strategic Financial Analysis for Higher Education.

                                                                            When the four ratios to the left are combined, they deliver a single measure
                                                   Primary                    of a university’s overall financial health, referred to as the Composite
             Viability Ratio
               Are financial
                                               Reserve Ratio                                            Financial Index (CFI).
                                                Are resources
           resources, including                                                                     FY11 FY12 FY13 FY14 FY15 FY16 FY17 FY18 FY19 FY20
                                                 sufficient and
             debt, managed
                                               flexible enough            University of Maine         4.1 3.3 2.7 2.4 2.3 2.6 2.1 2.5 2.2 2.4
              strategically to
                                                to support the            University Southern Maine   2.4 1.7 1.2     1 1.3 1.9 0.9 0.2 0.1 0.4
          advance the mission?
                                                   mission?
                                                                          UM Farmington               3.2 3.5 2.9 2.1 0.5 0.4 -0.5 -0.5 -0.4 -0.3
                                                                          UM Presque Isle             4.9 4.3 3.5 2.2 0.5 1.5 -0.7 -0.3 -0.1 -0.1
              Return on Net                    Net Operating              UM Augusta                    6 5.3 5.5 4.7 5.2 4.8 4.4 3.5 3.6 3.9
              Position Ratio                  Revenues Ratio              UM Fort Kent               -0.3 0.1 -0.5    2 -0.3 1.2 -0.1 1.4 0.2 2.6
                Does asset                  Do operating results
             performance and                                              UM Machias                 -0.4 -0.2 -0.4 0.4 1.6 1.4 1.6 0.3 -0.3 0.3
                                                indicate the
            mgmt. support the                institution is living        Total System                3.9 2.9 2.7     3 1.8 2.4 2.5       2 1.7 2.3
            strategic direction?              within available
                                                resources?                                Low Benchmark across Higher Education = 3.0
                                                                                          High Benchmark across Higher Education =10.0

Implications for UMS: Over the past 6 consecutive years, UMS has not achieved the “low benchmark” higher education threshold for financial sustainability.

Source: UMS Core Financial Index Ratio                                                                                      © 2021 Huron Consulting Group Inc. and affiliates.
Enrollment           Academics    Economics   Research       Financial
                                                                                                                                                                                                                        HURON I 30

 UMS Faculty and Staff Profile
 While enrollment has significantly declined across the System over the past decade, faculty and staff levels have remained largely the
 same. Over the past 10 years, total employee FTE has declined by 6%.

 2,500                                                                                                                                                                                                                   23,500
                                                                                      System Faculty & Staff FTE 2012-2021
                                                                                                                                                                                                                         23,000

 2,000
                                                                                                                                                                                                                         22,500

                                                                                                                                                                                                                         22,000
 1,500
                                                                                                                                                                                                                         21,500

                                                                                                                                                                                                                         21,000
 1,000
                                                                                                                                                                                                                         20,500

                                                                                                                                                                                                                         20,000
    500

                                                                                                                                                                                                                         19,500

       0                                                                                                                                                                                                                 19,000
               Fall                Fall           Fall                  Fall                Fall                  Fall                    Fall                Fall              Fall                     Fall
              2012                2013           2014                  2015                2016                  2017                    2018                2019              2020                     2021

                                                               Staff      Administrators   Faculty - Full-Time    Faculty - Part-Time*           Fall FTE Student Enrollment

Implications for UMS: In the future, UMS will need to align its faculty and staff levels with fluctuations in enrollment while and actively work to diversify its workforce to
                                                   build on system-wide diversity, equity, and inclusion initiatives.
                                                                                                                                                                                       © 2021 Huron Consulting Group Inc. and affiliates.
Source: UMS Campus Profiles. Note: Hourly FTE not depicted.
Enrollment       Academics           Economics      Research         Financial
                                                                                                                                                                                                                                HURON I 31

   Employee Demographics
   Employee demographics mimic the demographics of the state, except in non-white race/ethnicity where the UMS employee population is 10
   percentage points higher than state totals. The faculty and student populations mirror one another; however, UMS lags behind national campus
   demographic trends1.
                         Employees by Age Category 2020                               White             Race/Ethnicity All Employees 2020                                        Employees by Gender Category 2020
                                                                                                                                                      1.4%
    40%                                                                               Black/African American                                                                  0.1%               0.5%               0.0%             0.0%
                                                                                                                                                    1.3%            100%
    30%                                                                               Hispanic/Latino                                              2.7%             80%
                                                                                                                                                          0.5%             40.1%               46.3%             51.9%              51.0%
    20%                                                                               Asian                                                               0.1%      60%
                                                                                      American Indian/                                  8.9%                1.0%    40%
    10%                                                                               Alaska Native                                                                        59.8%
                                                                                                                     84.1%                                                                     53.2%             48.1%              49.0%
                                                                                      Native Hawaiian/                                                              20%
      0%                                                                              Pacific Islander
Enrollment             Academics          Economics     Research   Financial
                                                                                                                                                                                            HURON I 32

     UMS Revenue and Expenses over time
     Between 2014 and 2020, expenses across University of Maine System seven universities increased by 7.8% while revenue has risen 6.7%.
                                                                                                                                                                             Number of Years
                                                           UM System Total Expenses & Revenue                                                      Institution Name
                                                                                                                                                                             with positive Net
                     $740                                                                                                                                                   Income over past 7
                                                                                                                                                                                   years
                     $720
                                                                                                                                                        UM                                7
                     $700
          Millions

                                                                                                                                                       UMA                                4
                     $680
                                                                                                                                                       UMF                                2
                     $660

                     $640
                                                                                                                                                      UMFK                                7

                     $620                                                                                                                              UMM                                5

                     $600                                                                                                                              UMPI                               0
                                        2014               2015         2016        2017              2018               2019               2020
                                                             UM System Expenses          UM System Revenue                                             USM                                5

 Implications for UMS: Expenses have risen slightly faster than revenue overtime. In order to remain financially sustainable in the future, expenses will need
                                                                   to align with revenues.

Source: IPEDS. Note: One-time revenue sources include Coronavirus Aid, Relief and Economic Security (CARES) Act - $17.9 million awarded in FY20.           © 2021 Huron Consulting Group Inc. and affiliates.
Enrollment          Academics     Economics         Research           Financial
                                                                                                                                                                                                                   HURON I 33

   UMS Financial Health: Expense by Category
   UMS expenses have flexed with the COVID-19 pandemic, for example, increasing funds for operation and maintenance by 26% from FY20
   to FY21.

FY2017                                                                                                                                                           •   Institutional Support, the day-to day
                                                                                                                                                                     operational support of the institution,
FY2018
                                                                                                                                                                     decreased significantly by $53M in FY21, a
                                                                                                                                                                     reduction of 81%, explaining the drop in
                                                                                                                                                                     total expenses for the year
FY2019

                                                                                                                                                                 •   Research expenses have grown 17.8%
FY2020                                                                                                                                                               since FY2017 and should be expected to
                                                                                                                                                                     increase more rapidly given the recent R1
                                                                                                                                                                     designation for UM
FY2021

                                                                                                                                                                 •   Auxiliary expenses show a 10.9% reduction
         $0                   $100         $200                $300                   $400            $500               $600            $700             $800
                                                                                                                                                                     since FY17 with the most significant drop in
                                                                                                                                                      Millions
                Instruction                       Academic Support                       Student Services                   Research                                 FY21 of $6M as the pandemic limited the
                Public Service                    Institutional Support                  Operation and Maint. Of Plant      Depreciation & Amortization
                                                                                                                                                                     scale of operations for dining and residence
                                                                                                                                                                     hall facilities
                Student Aid                       Auxiliary Enterprises

                      Implications for UMS: UMS will need to reduce future expenses through careful resource planning aligned with its strategic vision.

Source: UMS Annual System Financial Report, 2021. Note: Maine Law is represented in USM reported data.                                                                            © 2021 Huron Consulting Group Inc. and affiliates.
Enrollment    Academics        Economics    Research       Financial
                                                                                                                                                                                             HURON I 34

     UMS Financial Health: Revenues by Category
     UMS relies heavily on net student fees as well as state appropriations as sources of revenue. The noncapital state appropriation was the
     second largest funding source for educational and general operations behind net student fees.
                              Operating Revenues                                  Non-Operating Revenues
                                                                                                                                          •   UMS benefitted from CARES and CRRSA
                                                                                                                                              Act funding in FY20 and FY21, totaling
FY2017                                                                                                                                        $52M

FY2018                                                                                                                                    •   Net student fees decreased to $239M in
                                                                                                                                              FY21, a drop of 2.45% from FY17 which
FY2019
                                                                                                                                              may be a result of declining enrollment
                                                                                                                                              and tuition freezes.
FY2020
                                                                                                                                          •   Continued tuition freezes limit a natural
                                                                                                                                              leverage point to increase Net Tuition
FY2021                                                                                                                                        Revenue

         $0          $100                $200        $300              $400          $500               $600               $700    $800
                                                                                                                                          •   Investment returns more than doubled
                   Net Student Fees                                            Grants, Contracts, and Recovery of Indirect Costs
                                                                                                                                              between FY20 and FY21, reflecting a
                   Other operating revenues                                    Non Capital State of Maine Appropriations
                   Federal Pell Grants                                         Coronavirus Relief Funding
                                                                                                                                              strong market as the economy continued
                   Gifts Currently Expendable                                  Endowment Return (used for operations)                         to rebound, however, unreliable in the
                   Investment Income                                                                                                          future

    Implications for UMS: UMS will need to align its strategic priorities with greater diversification of revenue streams to support its mission of serving both
                                            residents and the economic and workforce development of Maine.
                                                                                                                                                            © 2021 Huron Consulting Group Inc. and affiliates.
 Source: UMS Annual System Financial Report, 2021. Note: Maine Law is represented in USM reported data.
Enrollment            Academics    Economics         Research        Financial
                                                                                                                                                                                                    HURON I 35

      UMS Financial Health: Balance Sheet Review
      Balance sheets for FY20 illustrate that the bulk of resources in the System are held between two institutions and the System Office.

                                         Balance Sheet Comparisons as of FYE 2020 (excl. foundations)                                                                          Rate of        Higher
    Millions

               600                                                                                                                                                          return on net Education
               500                                                                                                                                                             position      Industry
                                                                                                                                                                              (adjusted for
               400
                                                                                                                                                                                inflation)  Benchmark
               300
                                                                                                                                                            FY20            -0.4%                  6.0%
               200
               100
                0
                                                                                                                                                            FY19            -1.9%                  6.0%
                             UM                                         System Office                                     USM

                        Endowment per IPEDS*       PP&E, net        Other Assets        Deferred Outflows   Debt*    Other Liabilities   Deferred Inflows
                                                                                                                                                            FY18            -0.9%                  6.0%

                                                                                                                                                            FY17            0.9%                   6.0%
    Millions

               60
                                                                                                                                                            FY16            -0.7%                  6.0%
               40
                                                                                                                                                            FY15            -3.0%                  6.0%
               20

               0                                                                                                                                            FY14            0.6%                   6.0%
                       UMA                         UMF                               UMPI                     UMFK                       UMM

                        Endowment per IPEDS*       PP&E, net        Other Assets        Deferred Outflows   Debt*    Other Liabilities   Deferred Inflows   FY13            1.8%                   6.0%

                     Implications for UMS: The rate of return on total net assets over time examines whether an institution’s financial condition is improving over
                       prior year by measuring total economic return. For the past 8 consecutive years, UMS’ ratio has been well below the industry benchmark.

                                                                                                                                                                   © 2021 Huron Consulting Group Inc. and affiliates.
Source: IPEDS; UMS FY20 Core Financial Ratios. Note: Maine Law is included in USM reported data
Enrollment    Academics     Economics      Research       Financial
                                                                                                                                                                  HURON I 36

    UMS State Appropriations
    State appropriations for UMS show a steady increase since 2008 and between FY10-21 has represented between 28-31% of the net
    nonoperating revenue for the System, annually. Over that same time, however, there is significant loss of purchasing power because of
    inflation. Nationally, education appropriations per FTE in 2020 remain at a lower level than most years prior to the Great Recession’s steep
    declines.1
                                             2008 ME Appropriation at CPI vs Actual through 2022                  Public Higher
                                                                                                                    Education
                                                                                                                  Appropriations
                                                                                                                                                                        % Change
                                                                                                                     per FTE,             2015            2020
                                                                                                                                                                        Since 2015
                                                                                                                     FY2020
                                                                                                                    (adjusted)

                                                                                                                  US                   $7,840       $8,636             10.2%

                                                                                                                  Maine                $7,327       $8,102             10.6%

                                                                                                                  Connecticut          $12,074      $11,965            -0.9%

                                                                                                                  Massachusetts        $7,483       $8,728             16.6%

                                                                                                                  New Hampshire        $2,950       $4,321             46.5%

                                                                                                                  Rhode Island         $5,197       $6,878             32.3%

                                                                                                                  Vermont              $2,945       $3,387             15.0%

 Implications for UMS: The modest increases in state funding coupled with the negative impacts of inflation add constraints to UMS achieving its mission of
                 providing affordable education. UMS will need to make strategic choices to avoid burdening students with additional costs.
Source: 1. State Higher Education Finance Report FY2020 Report (SHEEO)                                                           © 2021 Huron Consulting Group Inc. and affiliates.
Enrollment             Academics      Economic      Research       Financial
                                                                                                                                                                                                         HURON I 37

      UMS Net Revenue Tuition & Fees
      Institutions with an asterisk below have experienced declining enrollment over the 2012-2021 period. Although net revenue and fees per
      student have increased, enrollment has decreased. Tuition and fee sticker prices has remained approximately constant due to tuition
      freezes suggesting some universities are increasing the cost of attendance for some students.
                                        Net Revenue Tuition & Fees by Campus, 2012-2021                                       Net Revenue Tuition & Fees by FTE, Campus, 2012-2021
                                                     (adjusted for inflation)                                                                 (adjusted for inflation)
                     $120                                                                                    $14,000
          Millions

                                                                                                             $12,000
                     $100

                                                                                                     UM      $10,000                                                                                            UM
                     $80
                                                                                                     USM*                                                                                                       USM*
                                                                                                              $8,000
                                                                                                     UMA*                                                                                                       UMFK*
                     $60
                                                                                                     UMF*                                                                                                       UMF*
                                                                                                              $6,000
                                                                                                     UMFK*                                                                                                      UMA*
                     $40                                                                             UMPI*                                                                                                      UMPI*
                                                                                                              $4,000
                                                                                                     UMM*                                                                                                       UMM*
                     $20
                                                                                                              $2,000

                      $0                                                                                         $0
                            2012    2013   2014   2015   2016   2017   2018     2019   2020   2021                     2012   2013   2014   2015   2016   2017   2018      2019     2020     2021

   Implications for UMS: To maintain its commitment to an accessible and affordable education for students and support its financial sustainability, UMS will
                       need to consider how to flex to meet supply and demand to avoid significant future cost increases to students.
                                                                                                                                                                        © 2021 Huron Consulting Group Inc. and affiliates.
Source: UMS 10 Year Enrollment Data, UMS System Dashboard
Enrollment    Academics      Economics   Research   Financial
                                                                                                                                                          HURON I 38

    UMS Financial Health: Capital Investments
    More than 50% of UMS’s physical plant was constructed or last renovated more than 50 years ago.1 In 2021, the Board of Trustees
    authorized spending on varied strategic investments across the System including an innovative public-private partnership.

                                                                                                                     •     Over the past five years, the
        Capital Investments FY06-FY21                                                                                      average capital expenditures as a
                                                                                                                           percent of operating expenses
                                                                                                                           was 4.7%, or $32.7M annually.

                                                                                                                     •     Huron recommends baseline
                                                                                                                           capital expenditures of at least
                                                                                                                           5%-to-7% of operating expenses;
                                                                                                                           however, UMS capital
                                                                                                                           expenditures have been below
                                                                                                                           that level.

                                                                                                                     •     Median capital expenditures as a
                                                                                                                           percent of operating expenses for
                                                                                                                           public university systems (per
                                                                                                                           Moody’s Investors Service)
                                                                                                                           totaled 8.9% in FY20 – which is
                                                                                                                           higher than the UMS level of
                                                                                                                           capital investments.

 Implications for UMS: UMS capital investments have been inconsistent year over year. UMS needs to examine where they can focus capital investments to
                                                               support strategic goals.
1. 2021 UMS Annual Financial Report                                                                                      © 2021 Huron Consulting Group Inc. and affiliates.
Enrollment      Academics       Economics        Research        Financial
                                                                                                                                                                                                                     HURON I 39

     UMS Financial Health: Aging Infrastructure
     At 54%, UMS has twice the percentage of space aged 50 years or more compared to their peers at 27%, a trend that accelerated
     significantly over the last 5 years. Aging facilities pose significant operational risks and may also deter prospective students seeking to see
     the value of their tuition investment.1

       Implications for UMS: The strategic plan must address aging infrastructure across the System to align itself with peers and improve recruitment and
                                                                           retention.

                                                                                                                                                                                  © 2021 Huron Consulting Group Inc. and affiliates.
Source: UMS Fy21 Return on Physical Assets Final Presentation , Gordian; 1. State of Facilities in Higher Education, Exploring Facilities Relevance in a Changing Environment, Gordian
HURON I 40

     System Collaborations & Partnerships
     At UMS, collaborative initiatives at the System and university level are prevalent and range from academic programs to shared
     administrative services and/or facilities. Below is a representative sample of collaborations.
                                                                                                                        Representation of current UMS collaborations

      •     System-wide collaborations include the GIS Consortium,
            Trauma-informed Emergency Management, Nursing,
            Education, MCECIS, UMS Libraries, and Faculty
            Governance Council.

      •     Articulation agreements include a 3+3 with the Law
            school, 4+1 in Special Education, 4+1 in
            Psychology/Counseling, and a 2+2 Nursing program.

      •     Multi-university academic partnerships include
            Meteorology, Aviation, Cybersecurity, Forestry, History,
            Political Science, Veterinary Tech, Instructional
            Technology, Athletic Training, and general education.

      •     The Research Faculty and Affiliates exchange program,
            medical lab space, the Maine Graduate and Professional
            Center, and Education Centers illustrate shared space,
                                                                                                              UM        UMA        UMF        UMFK       UMM        UMPI         USM         LAW
            services, and resources.                                                            Note: The size of each circle represents the number of collaborations in which that university is engaged.

          Implications for UMS: UMS has a strong foundation of collaborations and partnerships, many of which can be scaled to other institutions or system-wide.

Source: UMS Collaborative (multi-university) academic programs and partnerships, August 2021.                                                              © 2020 Huron Consulting Group Inc. and affiliates.
Higher Education Market
Trends and System
Benchmarking

                          41
Enrollment       Academics     Economics          Research        Financial
                                                                                                                                                                                        HURON I 42

Anticipated Demographic Trends
Higher education institutions will be challenged by demographic and population trends over the next 10-15 years. The number of traditional
students graduating from high school in the United States is expected to peak in 2025 and eventually fall below 2015 levels by 2035 which
directly impacts the pool of traditional aged students to recruit and enroll.
                                                                            Actual and Projected High School Graduates,
                                                                                             2015-2035
        United States (Actual)               United States (Projected)          West (Actual)               West (Projected)        Midwest (Actual)                   Midwest (Projected)

        South (Actual)                       South (Projected)                  Northeast (Actual)          Northeast (Projected)   Maine (Actual)                     Maine (Projected)

 120%

 115%

 110%

 105%

 100%

  95%

  90%

      Implications for UMS: Following a peak in 2025, the number of high school graduates in Maine is projected to decline from 2025-2035 and will fall below
                                                 2015 levels. The UMS should be prepared to adapt as a result.

 Source: Western Interstate Commission for Higher Education, Knocking at the College Door (December 2020)                                              © 2020 Huron Consulting Group Inc. and affiliates.
You can also read