Transcriptome based analysis of resistance mechanism to black point caused by Bipolaris sorokiniana in wheat
←
→
Page content transcription
If your browser does not render page correctly, please read the page content below
www.nature.com/scientificreports
OPEN Transcriptome‑based analysis
of resistance mechanism to black
point caused by Bipolaris
sorokiniana in wheat
Qiaoyun Li, Chuang Gao, Kaige Xu, Yumei Jiang, Jishan Niu, Guihong Yin *
&
Chenyang Wang *
Black point is a cereal disease caused by complex pathogens, of which the pathogenicity of Bipolaris
sorokiniana is the most serious in wheat. Resistance to black point is quantitative in nature, and thus
the mechanism is poorly understood. We conducted a comparative transcriptome analysis to identify
differentially expressed genes (DEGs) in black point-slightly susceptible and -highly susceptible
wheat lines at different timepoints following B. sorokiniana inoculation. DEGs associated with
photosynthesis were upregulated in black point-slightly susceptible lines. The top Gene Ontology
enrichment terms for biological processes were oxidation–reduction, response to cold, salt stress,
oxidative stress, and cadmium ion; terms for cellular component genes were mainly involved in
plasma membrane and cytoplasmic membrane-bounded vesicle, whereas those for molecular function
were heme binding and peroxidase activity. Moreover, activities of antioxidant enzymes superoxide
dismutase, catalase, and peroxidase were higher in slightly susceptible lines than those in highly
susceptible lines (except peroxidase 12–24 days post-inoculation). Thus, resistance to B. sorokiniana-
caused black point in wheat was mainly related to counteracting oxidative stress, although the
specific metabolic pathways require further study. This study presents new insights for understanding
resistance mechanisms of selected wheat lines to black point.
Black point disease is common in wheat (Triticum aestivum L.) grown throughout the world and is characterized
by a dark or brown discoloration of kernel embryos. In severe cases, the discoloration covers the whole kernel
and causes s hrinkage1–4. Black point results in economic losses due to a reduction in the commercial grade of
the grain from infected seeds with a discolored appearance5,6 and also affects the effectiveness of wheat seeds as
infection decreases seed germination, inhibits seedling growth, and reduces grain y ield3,7. This disease can also
lead to a serious food safety problem because some of the infecting fungal species that cause black point may
produce toxic s ubstances8,9.
The incidence of black point has attracted research attention from a range of countries1,3–7,9,10. Although the
damage caused by black point can be reduced by the application of chemical and biological agent3, the best strat-
egy to control this disease is by planting more resistant wheat cultivars. However, resistance may be limited; for
instance, in the North China Plain, more than 60% of 403 wheat genotypes were identified as being susceptible
to black point from 2010 to 2 0127.
Understanding the mechanism of resistance to black point is critical for breeding disease-resistant and
high-yielding cultivars. Currently, research on black point has focused mainly on the d amage5–7, causative
pathogens6,11,12, influencing factors13,14, and control methods2,3 and also in quantitative trait locus/genes map-
ping for disease resistance15–20, although there are few studies on resistance mechanisms.
In wheat, resistance to black point is quantitative in nature and the underlying genetic factors are also
highly complex, and experimental errors may have previously masked differences in resistance levels among
genotypes4,16,20. To date, 230 loci involved in resistance to black point have been reported and are located through-
out the wheat genome, with each locus explaining between 3.7 to 34.9% of phenotypic v ariation15–20. Similar
to Fusarium head blight (FHB), the development of black point-resistant wheat cultivars has been impeded
Agronomy College/National Key Laboratory of Wheat and Maize Crop Science, Henan Agricultural University, No.
15 Longzi Lake University Zone, New East District of Zhengzhou, Zhengzhou 450046, Henan, People’s Republic of
China. *email: 1469281912@qq.com; xmzxwang@henau.edu.cn
Scientific Reports | (2021) 11:6911 | https://doi.org/10.1038/s41598-021-86303-1 1
Vol.:(0123456789)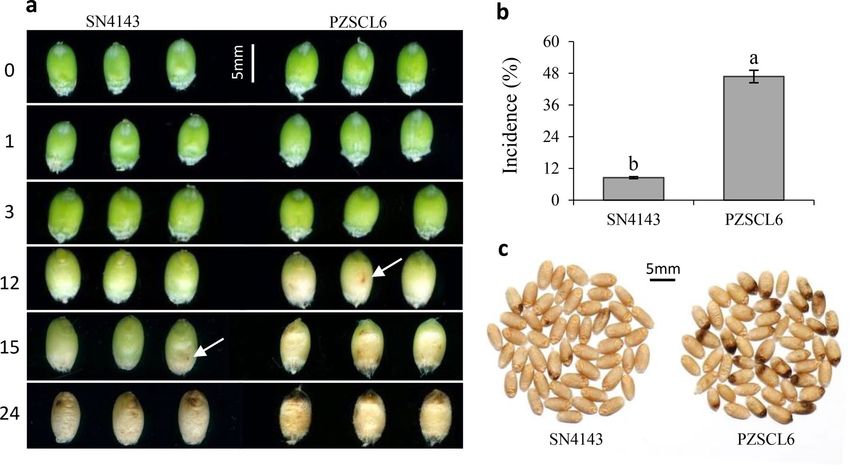
www.nature.com/scientificreports/
Figure 1. Symptom development of black point during grain filling stage (a) and mature kernels (c) from
slightly susceptible SN4143 and highly susceptible PZSCL6 wheat line, and the incidence of SN4143 (8.5%)
and PZSCL6 (46.8%) (b). 0, 1, 3, 12, 15 and 24 indicated the different days after inoculation. Bars (means) with
different letters are significantly different (n = 3, P < 0.01).
because of poor understanding of the resistance m echanism21. Transcriptome analysis of wheat is a useful tool for
understanding the resistance mechanism of wheat diseases, including leaf rust22, FHB21 and powdery m ildew23.
In our previous study, we screened black point-resistant and -susceptible wheat lines7 based on the incidence
under natural field condition and identified eight fungal species causing black point, including Bipolaris soro-
kiniana, Alternaria alternata, and Fusarium equiseti, of which B. sorokiniana was the most virulent p athogen11.
Here, we used RNA-seq to conduct transcriptome analysis of slightly and highly susceptible kernels inoculated
with B. sorokiniana. We also measured the activities of antioxidant enzymes, including superoxide dismutase
(SOD), catalase (CAT), and peroxidase (POD). Our objectives were: (i) to analyze the major biological process
associated with resistance to black point; and (ii) to assess whether the disease resistance mechanism is related
to the ability to respond favorably to stress in wheat, including modulation of antioxidant enzyme activities.
Results
Symptom development among slightly and highly susceptible wheat lines. The development of
black point symptoms on kernels from the slightly susceptible SN4143 and highly susceptible PZSCL6 is shown
in Fig. 1. A brown discoloration visible to the naked eye appeared on highly susceptible kernels at 12 days after
inoculation with B. sorokiniana, and on slightly susceptible kernels at 15 days; at which time, the symptoms of
black point on highly susceptible kernels were clearly visible. At 24 days after inoculation, the embryo and sur-
rounding parts on kernels from the highly susceptible line developed brown or black discoloration, whereas the
discolored area on kernels from the slightly susceptible line was smaller and lighter than that of the susceptible
line (Fig. 1a).
The incidence of black point in the highly susceptible line was significantly greater than that in the slightly
susceptible line (P < 0.01), with incidences of 46.8% and 8.5%, respectively (Fig. 1b,c). Moreover, the diseased
kernels from the highly susceptible line displayed more serious symptoms than those of the samples from the
slightly susceptible line (Fig. 1c). Symptom development in the slightly susceptible line was considerable slower,
necessitating exploration of the mechanism of disease resistance.
Overview of transcriptome sequencing data. Twenty-four libraries divided amongst four groups of
timepoints of 0, 1, 3, and 12 days were sequenced (R0: T1, T2, T3; R1: T13, T14, T15; R3: T19, T20, T21; R12:
T4, T5, T6; S0: T10, T11, T12; S1: T16, T17, T18; S3: T22, T23, T24; S12: T7, T8, T9), and 251.8 Gb of clean bases
obtained. The average Q30 percentage exceeded 92.3% (Supplementary Table S1). The comparison efficiency of
reads in each sample compared with that of the T. aestivum reference genome was between 77.7% and 94.2%.
The average comparison efficiency of the unique mapped reads was 78.0% (Supplementary Table S2). Principal
component analysis (PCA) showed a good correlation among samples (Fig. 2a), and Pearson correlation coef-
Scientific Reports | (2021) 11:6911 | https://doi.org/10.1038/s41598-021-86303-1 2
Vol:.(1234567890)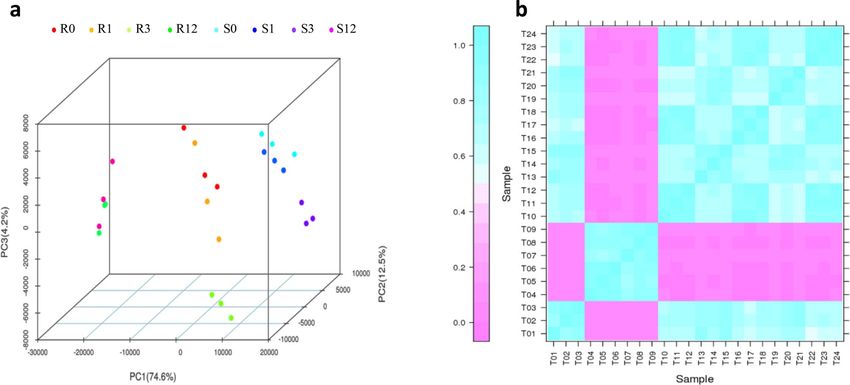
www.nature.com/scientificreports/
Figure 2. Correlations among the samples between slightly and highly susceptible lines at different timepoints.
(a) Principal component analysis (PCA) map of the samples; (b) Pearson correlation coefficient (PCC) map of
the samples. This figure was performed using BMKCloud (www.biocloud.net).
a b
60000 R1_vs_S1 R3_vs_S3
56101 55563
54000 52275 52295 2958_up 4115_up
Gene number
49944 51102 50856 5061 DGEs 7792 DGEs
48796 2103_down 3677_down
48000
42000
36000
30000
R0 R1 R3 R12 S0 S1 S3 S12
c 60
Percentage of gene No.
45 0d 1d 3d 12d
30
15
0
FC=2 FC=4 FC=8 FC=16 FC=32
Figure 3. The differentially expressed genes (DEG) profiles. (a) Histogram of the gene numbers in the eight
samples; (b) Venn diagram of DEG numbers in eight samples; (c) DEG numbers with different fold changes.
0, 1, 3, and 12 indicated the different days after inoculation. R and S are the slightly susceptible (SN4143) and
highly susceptible (PZSCL6) line, respectively.
ficient (PCC) analysis showed that all correlation coefficients between replicate samples exceeded 0.81 (Fig. 2b),
demonstrating high consistency of biological replicates.
A total of 143,666 genes were identified in all samples, and each sample contained 89,631 genes (Supplemen-
tary Table S1). A total of 32,876 new genes were identified, of which 21,569 were functionally annotated with
reference to the eight databases searched (Supplementary Table S3). We identified 55,275, 52,295, 49,944, 56,101,
51,102, 50,856, 48,796, and 55,563 genes (fragments per kilobase of transcript per million mapped fragments
[FPKM] ≥ 0.5) from the eight samples R0, R1, R3, R12, S0, S1, S3, S12, respectively (Fig. 3a).
Comparison of DEGs between black point‑slightly and ‑highly susceptible lines at four time‑
points. To explore the genes related to resistance to black point, differentially expressed genes (DEGs) were
identified by pairwise comparisons of the 24 libraries. When fold change (FC, |Log2FC|= 2) and false discovery
rate (FDR) < 0.01 were set as filtering thresholds, the number of DEGs identified among the four timepoint
groups of R0 vs. S0, R1 vs. S1, R3 vs. S3, R12 vs. S12 were 4816, 5061, 7792, and 2006, respectively, at differ-
Scientific Reports | (2021) 11:6911 | https://doi.org/10.1038/s41598-021-86303-1 3
Vol.:(0123456789)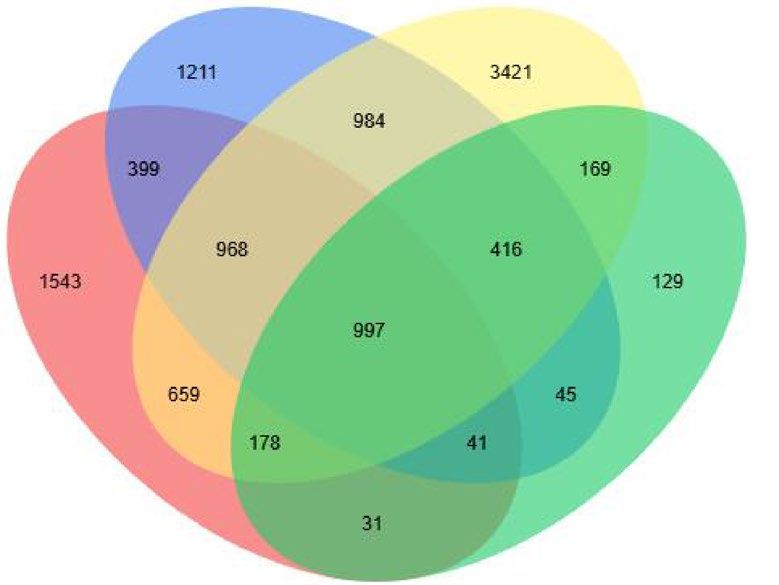
www.nature.com/scientificreports/
Sample pair Pathway Ko ID P-value
Glyoxylate and dicarboxylate metabolism ko00630 2.46E−13
R0d_vs_S0d Photosynthesis—antenna proteins ko00196 2.75E−09
Carbon fixation in photosynthetic organisms ko00710 1.02E−08
Carbon fixation in photosynthetic organisms ko00710 5.21E−09
R1d_vs_S1d Nucleotide excision repair ko03420 2.15E−06
Carbon metabolism ko01200 3.76E−06
Photosynthesis—antenna proteins ko00196 < 1e−30
R3d_vs_S3d Glyoxylate and dicarboxylate metabolism ko00630 < 1e−30
Carbon fixation in photosynthetic organisms ko00710 < 1e−30
Aminoacyl-tRNA biosynthesis ko00970 4.49E−04
R12d_vs_S12d Pyrimidine metabolism ko00240 4.51E−03
RNA transport ko03013 1.53E−02
Table 1. Major enrichment pathways of the DEGs from the four timepoint groups, referencing the KEGG
database. R and S are the slightly susceptible (SN4143) and highly susceptible (PZSCL6) line, respectively.
Sample pair Class Annotation GO ID P-value
Response to cadmium ion GO:0046686 4.30E−16
Biological process
Response to salt stress GO:0009651 1.30E−15
Cytoplasmic membrane-bounded vesicle GO:0016023 < 1e−30
R0d_vs_S0d Cellular component
Plasma membrane GO:0005886 1.90E−21
Protein heterodimerization activity GO:0046982 1.00E−19
Molecular function
Peroxidase activity GO:0004601 1.50E−14
Response to cadmium ion GO:0046686 6.40E−16
Biological process
Response to salt stress GO:0009651 7.00E−16
Cytoplasmic membrane-bounded vesicle GO:0016023 < 1e−30
R1d_vs_S1d Cellular component
Nucleosome GO:0000786 < 1e−30
Protein heterodimerization activity GO:0046982 9.40E−30
Molecular function
Heme binding GO:0020037 2.20E−14
Oxidation–reduction process GO:0055114 1.80E−18
Biological process
Response to salt stress GO:0009651 1.30E−15
Cytoplasmic membrane-bounded vesicle GO:0016023 < 1e−30
R3d_vs_S3d Cellular component
Plasma membrane GO:0005886 1.90E−21
Peroxidase activity GO:0004601 6.30E−16
Molecular function
Heme binding GO:0020037 1.60E−14
Response to salt stress GO:0009651 2.10E−17
Biological process
Oxidation–reduction process GO:0055114 1.60E−14
Cytoplasmic membrane-bounded vesicle GO:0016023 < 1e−30
R12d_vs_S12d Cellular component
Plasma membrane GO:0005886 4.20E−25
Heme binding GO:0020037 7.30E−16
Molecular function
Peroxidase activity GO:0004601 2.80E−15
Table 2. Major enrichment terms of the DEGs from the four timepoint groups, referencing the GO database.
R and S are the slightly susceptible (SN4143) and highly susceptible (PZSCL6) line, respectively.
ent fold changes (Fig. 3b, Supplementary Tables S4–S7). The number of DEGs decreased with a corresponding
increase in the degree of fold change (Fig. 3c). The percentage of DEGs with a 32-fold change at 12 days after
inoculation (R12 vs. S12) was the highest (28.8%), whereas that at 1 day (R1 vs. S1) was the lowest (11.7%).
The top metabolic pathways were classified based on gene annotations in the Kyoto Encyclopedia of Genes
and Genomes (KEGG) database (Table 1). The top enriched pathways with DEGs of R0 vs. S0 were the same as R3
vs. S3 and are related to the process of photosynthesis (glyoxylate and dicarboxylate metabolism, photosynthesis-
antenna proteins, and carbon fixation in photosynthetic organisms). The enriched pathways involving DEGs of
R1 vs. S1 are also related to the process of photosynthesis, except for nucleotide excision repair. In contrast, the
enriched pathways involving DEGs of R12 vs. S12 differed from those at days 1 to 3 and are principally involved
in aminoacyl-tRNA biosynthesis, pyrimidine metabolism, and RNA transport.
Further elaboration of the DEG analysis according to the gene number and p-value of the main terms in the
Gene Ontology (GO) database are listed in Table 2, together with the top two enrichment terms of the DEGs for
Scientific Reports | (2021) 11:6911 | https://doi.org/10.1038/s41598-021-86303-1 4
Vol:.(1234567890)www.nature.com/scientificreports/
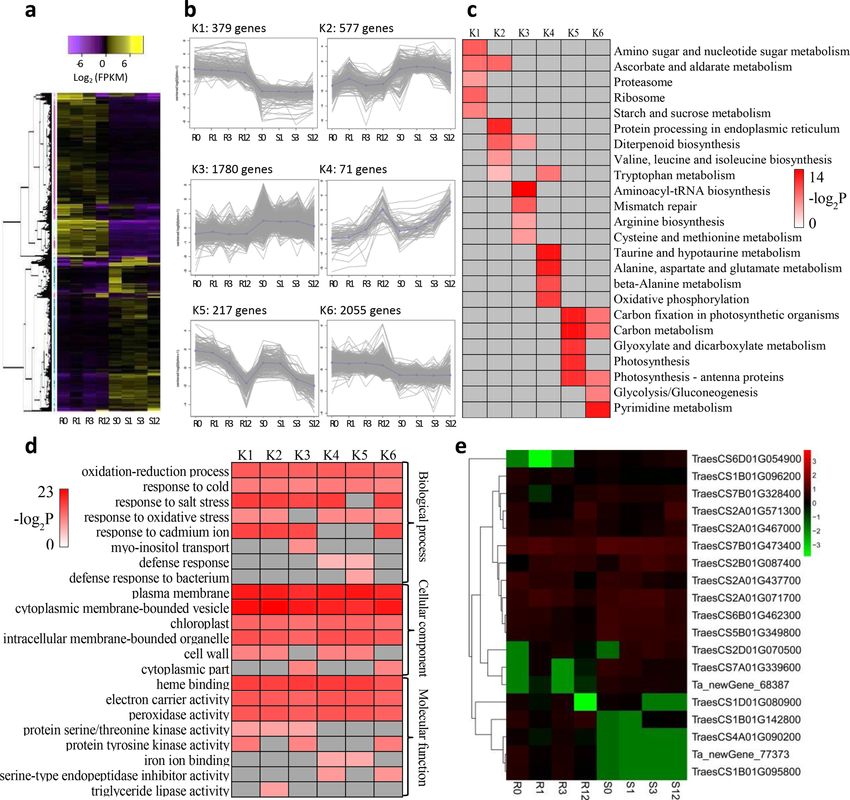
Figure 4. Overview of serial analysis of differentially expressed genes (DEGs) identified by pairwise
comparisons between slightly and highly susceptible wheat lines at 0, 1, 3 and 12 days after inoculation with
Bipolaris sorokiniana. (a) Heatmap of all DEGs among four timepoint samples for both lines. Expression values
were presented as log2-transformed normalized FPKM values. (b) The six clusters (K1 to K6) for DEGs. (c)
Top five enrichment pathways of the DEGs in different clusters, referring to the KEGG database. (d) Top five
enrichment terms of the DEGs in different clusters, referring to GO database. The significance of the most
represented pathways in each main cluster are indicated using -log2-transformed P-value (red); dark grey areas
represent missing values. (e) Heat map of the 19 DEGs included in peroxidase activity (GO:0004601). R and S
are the slightly susceptible (SN4143) and highly susceptible (PZSCL6) line, respectively. (a,b,e) were performed
using BMKCloud (www.biocloud.net).
biological processes, cellular components, and molecular functions. All of the top enrichment items for biologi-
cal processes at different days after inoculation were related to coping with stress (oxidation–reduction process,
response to cadmium ion, and response to salt stress). The top enrichment terms for cellular components were
cytoplasmic membrane-bounded vesicles, plasma membranes, and nucleosomes. For molecular function, the
top terms were protein heterodimerization activity, peroxidase activity, and heme binding.
DEG co‑expression clusters. To discover gene expression trends from DEGs among the four timepoint
groups, a gene co-expression analysis was performed using k-means clustering (k = 6). A total of 5079 genes
(Supplementary Table S8) were selected and classified into six modules (Fig. 4a,b). Clusters K1 and K6, which
included 2434 genes, were highly expressed in the slightly susceptible line compared with expression in the
Scientific Reports | (2021) 11:6911 | https://doi.org/10.1038/s41598-021-86303-1 5
Vol.:(0123456789)www.nature.com/scientificreports/
highly susceptible line. Genes in clusters K2 (577 genes) and K3 (1780 genes) were significantly expressed to a
high level in the susceptible line. Genes in cluster K4 (71 genes) were also highly expressed in the susceptible
line and, and unlike those in K2 and K3, continued to increase rapidly at 12 days after inoculation. The expres-
sion levels of genes in K5 in the slightly susceptible line were higher than those in the highly susceptible line at
each sampling day; these differed from genes in clusters K1 and K6 and were highly expressed at day 0, although
expression began to decrease at day 1, with gradually downregulation until 12 days after inoculation.
KEGG analysis was used to discover the metabolic pathways involved in the differentially clustered genes
(Fig. 4c). For the six clusters, we discovered that many of the genes in clusters K1, K5, and K6 (all had upregulated
expression in the slightly susceptible line) were involved in photosynthesis and sugar metabolism pathways,
such as starch and sucrose metabolism (ko00500), carbon fixation in photosynthetic organisms (ko00710),
carbon metabolism (ko01200), photosynthesis (ko00195), photosynthesis-antenna proteins (ko00196), and gly-
colysis/gluconeogenesis (ko00010). In contrast, many genes in clusters K2, K3, and K4 (where expression was
downregulated in the slightly susceptible line) were involved in amino acid metabolism, such as valine, leucine,
and isoleucine biosynthesis (ko00290), tryptophan metabolism (ko00380), arginine biosynthesis (ko00220),
cysteine and methionine metabolism (ko00270), alanine, aspartate, and glutamate metabolism (ko00250); and
beta-alanine metabolism (ko00410). These results indicate that photosynthesis-related metabolic pathways are
important for the black point resistance processes caused by B. sorokiniana.
To explore the main terms associated with resistance to black point, the functions of DEGs in six clusters
were classified based on the GO database; the top five terms of biological processes, cellular components and
molecular functions are listed in Fig. 4d (P < 0.05). Genes included in different clusters were mainly involved
in the biological processes of oxidation–reduction process (GO:0055114), response to cold (GO:0009409), salt
stress (GO:0009651), oxidative stress (GO:0006979), and cadmium ion (GO:0046686). Genes concerning cellular
components were mainly involved in plasma membrane (GO:0005886), cytoplasmic membrane-bounded vesicle
(GO:0016023), chloroplast (GO:0009507), intracellular membrane-bounded organelle (GO:0043231), and cell
wall (GO:0005618). Major molecular function-related genes were heme binding (GO:0020037), electron carrier
activity (GO:0009055) and peroxidase activity (GO:0004601). These results indicate that resistance to black point
was associated with the ability to reduce stresses caused by B. sorokiniana; integrity of the plasma membrane and
intracellular membrane-bounded vesicles and organelles was important in this process. Further, electron carrier
and peroxidase activities may also play important roles in coping with stresses caused by B. sorokiniana infection.
Expression profiles of 12 DEGs. To validate the reliability of the sequencing results, 12 important DEGs
associated with stress or phenylpropanoid biosynthesis were selected from six clusters for assessment via reverse
transcription quantitative PCR (RT-qPCR) (Fig. 5). These genes included: pathogenesis-related proteins (PR1
and PR4B), stress-related protein (SRP), defensin (Tm-AMP-D1.2), l-ascorbate peroxidase 3 (APX3), heat
shock proteins (hsp16.9B and hsp23.2), chitinase 11 (Chi11), gibberellin 20-oxidase 1-B (GA20ox1B), linoleate
9S-lipoxygenase 1 (LOX1.1), 4-coumarate-CoA ligase-like 7 (P0474B11.33), and cinnamoyl-CoA reductase 1
(T24D18.5). The RT-qPCR experimental samples were the same as those used for RNA-seq (except for samples
at 18 days, which were only used for RT-qPCR). The results revealed that the expression changes of these 12
genes were consistent with the RNA-seq results (Supplementary Table S9).
The expression levels of PR1, Tm-AMP-D1.2, Chi11, and LOX1.1 in the slightly susceptible line were higher
than those in the highly susceptible line (Fig. 5a,d,j,l), although their expression profiles differed. For example,
in the slightly susceptible line, PR1 expression decreased on days 1 and 12, but increased on days 3 and 18; con-
versely, in the highly susceptible line, PR1 expression gradually and consistently decreased (Fig. 5a). Expression
of Tm-AMP-D1.2 increased at day 1 and decreased gradually in the slightly susceptible line, whereas in the highly
susceptible line, this was poorly expressed on all sampling days (Fig. 5d). As these four genes were all highly
expressed in the slightly susceptible line, they may play an important role in the progression of resistance to black
point caused by B. sorokiniana. Conversely, hsp16.9B, hsp23.2, P0474B11.33, and GA20ox1B were all more highly
expressed in the highly susceptible line than in the slightly susceptible line. Expression of P0474B11.33 increased
at day 1 and then decreased at day 3 in both lines, although the expression level in the highly susceptible line was
higher (Fig. 5h). In the slightly susceptible line, expression of hsp16.9B, hsp23.2, and GA20ox1B first increased
and then decreased between days 1–3, although this continued to increase in the highly susceptible line over
the same period (Fig. 5e–g,k). Thus, as these four genes were all highly expressed in the highly susceptible line,
they may be involved in the pathogenic process of B. sorokiniana.
Changes in antioxidant enzymes. Under infection conditions, plants activate a number of antioxidant
enzymes that protect against potentially cytotoxic reactive oxygen species (ROS). Changes in the activities
of antioxidant enzymes SOD, CAT, and POD are shown in Fig. 6. The activities of these enzymes in kernels
from the slightly susceptible line increased significantly after inoculation with B. sorokiniana, except for POD,
12–24 days after inoculation.
There was a similar change in SOD activity in both lines after inoculation with B. sorokiniana (Fig. 6a). On
all sampling days, the SOD activity of the slightly susceptible line was higher than that in the highly susceptible
line. From day 1 to day 24 after inoculation, the SOD activity of the slightly susceptible line was 5.6% to 10.6%
higher, with an average of 8.8%, whereas there was similar SOD activity of the CKs (treated with sterile distilled
water) between the slightly and highly susceptible lines. The trend in CAT activity differed between the slightly
and highly susceptible lines after infection (Fig. 6b). The maximal value of CAT activity was attained at day 1
(102.8 U mg−1 pro) in the highly susceptible line and at day 3 (115.0 U mg−1 pro) in the slightly susceptible line.
In addition to the peak value, CAT activity of the slightly susceptible line was higher than that of the highly sus-
ceptible line; particularly on days 9 and 12, where the slightly susceptible line CAT activity was 64.6% and 76.9%
Scientific Reports | (2021) 11:6911 | https://doi.org/10.1038/s41598-021-86303-1 6
Vol:.(1234567890)www.nature.com/scientificreports/
1500 2000 10000
a b c
Relative expression
1200 PR1 1600 PR4B 8000 SRP
900 R S 1200 R S 6000 R S
600 800 4000
300 400 2000
0 0 0
0 1 3 12 18 0 1 3 12 18 0 1 3 12 18
500
d 2000
e 40000
f
Relative expression
400 1600 32000
Tm-AMP-D1.2 APX3 hsp16.9B
300 1200 R S 24000
R S R S
200 800 16000
100 400 8000
0 0 0
0 1 3 12 18 0 1 3 12 18 0 1 3 12 18
4000 75
g 20
h i
Relative expression
3200 hsp23.2 16 P0474B11.33 60 T24D18.5
2400 R S 12 45 R S
R S
1600 8 30
800 4 15
0 0 0
0 1 3 12 18 0 1 3 12 18 0 1 3 12 18
150
j 900
k 200
l
Relative expression
120 720 160
Chi11 GA20ox1B LOX1.1
90 540 120
R S R S R S
60 360 80
30 180 40
0 0 0
0 1 3 12 18 0 1 3 12 18 0 1 3 12 18
Days after inoculation Days after inoculation Days after inoculation
Figure 5. Spatiotemporal expression profiles of the twelve selected genes. (a) TraesCS2D01G317800
(pathogenesis-related protein 1); (b) TraesCS3D01G524700 (wheatwin-2, Precursor); (c) TraesCS2D01G114800
(stress-related protein); (d) TraesCS1A01G014000 (defensin Tm-AMP-D1.2); (e) TraesCS2A01G071700
(probable l-ascorbate peroxidase 3); (f) TraesCS3D01G045600 (16.9 kDa class I heat shock protein 2); (g)
TraesCS2D01G311400 (23.2 kDa heat shock protein, Precursor); (h) TraesCS4D01G074600 (4-coumarate-CoA
ligase-like 7); (i) TraesCS6D01G365700 (cinnamoyl-CoA reductase 1); (j) TraesCS5A01G500200 (chitinase
11, precursor); (k) TraesCS3B01G432800 (gibberellin 20 oxidase 1-B); (l) TraesCS4B01G037900 (linoleate
9S-lipoxygenase 1). The actin gene is used as internal control. The functional annotation and other details of A-L
are listed in Table S9. All RT-qPCR reactions are replicated thrice. R and S are the slightly susceptible (SN4143)
and highly susceptible (PZSCL6) line, respectively. Number 0, 1, 3, 6, 9, 12, 15, and 18 indicate the different days
after inoculation.
higher, respectively, than that in the highly susceptible line. As with SOD activity, there was no clear difference
in CAT activities between slightly and highly susceptible lines without B. sorokiniana inoculation. The change
trend of POD activity was completely inconsistent between the two lines (Fig. 6c). On days 1–9 after inocula-
tion, POD activity in the slightly susceptible line was higher than that in the highly susceptible line, whereas
on days 12 to 24, this trend was reversed. In particular, at 24 days after inoculation, POD activity in the slightly
susceptible line decreased, but that of the highly susceptible line continued to increase. The POD activity in the
highly susceptible line was 26.8%, 9.1%, 20.4%, and 32.8% higher than that in the slightly susceptible line on
days 15, 18, 21, and 24, respectively.
Hence, compared with that of the highly susceptible line, the measured activities of these three antioxidases
were generally higher in the slightly susceptible line (except for POD at 12 to 24 days) following kernel inocula-
tion with B. sorokiniana. Pathogen infection induced enhanced enzyme activities, which endowed the slightly
susceptible line with a stronger oxidative stress response. However, expression of the 19 genes included in
Scientific Reports | (2021) 11:6911 | https://doi.org/10.1038/s41598-021-86303-1 7
Vol.:(0123456789)www.nature.com/scientificreports/
60
a 130 b 5.9 c
Enzymatic activity (U mg-1 pro) 55 110 R-BS 5.2 R-BS
R-CK R-CK
50 90 S-BS 4.5 S-BS
S-CK S-CK
45 70 3.8
R-BS
40 R-CK 50 3.1
S-BS
35 S-CK 30 2.4
30 10 1.7
0 1 3 6 9 12 15 18 21 24 0 1 3 6 9 12 15 18 21 24 0 1 3 6 9 12 15 18 21 24
Days after inoculation Days after inoculation Days after inoculation
Figure 6. Activities of antioxidant enzymes in kernels from slightly and highly susceptible wheat lines
inoculated with Bipolaris sorokiniana. (a) Superoxide dismutase (SOD); (b) catalase (CAT); (c) peroxidase
(POD); The number 0, 1, 3, 6, 9, 12, 15, 18, 21 and 24 indicate the different days after inoculation. R and S are
the slightly susceptible (SN4143) and highly susceptible (PZSCL6) line, respectively. Bs and CK represent the
samples inoculated with B. sorokiniana and those treated with sterile distilled water, respectively.
peroxidase activity (GO:0004601) was inconsistent between the two lines (Fig. 4e). For example, PER2 (peroxi-
dase 2 precursor) was highly expressed in the slightly susceptible line, whereas PER70 (peroxidase 70 precursor)
was highly expressed in the highly susceptible line.
Discussion
RNA-seq is an effective method for studying the mechanisms of resistance to wheat diseases. For example, Li
et al. used RNA-seq to identify DEGs in FHB-resistant and -susceptible wheat lines and detected an island of 53
constitutive DEGs in a 140 kb region on chromosome 3B21. Sharma et al. used a pair of near-isogenic lines (NILs)
including HD 2329 (susceptible) and HD 2329 + Lr28 (resistant) through RNA-seq to find DEGs associated with
seedling leaf rust resistance mediated by the Lr28 gene22. In the present study, we used RNA-seq to identify DEGs
in wheat lines that were associated to resistance to black point at days 0, 1, 3, and 12 after inoculation with B.
sorokiniana. According to the report of Li et al., the key periods and meteorological factors affecting black point
are a humid environment at 1–15 days, lower temperature at 26–40 days, and a short period of sunshine after
heading14. In mid to late April 2019 (about 1–15 days after heading), there are eight rain fall days, which was more
than that in 2016 (6 days) and 2017 (1 day); the relative humidity was 60.6%, which was higher than that in 2016
(57.3%) and 2017 (41.9%)14. From May 1 to 20 (approximately 26–40 days after heading), average temperature
was 22.1 ℃, which was between in 2016 (20.3 ℃) and 2017 (24.0 ℃). From April 14 to May 31, the daily sunshine
duration was 6.4 h, which was between in 2016 (6.1 h) and 2017 (8.0 h)14. During the grain filling stage in 2019,
there were no extreme meteorological factors affecting the wheat growth (Table S12). Compared with 2016 and
2017, the meteorological factors in 2019 were suitable for the development of black point. In addition, there is
little difference in agronomic traits between the slightly susceptible SN4143 and highly susceptible PZSCL6 used
in this study (Table S13). These results indicated that the significant difference in black point between SN4143
and PZSCL6 was probably due to their different resistance to B. sorokiniana.
Photosynthesis is possibly involved in black point resistance. The plant’s response to pathogen
attack is closely linked to a change in energy metabolic pathways such as the p hotosynthesis21. In the present
study, we found that 73 DEGs involved in metabolic pathways related to photosynthesis, including carbon fixa-
tion in photosynthetic organisms, carbon metabolism, photosynthesis, photosynthesis-antenna proteins, gly-
colysis/gluconeogenesis, porphyrin and chlorophyll metabolism, was associated with black point resistance.
Among the 73 DEGs involved in pathways related to photosynthesis, 58 (79.5%) had up-regulated expression
in the samples from slightly susceptible wheat lines (Fig. 4c, Table S10). For example, FPKM values of the genes
of Ribulose-1,5-bisphosphate carboxylase small subunit PWS 4.3 and PW9 (TraesCS2B01G078900, TraesC-
S2A01G067300), UDP-glucose/GDP-mannose dehydrogenase UGD5 (Triticum_aestivum_newGene_28132),
Chlorophyll A-B binding protein (TraesCS1B01G388200, TraesCS5B01G463000) in the slightly susceptible sam-
ples was more than 10 times that of the susceptible samples. This result indicated that photosynthesis could play
a vital role in regulating wheat resistance to black point, which was consistent with previous reports of wheat
resistance to FHB21,23. Erayman et al. found similar numbers of transcripts involved in carbohydrate metabo-
lism between moderately susceptible and susceptible wheat cultivars, whereas the number of down-regulated
transcripts was higher in leaves of moderately susceptible cultivars than that in susceptible cultivars inoculated
with F. graminearum24. Alterations in carbohydrate metabolism have been reported to occur during pathogen
heat25,26. Reactions between host and pathogen trigger a multitude of genes in defense and energy
stress in w
production pathways21,22,26. As infection starts, the cells may require an increased level of energy production and
the possible reasons may include the diversion of ATP usage towards gene expression and synthesis of defence-
related proteins23. However, the detail of how carbohydrate metabolism regulates the resistance for wheat to
Scientific Reports | (2021) 11:6911 | https://doi.org/10.1038/s41598-021-86303-1 8
Vol:.(1234567890)www.nature.com/scientificreports/
black point caused by B. sorokiniana is unclear. Historically, immunity and photosynthesis have been studied
separately and therefore discussing the cross-talk between these domains would be useful for understanding
resistance mechanisms to black point.
The ability to counteracting oxidative stress is related to black point resistance. Plants usually
need to respond to different environmental changes and biotic stresses. Pathogens are a well-known example
of biotic stress, and B. sorokiniana is particularly important because this can cause multiple diseases in wheat,
including black point, root rot, and leaf s pot4,11,27. Therefore, plants have evolved complex strategies to allow
rapid modulation of biological processes and cellular functions of an active defense response, such as increas-
ing antioxidase activity and inducing the expression of various genes related to oxidative stress, including genes
of pathogenesis-related (PR) p roteins26–28. In general, the major ROS-scavenging enzyme pathways of plants
include SOD, CAT, and POD, the ascorbate–glutathione cycle, and the glutathione peroxidase cycle28. When
plants are infected by fungi, the activities of antioxidant enzymes are increased to counteract oxidative stress. For
example, the activities of CAT, POD, and ascorbate peroxidase (APX) increased after inoculation with Fusarium
species29. In the present study, GO analysis of DEGs following B. sorokiniana infection indicated the enrichment
of transcripts mainly involved in redox processes (response to cold, salt stress, oxidative stress, and cadmium
ion) and the activities of SOD, POD, and CAT all increased following inoculation. Compared with that of the
highly susceptible line, the measured activities of these three antioxidases were generally higher in the slightly
susceptible line (except for POD at 12 to 24 days).
Pathogenesis-related (PR) proteins such as chitinases, glucanases and defensins are important to improve
resistance to fungal diseases in many plants, including wheat. In the current study, 64 DEGs associated with
PR protein was detected, including PR-1, PR-2, PR-3, PR-4, PR-5, PR-6, PR-12, PR-13, PR-14 and PR-15, among
which, 47 (73.4%) had up-regulated expression in the slightly susceptible kernels, especially three PR genes (PR1,
Tm-AMP-D1.2 and Chi11) validated via RT-qPCR (Fig. 5, Table S10). Defensing, including Tm-AMP-D1.2, is
the most important antimicrobial peptide family involved in defense functions and is postulated to be involved
in defense against fungal and bacterial pathogens and insect pests30,31. Chitinase genes (Chi) have also been
reported to play important roles in defense reactions. Ghorbel et al. (2020) isolated a novel PR gene (TdPR1.2)
from a durum wheat variety that exhibits an antibacterial effect against eight different bacteria and the fungi
Septoria tritici32. In another study, the expression of PR1.2 and Chi-1 was significantly increased in the resistant
wheat cultivar after inoculation with F. graminearum33. Future studies will therefore investigate and focus on the
role of these genes in resistance to black point.
Numerous studies have reported that symptoms of black point result from enzymatic b rowning34–37. Under
normal growth conditions, the production of blackening substances that cause black point symptoms is not
evident even though plants normally contain both the enzymes (POD and polyphenol oxidase) and the sub-
strates (various phenolic compounds) for enzymatic browning. The suggested reasons for lack of reaction mainly
include: (i) compartmentalization of enzyme and substrate in different parts of the cell38,39, and (ii) the enzyme is
present in an inactive form requiring activation39,40. Under the inoculation condition, a failure to effectively elimi-
nate excessive ROS can cause protein and lipid peroxidation or even cell d eath41. This study showed that activity
of antioxidant enzymes, including SOD, CAT, and POD, were increased by inoculation with B. sorokiniana to
respond with oxidative stress in wheat kernels. The activities of the antioxidant enzymes in the slightly susceptible
line were higher than those in the highly susceptible line, so the excessive ROS caused by B. sorokiniana were
eliminated more efficiently in the slightly susceptible line than that in the highly susceptible line during the kernel
filling stage. Strong antioxidant capacity associated with resistance mechanism to black point, also been reported
in other studies. Mak et al. used proteomic analysis to identify the proteins from black point-affected and -free
grains of the susceptible wheat cultivar SUN239V. They found that of 12 functional classes to which the differ-
entially abundant proteins were assigned the largest was the ‘stress’ class (i.e., gene products of genes associated
with stress, disease and defense)10. Higher levels of these ‘stress’ proteins were found in black point-free grains,
suggesting that increased levels of these proteins might afford protection from the disease, which was consistent
with the higher expression of PR genes in slightly susceptible kernels in the current study. Therefore, we suggest
that the membrane system integrity of the susceptible line was destroyed because the excessive ROS could not
be eliminated quickly; this was reflected by the higher malondialdehyde content in the susceptible l ine42, which
led to the substrates in contact with the enzyme of enzymatic browning to produce blackening substances. This
result is also supported by our GO analysis, which revealed enrichment in cellular component terms associated
with the plasma membrane and cytoplasmic membrane-bound vesicles (Fig. 5d).
Some candidate genes for black point resistance have been identified through BLAST against the National
Center for Biotechnology Information (NCBI, http://w ww.n
cbi.n
lm.n
ih.g ov/) and European Nucleotide Archive
(ENA, http://www.ebi.ac.uk/ena) databases, using the flanking sequences of SNP markers significantly associ-
ated with black point reaction as q ueries16,17,19. These candidate genes could be divided into different groups. For
example, genes related to (i) enzymes needed in enzymatic browning, including POD and PPO; (ii) the signal
transduction pathways of plant hormones, including gibberellin biosynthetic genes, F-box repeat and serine/
threonine-protein kinase and its receptor; (iii) defense mechanisms during stress response in plants, including
zinc finger proteins, disease resistance RPP8-like protein, U-box domain-containing protein, and MYB tran-
scription factor16,17,19, which was supported by results of the current study. There were 19, 3, 15, 81, 68, 137, 7,
13, and 31 genes related to POD, PPO, gibberellin biosynthesis, F-box protein, serine/threonine-protein kinase
and associated receptor, zinc finger protein, RPP8-like protein, U-box domain-containing protein, and MYB
transcription factor, respectively, which were differentially expressed between the slightly and highly susceptible
wheat lines after inoculation with B. sorokiniana (Fig. 4e, Supplementary Table S10).
Scientific Reports | (2021) 11:6911 | https://doi.org/10.1038/s41598-021-86303-1 9
Vol.:(0123456789)www.nature.com/scientificreports/
Here, we describe that resistance to B. sorokiniana-caused black point in wheat was predominately related to
the plant counteracting oxidative stress. However, the biological processes and metabolic pathways involved in
coping with oxidative stress in plants is complicated, which is indicated by the variety of GO and KEGG enrich-
ment terms uncovered in this study. Thus, more detailed experimental analyses are required to confirm the
specific involvement of specific metabolic pathways in resistance to black point, using more suitable materials
such as mutants and NILs.
Materials and methods
Plant materials and field management. Two wheat lines, SN4143 and PZSCL6, were screened from
403 wheat genotypes, which was resistant and susceptible under the natural field condition in 2010–20127. The
seeds were provided by Henan Academy of Agricultural Science, China. The average incidence of black point
in SN4143 and PZSCL6 was 46.8% (highly susceptible) and 6.75% (slightly susceptible), respectively, under
conditions of inoculation with B. sorokiniana from 2016 to 2017 in Henan Province, China. Twenty-one major
resistant marker-trait associations were identified by genome-wide association study in line SN4143, whereas 11
ZSCL619. These two wheat lines were planted in six 2 m long rows spaced
were identified in the susceptible lines P
20 cm apart (50 seeds per row) during the 2018–2019 season in an experimental field of Henan Agricultural Uni-
versity (113° 42′ E, 34° 44′ N), Zhengzhou, Henan Province, China. Seeds were planted in the middle of October
and harvested at the beginning of June. The experiment was repeated three times.
Symptom induction of the black point. Fungal isolate Ta-BP33, representing B. sorokiniana11, was
selected as the experimental pathogen. Ta-BP33 was cultured on potato dextrose agar medium in a 9-cm Petri
dish and incubated for 10 to 12 days in a dark growth chamber at 25 ± 1 °C. Conidial suspensions were pre-
pared as in Mahto et al.43, and the concentration was standardized to 3 × 10⁵ conidia per mL. Inoculation was
performed using a previously reported method44. Briefly, at Zadoks growth stage GS 5545, 150 spikes from each
wheat line of each replicate were covered with sulfuric acid-paper bags (five spikes per bag) to prevent contami-
nation. Subsequently, at GS 65, spikes were inoculated with conidial suspensions using a hand sprayer until they
were dripping (the control was treated with sterile distilled water) and were then covered with transparent plastic
bags for 5 days to maintain humidity.
Sample preparation and RNA extraction. At 0, 1, 3, 6, 9, 12, 15, 18, 21, and 24 days after inoculation,
kernels inoculated with B. sorokiniana from both lines were selected, frozen immediately in liquid nitrogen, and
stored at − 80 °C. Bulk samples at different days after inoculation from both lines (designated R0, R1, R3, R6, R9,
R12, R15, R18, R21, and R24 for the slightly susceptible line and S0, S1, S3, S6, S9, S12, S15, S18, S21, and S24
for the highly susceptible line) were prepared with three biological replicates for a total of 60 samples. Each bulk
included 15 independent individuals. Samples of 0, 1, 3, and 12 days (24 samples) were used for transcriptome
sequencing, those of 0, 1, 3, 12, and 18 days (30 samples) were used for RT-qPCR, and all 60 samples were used
for analysis of enzyme activity and observation of symptom development of black point.
Total RNA was extracted as described by Li et al.21. DNA was removed with DNase treatment (Invitrogen,
Shanghai, China). RNA concentration and integrity were measured using a NanoDrop 2000 (NanoDrop Technol-
ogies, Wilmington, DE, USA) and an RNA Nano 6000 Assay Kit (Agilent Technologies, CA, USA), respectively.
Transcriptome sequencing and data analysis. Twenty-four mRNA libraries were constructed,
sequenced, and clean reads obtained according to the procedure of Li et al.46. The clean reads were mapped
to the reference wheat genome version, IWGSC_RefSeq_v1.0. (https://urgi.versailles.inra.fr/download/iwgsc/
IWGSC_RefSeq_Assemblies/v1.0/).
Annotation of the transcriptome sequences was performed using homologous sequences obtained by BLAST
searching47 against eight public databases: Non-Redundant Protein; Swiss-Prot; GO; Cluster of Orthologous
Genes; Eukaryotic Orthologous Groups; Protein Family; Evolutionary Genealogy of Genes: Non-supervised
Orthologous Group; and KEGG. The biological pathways (with reference to the KEGG database) of the new
genes were analyzed using KOBAS2.048 and their amino acid sequences were predicted and annotated using
HMMER49. Quantitative gene expression was calculated using F PKM50.
Pairwise difference analysis was conducted on gene expression levels among the four groups using DESeq
R packages51. DEGs were identified by FC (|Log2FC|≥ 1) and FDR ≤ 0.01 parameters. PCC and PCA were per-
formed to evaluate the indices of biological repetition correlation52,53. A |Log2FC|≥ 2 was chosen as the threshold
value for performing gene co-expression analysis by K-means clustering46,54. All transcriptome data analyses used
BMKCloud (www.b ioclo
ud.n
et). The BioProject ID of the transcriptome sequence data in NCBI is PRJNA664832.
RT‑qPCR. Samples from both lines at five time points (0, 1, 3, 12, and 18 days after inoculation) were pre-
pared for RT-qPCR. All primers were designed using Premier 5.0 (http://www.premierbiosoft.com/primerdesi
gn/index.html; primer information is shown in Supplementary Table S11). Reverse transcription was carried
out as described by Li et al.46. RT-qPCR reactions were carried out in a total volume of 20 μL, with the actin
gene used as an internal control. Gene expression levels were calculated according to the 2 −ΔΔCT method55. All
RT-qPCR reactions are replicated thrice.
Determination of enzyme activity. Wheat kernels (0.5 g) were homogenized in 5 mL of phosphate
buffer at pH 7.6 for SOD, pH 6.0 for POD, and pH 6.8 for CAT. Enzyme activities were measured spectropho-
tometrically (UV-5200, Metash Instruments Co. Ltd, Shanghai, China) by specific methods. SOD activity was
Scientific Reports | (2021) 11:6911 | https://doi.org/10.1038/s41598-021-86303-1 10
Vol:.(1234567890)www.nature.com/scientificreports/
estimated as the inhibition of photochemical reduction of nitroblue tetrazolium (NBT) at 560 nm, according
to Beauchamp and Fridovich56. One unit of SOD was equivalent to the enzyme concentration that caused 50%
photoreduction of NBT. POD activity was estimated as described by Zhang and Q u57. The reaction mixture
contained phosphate buffer (pH 6.0), guaiacol (1.25%, v/v), and 0.1 mM H 2O2, and activity was determined
by measuring the oxidation products of guaiacol (extinction coefficient, 26.6 mM−1 cm−1) at 470 nm. Enzyme
activity was calculated as µmol oxidation products formed mg−1 protein m in−1. CAT activity was detected via
58
the method of Cakmak and Horst . The reaction mixture (3 mL) contained 1.5 mL of phosphate buffer (pH
6.8) and 1 mL of 0.2% H 2O2 (extinction coefficient, 39.4 mM−1 cm−1)
2O2. CAT activity was calculated as µmol H
−1 −1
decomposed mg protein m in .
Statement of ethical standards. The two wheat lines provided by Henan Academy of Agricultural Sci-
ences in the experiment are the materials we have been using for many years in our breeding. We declare that
these experiments comply with the ethical standards in China.
Conclusions
Here, we used comparative transcriptome analysis to identify DEGs in black point -slightly and -highly sus-
ceptible wheat lines inoculated with B. sorokiniana. We determined the top GO database enrichment terms for
biological processes as oxidation–reduction process, response to cold, salt stress, oxidative stress, and cadmium
ion. Moreover, we showed that the activities of antioxidant enzymes, including SOD, CAT, and POD, were higher
in the slightly susceptible lines than those in the highly susceptible lines. These results indicate that resistance
to B. sorokiniana-induced black point in wheat was predominately related to the ability to respond to oxidative
stress. This study presents new insights for understanding the resistance mechanisms of selected wheat lines to
black point.
Received: 31 October 2020; Accepted: 12 March 2021
References
1. Statler, G. D., Kiesling, R. L. & Bosch, R. H. Inheritance of black point resistance in durum wheat. Phytopathology 65, 627–629
(1975).
2. Solanki, V. A., Augustine, N. & Patel, A. A. Impact of black point on wheat trade and its management. Indian Phytopathol. 59,
44–47 (2006).
3. El-Gremi, S. M., Draz, I. S. & Youssef, W. A. E. Biological control of pathogens associated with kernel black point disease of wheat.
Crop Protect. 91, 13–19 (2017).
4. Li, Q. Y. et al. Assessing genetic resistance in wheat to black point caused by six fungal species in the Yellow and Huai wheat area
of China. Plant Dis. 104(12), 3131–3134 (2020).
5. Conner, R. L. & Davidson, J. G. N. Resistance in wheat to black point caused by Alternaria alternata and Cochliobolus sativus. Can.
J. Plant Pathol. 68, 351–359 (1988).
6. Rees, R. G., Martin, D. J. & Law, D. P. Black point in bread wheat. Effects on quality and germination and fungal associations. Aust.
J. Exp. Agric. Anim. Husb. 24, 601–605 (1984).
7. Li, Q. Y. et al. Screening wheat genotypes for resistance to black point and the effects of diseased kernels on seed germination. J.
Plant Dis. Protect. 121, 79–88 (2014).
8. Palacios, S. A. et al. Genetic variability and fumonisin production by Fusarium proliferatum isolated from durum wheat grains in
Argentina. Int. J. Food Microbiol. 201, 35–41 (2015).
9. Masiello, M. et al. Molecular identification and mycotoxin production by Alternaria species occurring on durum wheat, showing
black point symptoms. Toxins 12, 275 (2020).
10. Mak, Y. et al. Black point is associated with reduced levels of stress, disease- and defence-related proteins in wheat grain. Mol.
Plant Pathol. 7, 177–189 (2006).
11. Xu, K. G. et al. Identification and pathogenicity of fungal pathogens causing black point in wheat on the North China Plain. Indian
J. Microbiol. 58, 159–164 (2018).
12. Somma, S., Amatulli, M. T., Masiello, M., Moretti, A. & Logrieco, A. F. Alternaria species associated to wheat black point identified
through a multilocus sequence approach. Int. J. Food Microbiol. 293, 34–43 (2019).
13. Sisterna, M. N. & Sarandon, S. J. Preliminary studies on the natural incidence of wheat black point under different fertilization
levels and tillage systems in Argentina. Plant Pathol. J. 4, 26–28 (2005).
14. Li, Q. Y. et al. Key periods and effects of meteorological factors affecting incidence of wheat black point in the Yellow and Huai
wheat area of China. Crop Protect. 125, 104882 (2019).
15. Lehmensiek, A. et al. QTLs for black-point resistance in wheat and the identification of potential markers for use in breeding
programs. Plant Breed. 123, 410–416 (2004).
16. Liu, J. D. et al. Genome wide linkage mapping of QTL for black point reaction in bread wheat (Triticum aestivum L.). Theor. Appl.
Genet. 129, 2179–2190 (2016).
17. Liu, J. D. et al. Genome-wide association mapping of black point reaction in common wheat (Triticum aestivum L.). BMC Plant
Biol. 17, 220 (2017).
18. Lv, G. G. et al. Identification of genetic loci of black point in Chinese common wheat by genome-wide association study and linkage
mapping. Plant Dis. 104, 2005–2013 (2020).
19. Li, Q. Y. et al. GWAS for resistance against black point caused by Bipolaris sorokiniana in wheat. J. Cereal Sci. 91, 105859 (2020).
20. Wang, S. Y. et al. Genetic analysis and detection of resistance loci for black point in wheat genotype Shannong. Acta Phytopathol.
Sin. https://doi.org/10.13926/j.cnki.apps.000359 (2020).
21. Li, X. et al. Transcriptome analysis identifies a 140 kb region of chromosome 3B containing genes specific to Fusarium head blight
resistance in wheat. Int. J. Mol. Sci. 19, 852–870 (2018).
22. Sharma, C. et al. A study of transcriptome in leaf rust infected bread wheat involving seedling resistance gene Lr28. Funct. Plant
Biol. 45, 1046–1064 (2018).
23. Hill-Ambroz, K. et al. Expression analysis and physical mapping of a CDNA library of Fusarium head blight infected wheat spikes.
Crop Sci. 46(S1), 15–26 (2006).
24. Erayman, M. et al. Transcriptome analysis of wheat inoculated with Fusarium graminearum. Front. Plant Sci. 6, 867 (2015).
Scientific Reports | (2021) 11:6911 | https://doi.org/10.1038/s41598-021-86303-1 11
Vol.:(0123456789)www.nature.com/scientificreports/
25. Wright, D., Baldwin, B., Shephard, M. & Scholes, J. Source-sink relationships in wheat leaves infected with powdery mildew. I.
Alterations in carbohydrate metabolism. Physiol. Mol. Plant Pathol. 47, 237–253 (1995).
26. Kumar, S. et al. Lr1-mediated leaf rust resistance pathways of transgenic wheat lines revealed by a gene expression study using the
Affymetrix GeneChip wheat genome array. Mol. Breed. 34, 127–141 (2014).
27. Ye, W. et al. Disclosure of the molecular mechanism of wheat leaf spot disease caused by Bipolaris sorokiniana through comparative
transcriptome and metabolomics analysis. Int. J. Mol. Sci. 20, 6090 (2019).
28. Mittler, R. Oxidative stress, antioxidants and stress tolerance. Trends Plant Sci. 7, 405–410 (2002).
29. Gherbawy, Y., El-Tayeb, M., Maghraby, T., Shebany, Y. & El-Deeb, B. Response of antioxidant enzymes and some metabolic activi-
ties in wheat to Fusarium spp.. Acta Agron. Hung. 60, 319–333 (2012).
30. Odintsova, T. I. et al. Defensin-like peptides in wheat analyzed by whole-transcriptome sequencing: A focus on structural diversity
and role in induced resistance. PeerJ 7, e6125 (2019).
31. Vriens, K., Cammue, B. P. A. & Thevissen, K. Antifungal plant defensins: Mechanisms of action and production. Molecules 19,
12280–12303 (2014).
32. Ghorbel, M. et al. Differential regulation of the durum wheat Pathogenesis-related protein (PR1) by Calmodulin TdCaM1.3 protein.
Mol. Boil. Rep. https://doi.org/10.1007/s11033-020-06053-7 (2020).
33. Soltanloo, H. et al. The expression profile of Chi-1, Glu-2, Glu-3 and PR1.2 genes in Scab-resistant and susceptible wheat cultivars
during infection by Fusarium graminearum. Plant Omics J. 3, 162–166 (2010).
34. Williamson, P. M. Black point of wheat in vitro production of symptoms, enzymes involved, and association with Alternaria
alternata. Aust. J. Agric. Res. 48, 13–19 (1997).
35. Walker, J. R. L. & Ferrar, P. H. Diphenol oxidase, enzyme-catalysed browning and plant disease resistance. Biotechnol. Genet. Eng.
15, 457–498 (1998).
36. Walker, K. R. Regulation of candidate genes in black point formation in barley. Doctoral Dissertation, the University of Adelaide,
Adelaide, Australia (2011).
37. Li, Q. Y. et al. Enzymatic browning in wheat kernels produces symptom of black point caused by Bipolaris sorokiniana. Front.
Microbiol. 11, 526266 (2020).
38. Mayer, A. M. & Andharel, E. Polyphenol oxidases in plants. Phytochemistry 18, 193–214 (1979).
39. Vaughn, K. C. & Duke, S. O. Function of polyphenol oxidase in higher plants. Physiol. Plant. 60, 106–112 (1984).
40. Vámos-Vigyázó, L. & Haard, N. F. Polyphenol oxidase and peroxidase in fruits and vegetables. Crit. Rev. Food Nutr. 15, 49–127
(1981).
41. Deslile, G., Champoux, M. & Houde, M. Characterization of oxalate oxidase and cell death in Al-sensitive and tolerant wheat
roots. Plant Cell Physiol. 42, 324–333 (2001).
42. Wang, J. et al. Study on the PPO activity, content of MDA and phenolics in wheat ears with different resistance to black point after
inoculation with Alternaria alternate. Henan Sci. 25, 423–426 (2007) ((in Chinese)).
43. Mahto, B. N., Gurung, S. & Adhikari, T. B. Assessing genetic resistance to spot blotch, Stagonospora nodorum blotch and tan spot
in wheat from Nepal. Eur. J. Plant Pathol. 131, 249–260 (2011).
44. Li, Q. Y. et al. A method for joint identification of wheat resistance to black point and leaf blight disease caused by Bipolaris sorokiniana,
ZL2015105396457 (Henan Agricultural University (in Chinese), 2019).
45. Zadoks, J., Chang, T. & Konzak, C. A decimal code for the growth stages of cereals. Weed Res. 14, 415–421 (1974).
46. Li, J. C. et al. Gene expression profiles and microRNA regulation networks in tiller primordia, stem tips, and young spikes of wheat
Guomai 301. Genes 10, 686 (2019).
47. Altschul, S. F. et al. Gapped BLAST and PSI BLAST: A new generation of protein database search programs. Nucleic Acids Res. 25,
3389–3402 (1997).
48. Xie, C. et al. KOBAS 2.0: A web server for annotation and identification of enricheded pathways and diseases. Nucleic Acids Res.
39(S2), 316–322 (2011).
49. Eddy, S. R. Profile hidden Markov models. Bioinformatics 14, 755–763 (1988).
50. Florea, L., Song, L. & Salzberg, S. L. Thousands of exon skipping events differentiate among splicing patterns in sixteen human
tissues. F1000 Res. 2, 188 (2013).
51. Anders, S. & Huber, W. Differential expression analysis for sequence count data. Genome Biol. 11, R106 (2011).
52. Pearson, E. The test of significance for the correlation coefficient. J. Am. Stat. Assoc. 26, 128–134 (1931).
53. Zou, H., Hastie, T. & Tibshirani, R. Sparse principal component analysis. J. Comput. Graph. Stat. 15, 265–286 (2006).
54. Hartigan, J. A., Wong, M. A. & Algorithm, A. S. A K-means clustering algorithm: Algorithm as 136. Appl. Stat. 28, 100–108 (1979).
55. Livak, K. J. & Schmittgen, T. D. Analysis of relative gene expression data using real-time quantitative PCR and the 2−ΔΔCT method.
Methods 25, 402–408 (2001).
56. Beauchamp, C. & Fridovich, I. Superoxide dismutase: Improved assays and applicable to acrylamide gels. Anal. Biochem. 44,
276–287 (1971).
57. Zhang, Z. L. & Qu, W. J. Experimental Guidance of Plant Physiology (Higher Education Press, 2003).
58. Cakmak, I. & Horst, W. J. Effect of aluminum on lipid peroxidation, superoxide dismutase, catalase, and peroxides activities in
root tips of soybean (Glycine max). Physiol. Plant. 83, 463–468 (1991).
Acknowledgements
This work was funded by the Scientific and Technological Project in Henan Province, China (202102110021) and
the Special Fund for Key Agricultural Projects in Henan Province, China (No. 201300110800).
Author contributions
C.W. supervised the experiments; G.Y. cultured the pathogen and revised the manuscript; Q.L. performed field
experiment and wrote the manuscript; C.G. and K.X. completed RNA-seq; Y.J. measured the antioxidant enzyme
activity; J.N. performed data analyses. All authors revised the manuscript and approved the final manuscript.
Competing interests
The authors declare no competing interests.
Additional information
Supplementary Information The online version contains supplementary material available at https://doi.org/
10.1038/s41598-021-86303-1.
Correspondence and requests for materials should be addressed to G.Y. or C.W.
Reprints and permissions information is available at www.nature.com/reprints.
Scientific Reports | (2021) 11:6911 | https://doi.org/10.1038/s41598-021-86303-1 12
Vol:.(1234567890)You can also read