Towards a cleaner Public Transportation System for Costa Rica - DR. RENÉ CASTRO SALAZAR Minister of Environment, Energy and Telecommunications
←
→
Page content transcription
If your browser does not render page correctly, please read the page content below
Towards a cleaner Public
Transportation System for
       Costa Rica
       DR. RENÉ CASTRO SALAZAR
   Minister of Environment, Energy and
           Telecommunications

                                 December 2012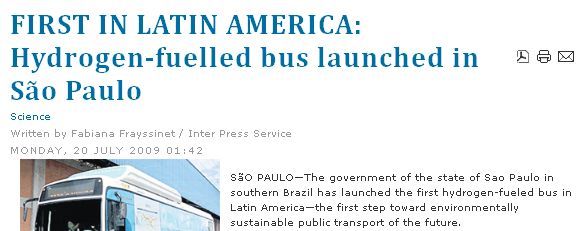
Capital intensity by abatement measure

http://petrolog.typepad.com/climate_change/2009/09/the-cost-of-abating-greenhouse-gases.html
MINAET

                                            Costa Rica: Abatement Curve-

 1 Conversión a LPG                        12 Cambio de lámparas                 23 Car Pooling
 2 Jornada laboral 4 días                  13 Uso de sistemas fotovoltaicos      24 Plan de ahorro energético
 3 Cambio de Residencia                    14 Agilización Trámites               25 Uso de calderas más eficientes
 4 Uso de lámparas más eficientes          15 Incremento Marchamo                26 Biodiesel
 5 Uso de motores más eficientes           16 Vehículos Aire
 6 Uso de A/C de bajo consumo                                                    27 Bioetanol
                                           17 Vehículos Eléctricos
 7 Cambio de cocinas a vitro cerámica      18 Transporte Público                 28 Flex Fuel
 8 Conducción Eficiente                    19 Descongestionamiento               29 Establecimiento de tarifas y precios
 9 Refrigeradoras más eficientes           20 Ciclovías                          30 Híbridos
10 Capacitación en el sector educación     21 Restricción a circulación S. J.    31 Tren Eléctrico
11 Uso de timers en calentadores de agua   22 Restricción a circulación C. R     32 Sustituir Bunker: 50% Gas Natural, 50% Electricidad

Fuente: Estudio para la Introducción de Tecnologías Limpias y Eficientes en el Mercado Nacional, realizado por                      3
        CONSENERGY GROUP para la DSE, diciembre 2009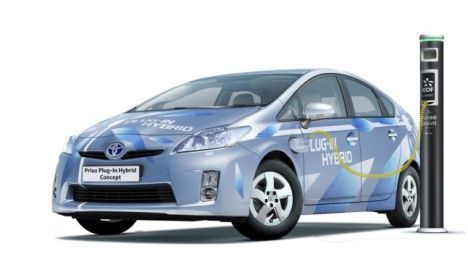
CO2 Emissions per unit of GDP (Kg /$1000 of 2005 PPP)
                                                                                                CO2 emissions per
                                   1100
                                   1050                                                         unit of GDP COSTA
                                   1000                                                         RICA
                                    950                                                         CO2 emissions per
   CO2 Emissions per unit of GDP

                                    900                                                         unit of GDP USA
                                    850
                                    800                                                         CO2 emissions per
                                    750                                                         unit of GDP UK
                                    700
                                    650                                                         CO2 emissions per
                                    600
                                    550                                                         unit of GDP CHILE
                                    500
                                    450                                                         CO2 Emissions per
                                    400                                                         unit of GDP CHINA
                                    350
                                    300                                                         CO2 Emissions per
                                    250                                                         unit of GDP
                                    200
                                    150                                                         GERMANY
                                    100                                                         CO2 emissions per
                                                                                                unit of GDP BRASIL
                                      2002    2003     2004    2005     2006    2007     2008
Fuente World Band data finder 2.5, MINAET 2012
                                                               Year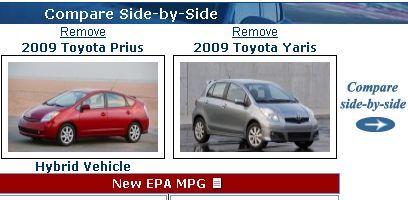
Goal: Costa Rica CO2 neutral by 2021
CO2 Emissions per unit of GDP (Kg /$1000 of

                                              200
                                              190                                             Lower
                                              180      185                                   Intensity
                                                             180                                                 Lowest
                                                                   17                        CO2/PIB
                                                                                                                Intensity
                                              160                  1                                            CO2/PIB
                                                                                                                            CO2 neutral
                                              140
                2005 PPP)

                                              120

                                              100

                                              80                                                           Carbon neutral growth

                                              60

                                              40

                                              20

                                               2002    2004    2008     2010   2012   2014    2016       2018      2020       2022… 2050

            In the transition to economic competitiveness economic sectors can reduce their
                            emissions intensity and increase their share in GDP
Our greatest source of emissions is the
     Energy Sector: TRANSPORTATION
                                                                  GHG emissions by Sector

                                                                               5%

                                                            46%
                                                                                                  38%

        Agriculture
Thermal     3%
 Energy
   4%            Other                                                        11%
                  6%

   Industry                                                       Industrial Procesess   Agriculture
     18%
                                                                  Waste Management       Energy
                           Transport
                              69%

Source: Reporte Needs 2010/ Segunda Comunicación Nacional 2009
Promote cleaner and efficient
technologies and fuels
1 - Improving energy efficiency using current technologies:
engine modification, improve transmissions, aerodynamics ...
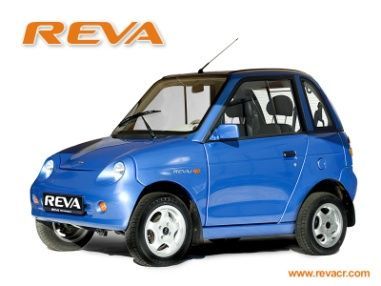
2 - New fuels and cleaner vehicles: electric, hybrid ...
3 - Introduction of cleaner fuels: 2nd generation bio-fuels, LPG,
LNG,hydrogen, etc.
4 - Consumer information, labeling
5 - "Eco-driving" & Education
6- Mass Tranport System
New energy efficient vehicles
• Comparison of
hybrid vehicle with
a gasoline vehicle
• 42% less CO2
emissions in case of
Prius!
8
Source: fueleconomy.gov
New energy efficient vehicles
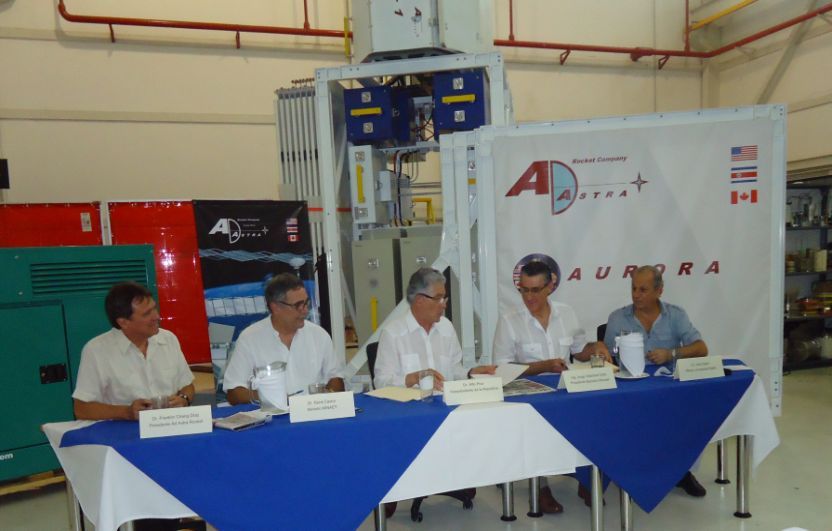
• In Costa Rica there is a research
going between the National Oil
Refinery (RECOPE),Ad Astra
Rocket (NASA technology) and
Cummins to use hydrogen and
methane as fuel on engines for
heavy transport cargo.
Source: Business Mirror. 2009.
9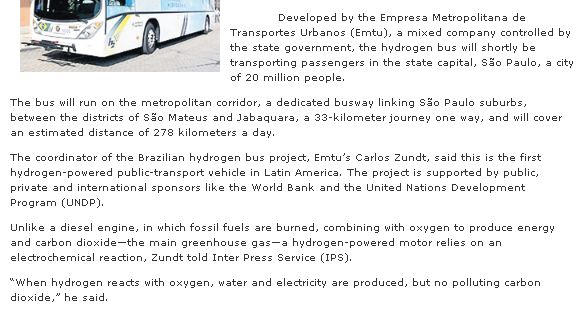
Introduction of cleaner fuels

    Low sulphur content & unleaded fuel

-    It has a direct effect on emissions

-    Allows use of vehicles with new technologies
    which significantly reduce pollutants

                                                    10
Introduction of cleaner fuels
Effect of sulfur on the life of vehicle
Sulfur decreased from 15.000 to 1.000 ppm (1.5% to 0.1%) leads to an
increased useful life of a vehicle in a 80 to 90%
http://www.fleetwatch.co.za/supplements/SADiesel/DieselFactsFictionS.htm
11Overall trend with respect to the
objectives of sulphur
12Costa Rican Studies reveal the IRR for different
technologies in taxis,
March 2012
250% 236%
200% 163%
150% 123%
100% 61%
50% 35% 32% 28% 18%
0%
Fuente: Encuesta aplicada a concesionarios de taxi, CINPE-2012, INS, CCSS, Ministerio de HaciendaNeed to renovate Public Transport
System in C.R.
Quatity of Taxis and ages
1,400
1,200
1,000
Quantity of buses and ages
800
600
400 1,200
200 1,000
0
800
1994
1995
1996
1997
1998
1999
2000
2001
2002
2003
2004
2005
2006
2007
2008
2009
2010
2011 600
400
200
0
1990
1991
1992
1993
1994
1995
1996
1997
1998
1999
2000
2001
2002
2003
2004
2005
2006
2007
2008
2009
2010
2011
Source: DSE 2010.100
US$/tCO2e Abatement costs curve
50
- 50
- 100
120,000,000
- 150 20,000,000 40,000,000 60,000,000 80,000,000 100,000,000
Source: DSE, MINAET, ICE, PRUGAM, MOPT Cumulative mitigation 2010-2030 tCO2eWe are working on a NAMA for the public transportation sector
Short term Medium term Long term
International Actions
Financing of Transportation NAMA
COP17 Durban Verification Verification Verification Verification
Rio+20
2010 2011 2012 2014 2016 2018 2020 2022 2 2026 2028 2030 2032
0
2
4
Report and Monitoring Report and Monitoring
National Actions
Transportation NAMA
Nama Proposal Report and Monitoring Report and Monitoring
Communication and
educational strategy
NAMA Execution
Definition of Transportation Policy
PND 2010-2014You can also read


