Today I Learned About The Electric Grid - MIT Climate Portal
←
→
Page content transcription
If your browser does not render page correctly, please read the page content below
Today I Learned About The Electric Grid

Load-Balancing Game
    Materials
    • Small objects that can be passed easily from hand-to-hand. Ping-pong balls, poker
      chips, etc. Two per participant.
    Setup
    • Participants stand in a rough circle with some space between them. If a circle is not
      possible, make sure there is a clear order in which people are standing.
    • The Electric Utility has a bucket with all the objects, plus two cups with a few extras.
    Roles
    • Narrator: Reads the script and directs the Electric Utility in passing out electricity.
    • Electric Utility: Has the bucket of objects and passes them out as instructed.
    • Buildings: Everyone else.
    Playing the Game
    • For each Phase, the Narrator reads the script, the Electric Utility follows the Narrator’s
      directions, and the Buildings take the amount of electricity indicated.
Game Script & Instructions
Phase 1

    Narrator Script                                                   Electric Utility Action

    You each represent a building. Take 15 seconds to decide
    what kind of building you are.
    This represents electricity. Take 15 seconds to think about       Narrator holds up bucket
    how your building would use electricity.                          of objects.
    {Name} is the electric power plant, or electric utility.          Narrator hands bucket of
    They generate electricity and send it through the wires to        objects to Electric Utility.
    your buildings.
    Today is a nice, temperate day. Not too hot, not too cold.        Pass objects at a steady
    You don’t need the air conditioning on, and you probably          pace, such that everyone
    don’t need the heat either. As we pass electricity around         gets an item, and no one
    the circle, take one piece. If you have a piece, pass on to the   has to wait too long.
    next person. You do not need more than one, and you do
    not have batteries to store extra electricity.
    Our electric grid is balanced today. Our utility is producing     Gather all objects back.
    enough electricity that you all get what you need and there
    isn’t any extra.

1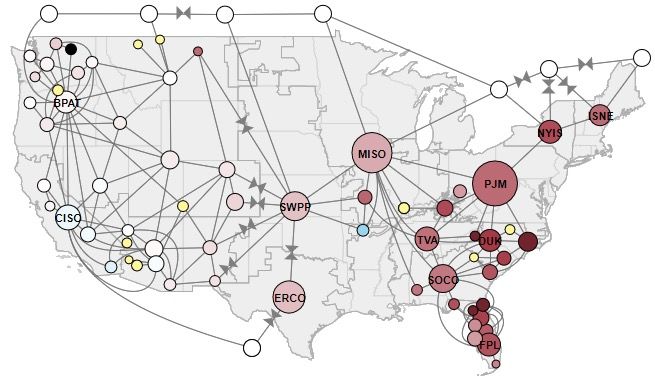
Today I Learned About The Electric Grid

Load-Balancing Game, cont’d

    Phase 2
    Narrator Script                                                  Electric Utility Action

    Today it is very hot. You need two times the electricity         Pass objects at a faster
    because you are running the air conditioner.                     pace, such that everyone
                                                                     gets two items, and no
                                                                     one has to wait too long.
    Our electric grid has to work a lot harder to stay balanced      Gather all objects back.
    today. It is managing to produce enough electricity.
    So far, we’ve been using an on-demand energy source like
    natural gas to power our electric grid. But, when we burn
    natural gas or coal for electricity, we release carbon dioxide
    into the atmosphere. Carbon dioxide acts like a blanket,
    trapping heat. The trapped heat is changing our climate. To
    release less carbon dioxide, this power plant is shifting over
    to a combination of wind and solar electricity.

    Phase 3
    Narrator Script                                                  Electric Utility Action

    When we first started using wind and solar, though, we ran
    into a problem. Let’s say it’s a warm cloudy day, so some
    people are running their air conditioners. The wind comes
    and goes over the course of the day, and the clouds mean
    there’s a little less solar energy available.
    If you are running your air conditioner, you need two            Pass objects in fits and
    pieces. If you are not, you only need one.                       starts – three at a time,
                                                                     and then a gap, then
                                                                     four, and then two, and
                                                                     so on.
    Who has enough electricity? Who needs more?                      Gather all objects back.

2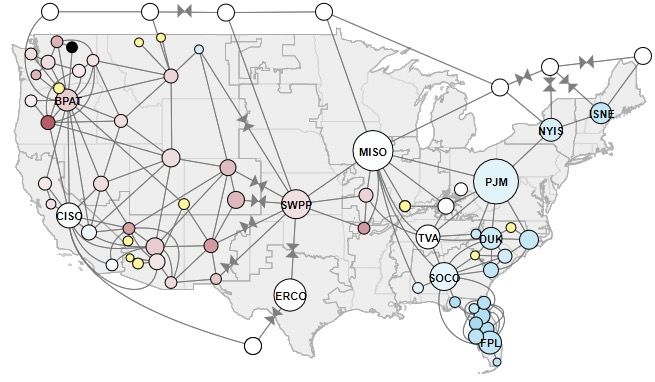
Today I Learned About The Electric Grid

Load-Balancing Game, cont’d

    Phase 4
    Narrator Script                                                Electric Utility Action

    Let’s fast forward.                                            Hold up first cup with
    We have our wind and solar, but now we’ve learned how to       extra objects.
    store the extra electricity from when the sun is really
    shining, or the wind is really blowing.
    We have hydroelectricity from dams, and nuclear power.         Hold up second cup with
                                                                   extra objects.
    Our electricity needs are lower, too - even when it is hot,    Pass objects from the
    fewer buildings need air conditioning because of how           bucket and both cups at
    they’re designed. We use super-efficient lights, appliances,   a steady pace.
    and machines. You only need one piece of electricity each.
    Our electric grid is balanced, and we are using fewer fossil   Gather all objects back.
    fuels, which means we are not adding to the carbon dioxide
    blanket.

Wrap-Up Questions
    • What are some of the challenges to balancing an electric grid?
    • As we add more solar and wind energy to our electric mix, what technology will help
      balance the grid?
    • Why is it important to make buildings and systems more efficient?
    • What kinds of energy do you think make most of the electricity that we use in our
      community?

3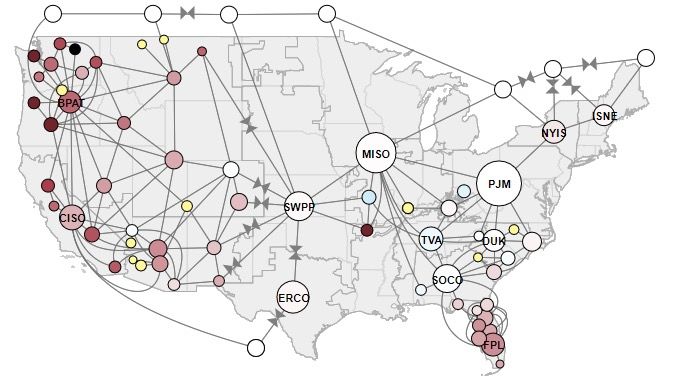
Today I Learned About The Electric Grid

        “Most people rate the creation of the electric power grid as probably
        the number one thing that happens in the 20th century.
        We would build larger and larger electric power plants, and these
        were powered either by burning fossil fuels-- oil, gas, coal -- and
        using those to create steam in a boiler and the boiler steam would
        turn a generator -- an electric turbine -- and in the process would
        create the flow of electrons.”
        Harvey Michaels
        TILclimate podcast: Today I Learned About The Electric Grid

A Brief History of the Electric Grid in the United States

    1880s    Electric lights first used for public streets in Cleveland, OH.
             First electric power stations in New York City and San Francisco, burning coal.
             Inventions: Incandescent lightbulb, carbon filament, Alternating Current (AC),
             steam turbine generator, many other parts of electric generation and conduction.
    1890s    Chicago World’s Fair is lit with electric light for the first time.
             Power plants and lines are built for major cities.
    1900s    Continued expansion of city electric grids.
             Inventions: electric vacuum cleaners, washing machines, electric cars.
    1910s    Continued expansion of gas and oil turbines for city electricity.
             Inventions: electric air conditioners, refrigerators.
    1920s    Electric utilities begin to interconnect between cities.
             Growth of hydroelectric plants/dams.
             Inventions: Traffic lights, camera flash bulbs, early televisions.
    1930s    Rural Electrification Act gives loans to farmer cooperatives for electricity.
             Only 10% of rural America has electricity.
             Inventions: Clothes dryers, frozen foods.
    1940s    Growth of farmer cooperatives developing electric grids throughout rural areas.
             Inventions: Color television, the Z3 computer, microwave ovens.
    1950s    Expansion of electric appliances, etc. in the post-World-War economic boom.
             Over 80% of rural America has electricity.
             Inventions: Pocket-sized radios, color TV broadcast, AA batteries.

4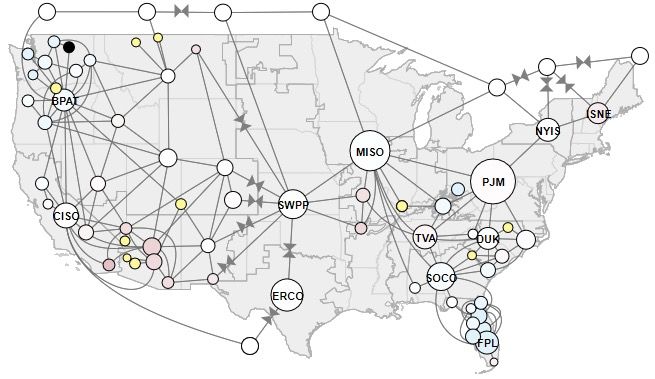
Today I Learned About The Electric Grid
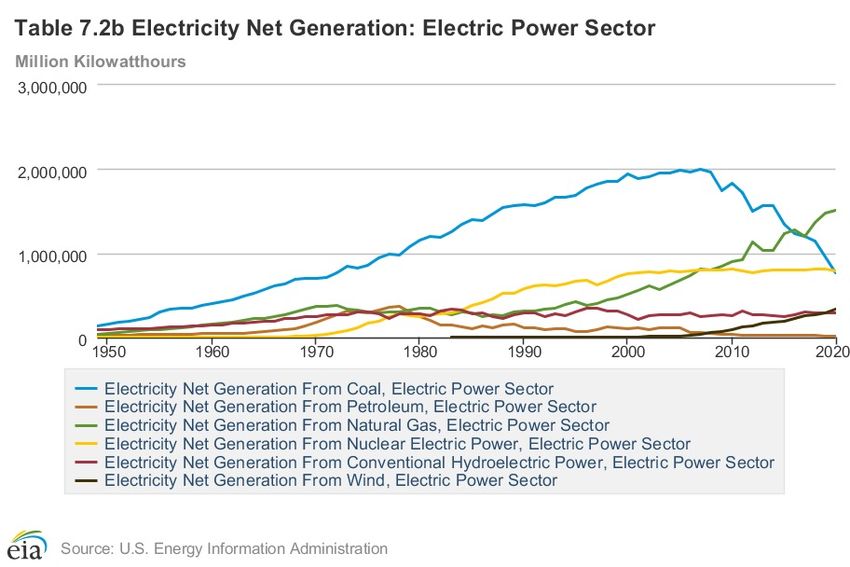
Electricity Generation, 1950s to Present
Natural Gas
Coal
Nuclear
Wind
Hydro
Oil/Gas
A Warming Planet
As we burn fossil fuels like coal and natural gas to generate electricity, carbon dioxide
(CO2) is released into the atmosphere. CO2 acts like a blanket, trapping heat and
warming our air and ocean. Warmer air and warmer oceans are changing our climate,
causing more extreme weather, sea level rise, and other disruptions all over the world.
Questions
• What surprised you about the history of electricity in the US?
• What do you notice about how we generate electricity in the US?
https://www.eia.gov/totalenergy/
5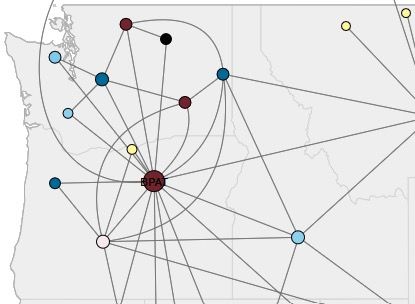
Today I Learned About The Electric Grid

Electricity Use
    Electricity use is not equal over the course of a day. Think about your own household or
    someone else’s. On the next page:
    1. In the left-hand (West Coast) column, quickly note how electricity is used on a normal
    day. Pay close attention to the times. One line is completed for you.
    2. Think about who is home and what they are doing at these times.
    3. Note whether the electricity use would be high, medium, or low.

    Because of time zones, a similar family across the country on the East Coast would be
    doing the same actions, but three hours earlier.
    4. In the right-hand (East Coast) column, note how electricity is used on a normal day.
    Pay close attention to the times. One line is completed for you.
    5. Think about who is home and what they are doing at these times.
    6. Note whether the electricity use would be high, medium, or low.

Questions
    After completing the chart on the next page, answer the following questions:
    1. What factors might change electricity use over the course of
          a. a week?
          b. a month?
          c. a year?
    2. What factors might make electricity use different in northern vs southern states?
    3. What other factors might make electricity use different in different households?

6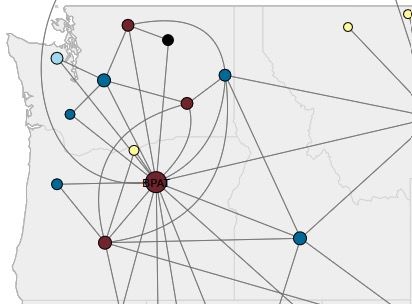
Today I Learned About The Electric Grid

 Electricity Use, cont’d

Follow the instructions on the previous page to fill out this chart.
                                             Electricity                        Electricity
EST    Actions                                  use      PST Actions               use
3-4                                                    12-1
am                                                     am
6-7    Waking up, getting ready for school             3-4
                                               High           Everyone asleep      Low
am     and work.                                       am
9-10                                                   6-7
am                                                     am
12-1                                                   9-10
pm                                                     am
3-4                                                    12-1
pm                                                     pm
6-7                                                    3-4
pm                                                     pm
9-10                                                   6-7
pm                                                     pm
12-1                                                   9-10
am                                                     pm

7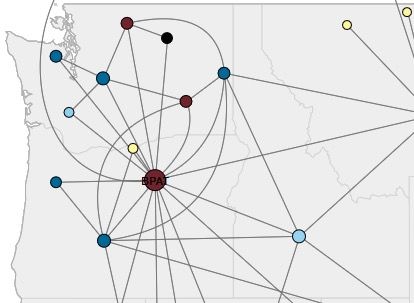
Today I Learned About The Electric Grid

Electricity Use: Data Exploration

    1. Visit the Energy Information Administration’s Hourly Electric Grid Monitor.
    https://www.eia.gov/beta/electricity/gridmonitor/dashboard/electric_overview/US48/US48
    2. Click the    icon to get to the custom view.
    3. Under Map Options and Date Range Type, select Custom. Enter any date you choose.
    4. Under Map Data Type, select Demand. Under Change from prior hour, select Percent.
    5. Below the map, click the    to see the change in electricity demand over the course of
    the day. You can track the time of day above the map. Darker blue circles show utilities
    where customers are using less electricity than the hour before. Darker red circles show
    utilities where customers are using more electricity than the hour before.
    6. Below the map, click the slider to move to the specific hours from your timeline on
    Page 1. The map displays data for the hour ending at the time shown, so the data for the
    hour 3-4am can be found in the 4am map.
                   Customers using                            Customers using
                    less electricity                          more electricity

Questions

    1. Do these maps line up with your predictions? Why or why not?
    2. What happens when you look at a different time of year? Are there any surprises?
    3. What other questions could you explore with this tool?

8
Today I Learned About The Electric Grid
Electricity Use: Map Exploration
6-7am EST 9-10am EST
3-4am PST 6-7am PST
6-7pm EST 9-10pm EST
3-4pm PST 6-7pm PST
Customers using Customers using
less electricity more electricity
Questions
1. Do these maps line up with your predictions? Why or why not?
2. These maps are from March. What would you expect if you looked at data from a
different time of year?
3. What other questions could you explore with this tool?
Data from March 15, 2016 https://www.eia.gov/beta/electricity/gridmonitor/dashboard/electric_overview/US48/US48
9Today I Learned About The Electric Grid
“The complexity of the grid is that there needs to be exactly the right
amount of power put into the wires to serve all the instantaneous
needs of all the people on the system. It doesn't really have the
ability to store electricity in the wires themselves. So the electric
company has to create a system so the amount of power that's
being injected into the wires is just about exactly equal to the
amount of electricity that's being taken out of the wires.”
Harvey Michaels, MIT Sloan School of Management
TILclimate podcast: Today I Learned About The Electric Grid
Supply & Demand
Balancing the amount of electricity running through the wires is a big job. If demand (the
amount of electricity used in an area) is higher than supply (the amount of electricity
available in the wires) people experience flickering lights, brownouts, and blackouts. If
demand is lower than supply, utilities dump the excess electricity, which is wasteful and
expensive.
In the following three maps of the Pacific Northwest region, the utilities are trading
electricity in order to meet demand. Utilities with a net inflow (blue) are having to get
electricity from a neighbor to meet demand. Utilities with a net outflow (red) are making
more than enough electricity to meet demand and are sending the excess to a neighbor.
B B B
A A A
3-4am PST 12-1pm PST 9-10pm PST
Net inflow Net outflow
Questions
1. What is happening at each of these utilities over the course of the day?
2. If you were the manager of each of these utilities, would you change how you are
making electricity? Why or why not?
https://www.eia.gov/beta/electricity/gridmonitor/dashboard/electric_overview/US48/US48
10Today I Learned About The Electric Grid My Electric Grid: Shape 1. Visit https://atlas.eia.gov/pages/energy-maps 2. Click Electricity. 3. Click the Layer Stack icon and toggle all the layers off (from to ) except for Pipelines and Transmissions. 4. Click the arrow next to Pipelines and Transmission and toggle on Electric Power Transmission Lines and Electric Substations. Only these two options should be toggled on ( ) Click the double arrow to the right of the layer box to minimize the layer stack. 5. Zoom the map to an area you are familiar with. If you zoom too far in, you may notice that the Electric Substations (pale purple circles) disappear. 6. Click the Legend to see what the various colors and weights of lines mean. Questions 1. What do you notice first about how the electric grid is shaped in your area? 2. Is the grid evenly distributed? Why do you think this may be? (It may help to toggle the basemap in the lower right-hand corner to a satellite image.) 3. The system of substations, high-power lines, and step-down lines grew over time as electricity use grew from cities in the 1880s to rural areas in the 1930s, and then as suburban populations grew in the 1940s through the 1990s. If you were to design an electric grid now, instead of growing it over more than a century, what factors would you consider? Solutions Infrastructure experts are working to make the electric grid smarter. Watch the videos at https://www.smartgrid.gov/the_smart_grid/ to learn more about how the grid is changing to meet 21st century demands. MIT researchers are inventing new ways to think about our electric grid at https://energy.mit.edu/area/power-distribution-energy-storage/ 11
Today I Learned About The Electric Grid

My Electric Grid: Source

 For this investigation, you may choose the region you live in or another region of the US.
 1. Visit https://www.epa.gov/egrid/data-explorer
 2. On the map, determine which eGRID subregion your focus area is in. Write its 4-letter
 code here:
 3. In the dropdown menu after “I want to explore” select resource mix.
 4. Select the subregion you are focusing on. For each fuel type, the chart to the right
 shows the US average percentage of that resource and the percent that is used in your
 subregion.

Questions
1. What do you notice first about how the different subregions are generating electricity?
2. How far off from the national average is each of your subregion’s fuel sources?
3. Given the options in the drop-down menus after “I want to explore,” what questions can
   you investigate about the electric grid in the US?
4. Investigate one of the questions you defined. How would you share what you learned
   with a friend or family member?

12
You can also read