Thursday, February 4, 2021 Differential heating of Earth's surface (p 60) (+ Feb 9 asynchronous) Circulation and energy surplus/deficit) (p 61)
←
→
Page content transcription
If your browser does not render page correctly, please read the page content below
Thursday, February 4, 2021

Differential heating of Earth’s surface (p 60) (+ Feb 9 asynchronous)

Circulation and energy surplus/deficit) (p 61) (+ Feb 9 asynchronous)

Heat-driven circulation (Hadley) (p 61-62)

Convergence/Divergence (p 61-62)

Distribution of surface winds(p 62-66)

Coriolis effect and mid-latitude
weather systems (fronts) (p 63-64)

Continentality, climate and biomes
Accouncements

Midterm 1 next week (Thursday, February 11, 12:45 pm)

Designed to take 1 hour, on Chapters 1-4 + Feb 2 video

Questions? We will be available M-W next week for help.
       Open house next Tuesday will include review
       Look for summary of topics for Midterm 1 (on Canvas)

Homework 2 - Climate Variability (due Thursday, February 25)
     Please work in groups of no more than 4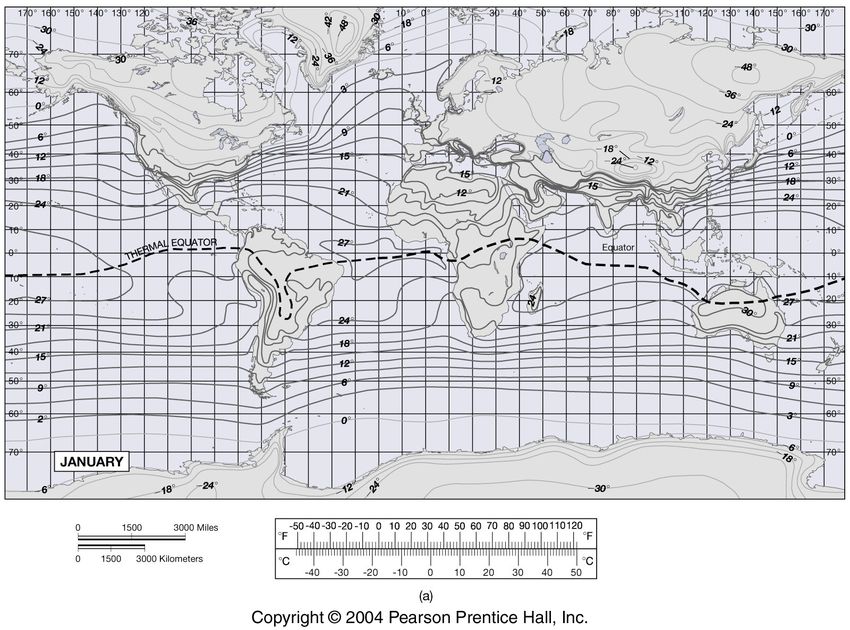
Other Asynchronous Material (review)

Water vapor and feedback on Earth’s surface temperature
(p 53, 79)

Clouds and feedbacks (p 50-51, 54)

Weather fronts (p 62-63)

More on Coriolis (63-65)

Geostrophy and force balance (p 66)

General circulation on a rotating Earth (p 65)
Learning Objectives

Curvature and latitudinal variations in albedo lead to differential heating
(pole-to-equator gradient) that drives circulation of atmosphere and
oceans.

The “Hadley circulation” is the equator-to-pole circulation that is driven
by heating in the topics and cooling in the polar regions. This circulation
explains many features of Earth’s climate, including trade winds,
warm/wet tropics, and cool/dry midlatitudes.

Earth’s rotation is responsible for the Coriolis effect which, when in
balance with the pressure-gradient force, causes winds to travel in specific
directions that are responsible for our weather patterns.

Climates vary from place to place Earth, but we can learn a lot about
ranges in temperature, humidity, and precipitation by looking at the
general circulation (see Homework 2)
What we know (1)

Earth’s global mean temperature represents a balance between
absorbed incoming solar radiation and outgoing thermal emission.

Incoming radiation is affected by the solar constant (distance of orbit
from sun, brightness of sun) and reflection by surfaces (clouds, ice,
aerosols, dust, land surfaces)

Outgoing radiation is mainly determined by the composition of the
atmosphere – greenhouse gases that radiate infrared energy back to
space. Some surface infrared radiation escapes to space in
atmospheric windows, but these windows can be blocked by addition
of greenhouse gases, thereby heating the surface even more.
What we know (con’t - 2)

The Earth system receives 99% of its heat in the form of radiation from
the sun primarily in the visible and near-IR

Of a total of 100 units of solar energy incident on Earth, 30% is reflected
back to space by clouds and bright surface regions (ice, deserts), and 45
are absorbed by the surface. Added to these 45 units are 88 units of heat
energy (thermal IR) emitted by the atmosphere (the “greenhouse
effect”).

Earth’s surface maintains thermal balance by convection of warm, less
dense, air carrying heat upward, by evaporating water (“latent heat”) and
by radiating the remainder upward.

Of the 104 units of energy radiated by the surface, 4 escape directly to
space through “windows” in the IR spectrum of the atmosphere.
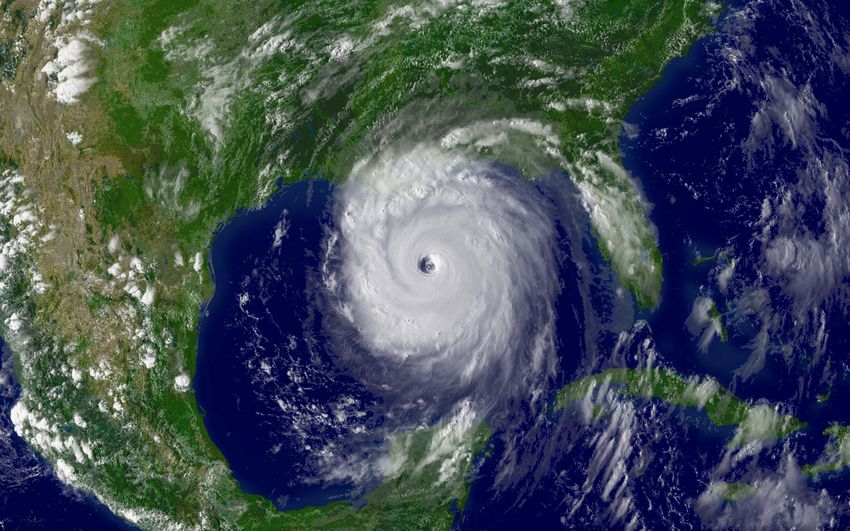
Why do we have weather?
                Let’s start where we left off last time
• Earth isn’t flat
• Earth rotates (important for moving fluids)
• Water is complex (water vapor, clouds, and ice are highly variable)
   (most of this will be asynchronous)

                                                             Fig. 3.19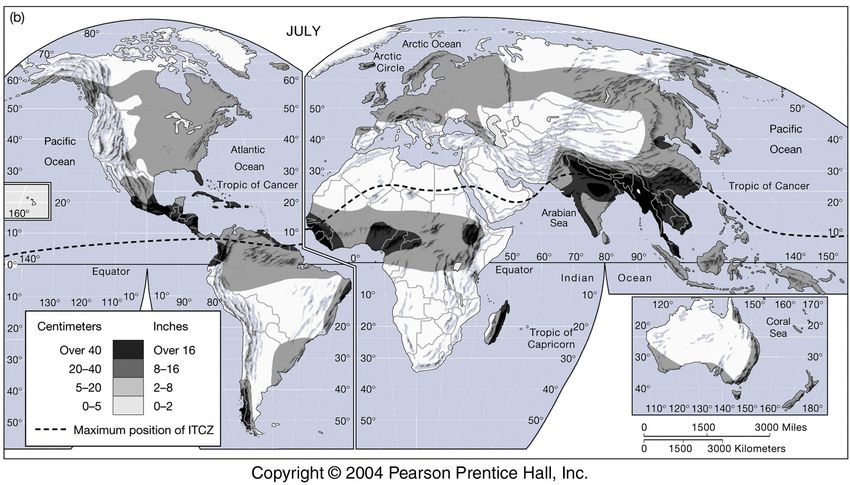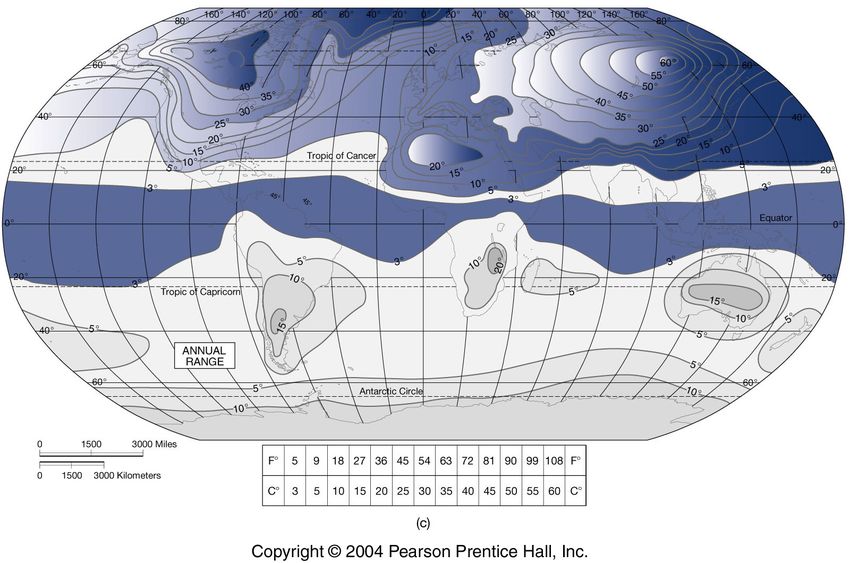
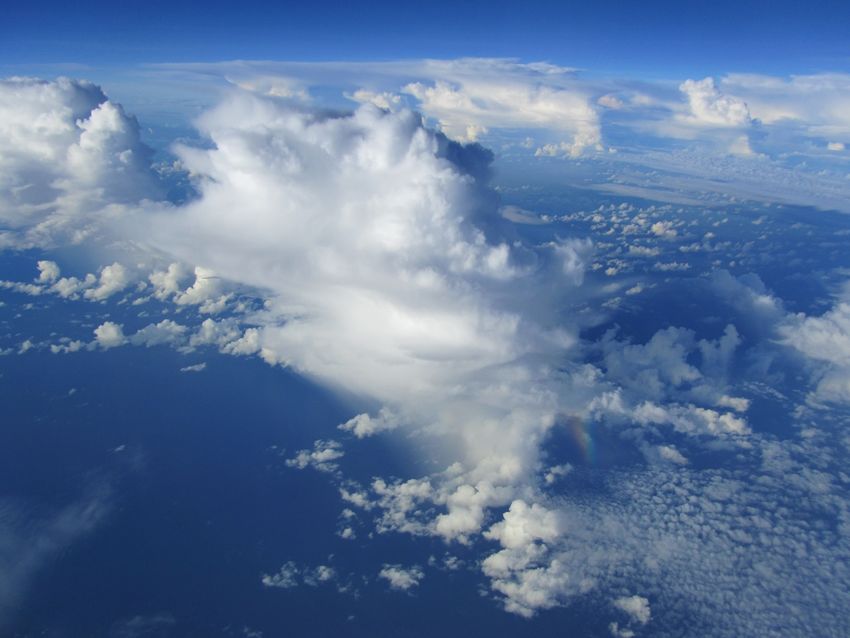
Water vapor and clouds (some Asynchronous)

• We’ve already talked about ice and
  albedo (positive feedback). This will
  be important when we look at pole-
  to-equator temperature gradient

• Clouds are different from
  greenhouse gases – they can trap
  heat (warm the surface), but they
  also reflect visible light (cool the
  surface). Both positive and negative
  feedback, which is more important?

• Warm air can hold more water vapor
  than cold air. Positive feedback.

                                          Fig. 4.25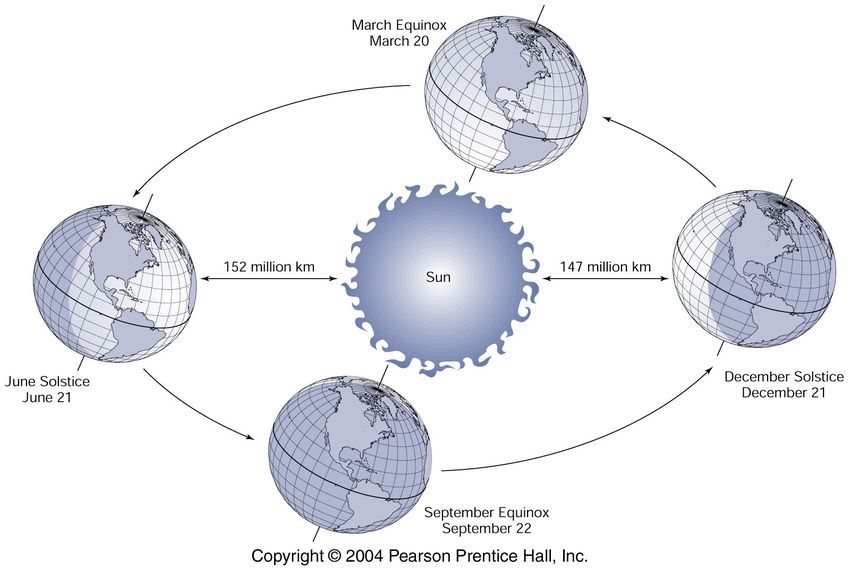
Water and it’s phases

                        Fig. 4.23
iClicker Question 1 Which of the following is more of a measure of “climate” than a feature of “weather?” (A) a warm and sunny day. (B) Heavy snowfall in Colorado in March. (C) A decade of severe drought in the Southwest U.S. (D) Flooding in Louisiana in August. (E) Santa Ana winds in Southern California in October.
The real world is far more complex (and far more interesting!)
          than this simple picture of average energy.

          Why! Because Earth isn’t flat!
Earth’s General Circulation
Chapter 4 - The surface is heated differentially due to the
            curvature and variations in albedo
             (see asynchronous video Feb 9)

    Sun low in the sky
    & higher albedo

  Sun more directly
  overhead & lower albedo

                                                              Fig. 4.1
Pole-to-Equator Gradient in Energy Balance
(see asynchronous video for February 9)
Heat is carried from the
equator to the poles by
winds and ocean currents
Fig. 4.2Pole-to-Equator Gradient in Energy Balance
(see asynchronous video for February 9)
When we examine radiation to space from Earth as a function of latitude,
we find that the tropics emit less heat than we expect based on absorption
of solar energy in the tropics. There is more incoming solar radiation than
outgoing thermal radiation. We call this a SURPLUS of solar radiation!
The opposite is true in the polar regions, where more heat is radiated in
the infrared than is absorbed in the visible. There is less incoming solar
radiation than outgoing thermal radiation. We call this a DEFICIT of
solar radiation.
Earth in radiative balance overall when we average over the entire globe,
(incoming solar = outgoing thermal), but there is a significant shift in
heat from one part of the globe to another. The tropics are cooler than we
expect and the poles are warmer than we expect. This is due to circulation
of the atmosphere and oceans.What is going on?
The atmosphere and oceans are fluids, which can move. This carries heat
from the warm regions of the planet to the cold ones.
This is what allows life to survive in the tropics without being scorched
and what allows life to survive at high latitudes without being freeze
dried!
Chapter 4 – we will look at the circulation of the atmosphere
Chapter 5 – we will look at the circulation of the oceans
Why it matters: Both the atmosphere and oceans will play important
roles in redistributing heat from the topics to the polar regionsDifferential heating and cooling of Earth sets up a pattern of vertical
motions (uplift , or convection, and subsidence) that drives Earth’s
general circulation. This is the first step in determining Earth’s climate
zones (places that experience certain types of weather ….winds,
temperatures, precipitation, seasons)
Figure 4-3Ideal Gas Law (PV = nRT)
Air expands when it is heated. This is because pressure is constant if a gas
is uncontained, so an increase in temperature forces an increase in volume.
This causes a decrease in density, and the less dense air becomes buoyant.
Heating
Figure 4-3Rising Air leaves a Low Pressure at the Surface
The upward movement of warm air in the tropics reduces the pressure at
the surface. This low pressure acts to pull in higher pressure air at higher
latitudes, inducing a pole-to-equator surface flow of air.
Figure 4-3Cooling Air Aloft Leads to Descent at Higher Latitudes
As warm air ascends to the colder upper regions of the atmosphere, it will
radiate heat to space, becoming cooler and more dense. It begins to sink,
reinforcing the surface high pressure at mid-latitudes.
Cooling Cooling
Figure 4-3What air flow at the surface would look like, based on observed pressures alone – air
would move from high to low pressure. Areas where air is rising due to solar heating
(e.g., tropics) have low pressure at the surface, areas where air is sinking due to
cooling (e.g., north and south poles) have high pressures. Areas in between can have
either high or low pressures, depending on what is happening to air at other latitudes.
We can now begin to
see climate bands! Air over the
Places where it is poles is
often warm and wet, sinking
like the tropics, places because it is
that are cool and dry, cooling.
like the polar regions.
Places in between
(like the US) will have
more variable
climates!
Fig. 4.8Low pressures and Inclement (rainy) weather The pressure must decrease where air is rising. This is because the pressure at the surface is due to the weight of the column of air above, and if that column of air is less dense (lighter) than the surrounding air, the pressure at the bottom of that column will be smaller. We call this low pressure. Since the air above a surface low pressure region is rising, it is cooling and clouds are forming, so we often associate low surface pressures with ‘bad (or inclement) weather’. This low pressure will attract higher pressure air inward. This is called convergence. Note that air from outside a low pressure region is converging toward that low pressure.
High Pressures and Good Weather

The pressure will be high where air is sinking. This is because that
column of air is more dense (heavier) than the surrounding air. We
call this high pressure.

Since the air above a surface high pressure region is sinking, it is
warming, any clouds will evaporate, and the weather tends to be
clear. So we often associate high surface pressures with good
weather.

This high pressure will tend to push air outward toward lower
pressures. This is called divergence. Note that air from inside a
high pressure region is diverging away from that high pressure.
A pole-to-equator “slice” through the atmosphere
We also see this type of flow driven by differential heating in
local weather patterns

                      Sea (and land) Breeze

                                                         Fig. 4.17
On large scales, however, Earth is rotating!
The Coriolis effect (some Asynchronous material)
Appears to speed up
Faster velocity
Fig. 4.9
Air traveling northward has larger eastward speed, so it appears to speed
up (“lead”) as it travels toward the pole. Conversely, air traveling
soutward “lags” at it travels toward the equator.
View is for Northern Hemisphere – S.H. is just the opposite.Consequences of Coriolis Effect (i.e., rotation)
Air does not travel in a
straight north/south
direction, but rather is
steered in an east/west
direction
This gives rise to strong
gradients that separate
warm and cold air masses
(look at current weather
in Denver compared to
New England)
Fig. 4.11 Midlatitude “westerlies”
Tropical easterliesWeather “Fronts”
The convergence of northerlies (cold) and southerlies (warm) leads to
weather ‘fronts’ at mid-latitudes. When a region is in a warm sector,
temperatures and humidities are more like tropical air, when a region is
in a cold sector, air is cool and dry.
Fig. 4.6We can see the effects of rising air on cloudiness. As air rises, it
cools (because it is expanding as it encounters lower pressures).
When the temperature reaches the condensation point, water
becomes saturated, forms small droplets of water – a cloud!
We call the band of clouds in
ITCZ
the tropics where air is rising
due to solar heating the
InterTropical Convergence
Zone (ITCZ).
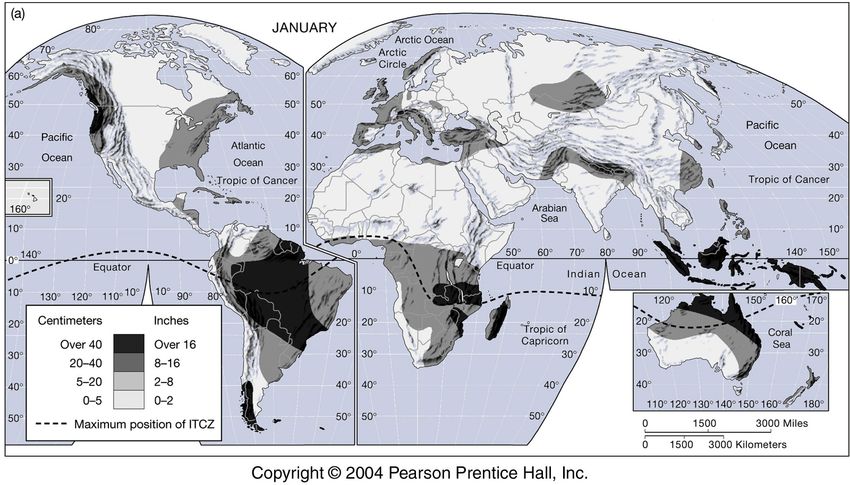
Fig. 4.4This creates a pattern of rising air near the tropics and sinking air
at higher latitudes.
Sinking air, dry
(deserts, droughts)
Rising air, wet
(rain forests and
floods)
Fig. 4.4Another “view” of 3D circulation
Asynchronous
      What do seasons do to the general circulation?

The place where air rises (i.e., the ITCZ) shifts with season –
rainy weather shifts between the hemispheres

                                                             Fig. 4.16
What do seasons do to the general circulation? One of the interesting consequences of a shift in the tropical zone for rising air is that places that are close to the equator experience two “cloudy/rainy” seasons. This is due to the passing overhead of the ITCZ. For example, it tends to rain in Quito, Ecuador, in February through May and again from October through December. http://www.climatestotravel.com/climate/ecuador Mountain climbers, such as those attempting to summit Mount Everest, know more about the climate there than most meteorologists. This is because they know that their lives depend on it! So when are the best times to summit Mount Everest? May and November. This is when the precipitation and winds are lowest. Seasonal shift in winds is called “monsoon” (it’s doesn’t mean torrential rain, but often the rains change when wind direction changes)
We can start to connect the dots – between weather and
                            climate.

General circulation tells us a lot about the “context” – tropics,
mid-latitudes, polar regions. But the surface of the Earth isn’t
uniform, and we have seasons. This means that different places
on Earth experience different patterns of weather.

So while the average “climate” may appear to be moderate,
there could be important changes that get averaged out. So we
need to look at the details of weather to really understand what
we mean by “climate.”
Why does all this matter? First, note that we can use pretty simple principles to explain some very basic (“average”) features of Earth’s climate (in fact, these principles apply to other planets as well). Things like “air rises when it is heated, because warm air is less dense than cold air at the same pressure” and “when air travels northward, the Coriolis effect will act to turn the air to the right of the direction of motion.” But it isn’t long before these simple principles become more complicated. For example, “geostrophy” represents a condition where two forces balance each other. This is the most simple form of balance (A=B). In fact, friction matters. And, so too does the centripetal (or “centrifugal”) force. When we add these in, we discover that air deviates a little from its “geostrophic” direction of motion.
Second, in order for us to explain the basic features of Earth’s climate
“zones” (the stuff that matters when we look at long-term changes, as
opposed to weather), we can figure out most of what we need simply
by assuming that winds are geostrophic. That is, we can use maps of
average surface pressure to estimate the average direction of the winds.
For predicting individual weather events, like storms, this won’t be
good enough (in fact, the deviations from geostrophic balance are
responsible for changes in the weather).

We can look at weather maps and examine things like droughts (which
occur in places where surface pressures tend to be high over long
periods). We’ll look for rain or snow where surface pressures are low,
and we’ll look for fronts to move in the direction of geostrophic winds
– winds that, in the northern hemisphere, travel in a direction that
maintains high pressure to the right.
Clicker Question 2
Which hemisphere has larger seasonal variations in temperature?
(A) The Northern hemisphere
(B) The Southern hemisphere
(C) Neither – both have the same variations, they are just offset by 6
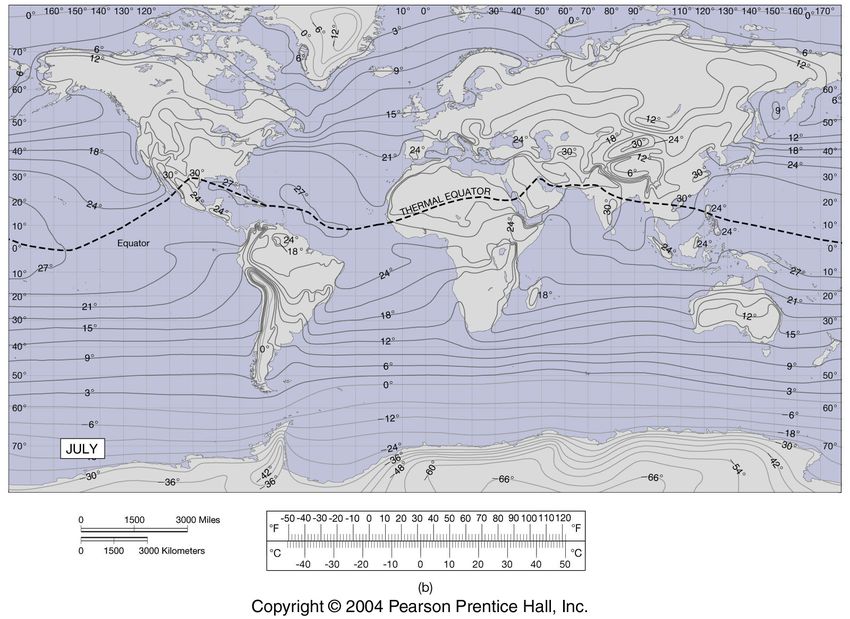
months.July temperatures
Fig. 4.18January temperatures
Fig. 4.18Summer/winter temperature differences
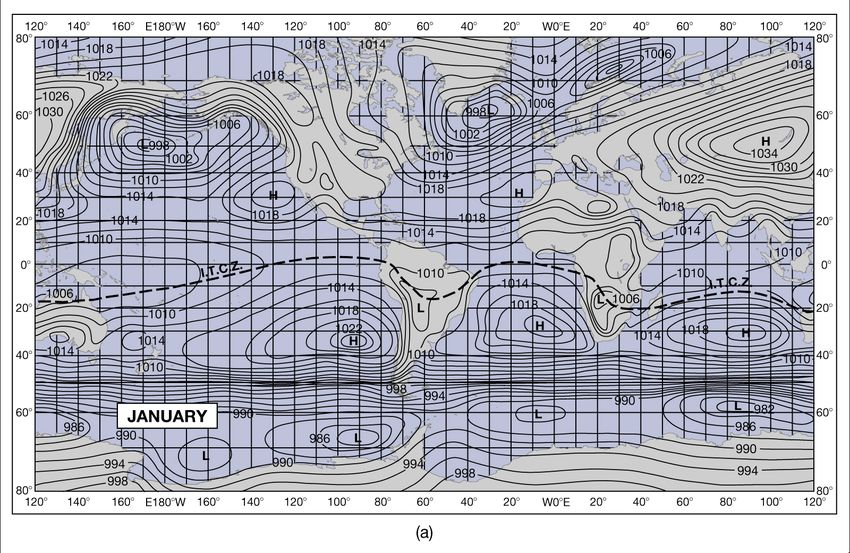
Fig. 4.18Average sea-level pressure patterns - January
L
L H
H H
Fig. 4.19Northern hemispheric average winds, January
L
L H
H H
Air flows in a direction that keeps high pressure
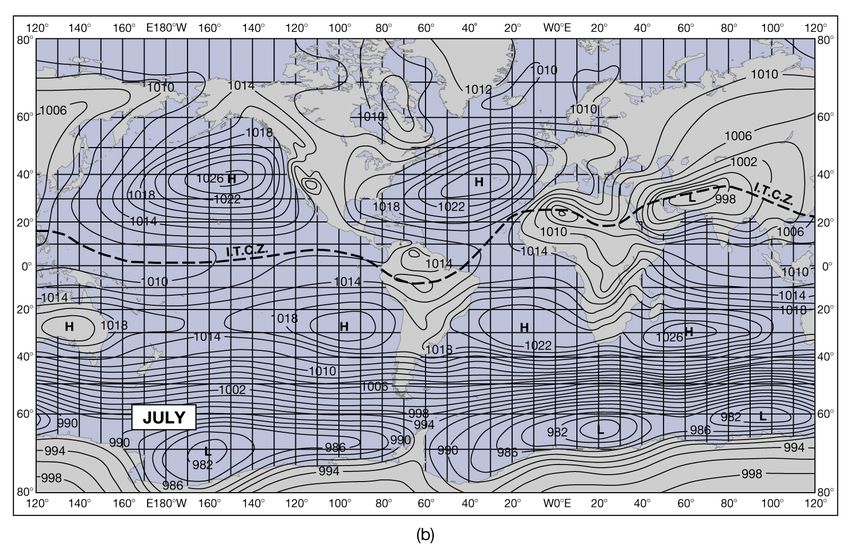
the right of the wind direction in the NH Fig. 4.19Average sea-level pressure patterns - July
H H L
Fig. 4.19Mean wind directions in NH, July
H H L
Fig. 4.19Using geostrophy to deduce climates Note that, based on geostrophic flow and mean surface pressure fields, we can deduce general patterns of climate in different places. For example, the west coast of the US experiences a mean wind direction from the north-northwest during July, keeping weather cool near of the coasts of states like Oregon, Washington, and many parts of California. In January, the mean flow towards Washington state is from the southwest, bringing warm, wet air from near Hawaii (the “pineapple express.” Note that weather in the UK comes from the west-southwest both months, even though the pattern switches from high to low. This is because the position of the highs and lows shifts. The UK typically has wet weather in both July and January.
Will go over these very quickly (all one concept)
Biomes (regions
with distinct types
of plants) can tell
  us something
 important about
     climate!

Fig. 4.27
deciduous forest
tundra
taiga
alpine
grasslands
desert
rainforest
savanna
chaparralchaparral
alpine
deciduous forest
savanna
desert
taiga
What do clouds do?

       Cold – absorb IR radiation from below,
        not very “bright”, don’t reflect visible
                         light

          Warm – emit thermal radiation,
        reflect incoming light back to space

                                            Fig. 3.18
It depends! Cold, so don’t radiate much to space
No significant change
in albedo – too “thin”
Good at trapping
heat from below
Fig. 3.18Low, warm, thick clouds Increase albedo
Warm, so good
radiators to space
Trap heat, but in a location
where lots of heat is .
. already trapped.
Fig. 3.18Asynchronous
Why does Earth have seasons?
Watch this video clip, and be prepared to be surprised. You might be
thinking the same wrong answer as some Harvard students!
https://ed.ted.com/on/xKxsSA5w
Still think Earth has seasons because it gets closer and farther from
the Sun (i.e., during summer Earth is closer to the Sun and durin
winter Earth is farther from the Sun?). Don’t worry, you aren’t
alone! But you are wrong.
http://sciencenetlinks.com/student-teacher-sheets/misconceptions-
about-why-seasons-occur/We need to remember that seasons affect the general circulation
Fig. 4.15Note that Earth is farther from the Sun during the summer for those
of us who live north of the equator (the opposite is true south of the
equator)?
Fig. 4.15The coriolis effect works in three dimensions – like a vector, or a “force”. We have to deal with the horizontal component of that force. The vertical can’t do much working against the much larger vertical force of gravity.
Asynchronous
                          The Geostrophic Wind

At mid and high latitudes, the coriolis effect is larger than it is in the
tropics (in fact, in the tropics it is very small). Air will move if subjected
to a force. Therefore, it will respond to both differences in pressure and to
the coriolis “force”. Because air experiences very little friction, it will
eventually travel in a direction where the two forces cancel. This direction
ends up being perpendicular to the pressure force. It’s easy to know where
way the wind blows simply by noting that in the northern hemisphere,
high pressure will be to the right of the wind direction. We call the
‘balanced wind’ the ‘geostrophic wind.
When winds obey the condition where the pressure force balances
the coriolis force, we call it “geostrophy”. At high latitudes, winds
are usually nearly geostrophic, in that the air travels in a direction
perpendicular to the pressure force.
However, friction
causes the true winds
to be a little slower
than expected, which
leads to waves that
create moving weather
systems (what we
often hear called
“steering currents” on
news reports).
Fig. 4.13For this class, we will use that the winds are nearly geostrophic, which will allow us to use maps of pressure to estimate the direction of the winds. For predicting weather, this won’t be perfect (in fact, the deviations from geostrophic balance are responsible for changes in the weather). However, for climate and trends, assuming winds are geostrophic will be quite useful. We will look for droughts in places where surface pressure tends to be high. We’ll look for rain or snow where surface pressures are low, and we’ll look for fronts to move in the direction of geostrophic winds – winds that, in the northern hemisphere, maintain high pressure to the right of the wind direction. This approach will tell us a lot about climate zones – places on earth where certain types of biomes occur. It will also tell us the directions of the major ocean gyres!
You can also read