The Value of U.S. Downtowns and Center Cities - CALCULATING THE VALUE OF DOWNTOWN TOLEDO, OHIO A 2019 IDA STUDY
←
→
Page content transcription
If your browser does not render page correctly, please read the page content below

The Value of U.S. Downtowns
and Center Cities
CALCULATING THE VALUE OF DOWNTOWN TOLEDO, OHIO
A 2019 IDA STUDY

A 2019 PUBLICATION CREATED BY
THE INTERNATIONAL DOWNTOWN ASSOCIATION

ABOUT IDA

            IDA
            The International Downtown Association is the premier association of urban place managers
            who are shaping and activating dynamic downtown districts. Founded in 1954, IDA represents
            an industry of more than 2,500 place management organizations that employ 100,000 people
            throughout North America. Through its network of diverse practitioners, its rich body of
            knowledge, and its unique capacity to nurture community-building partnerships, IDA provides
            tools, intelligence and strategies for creating healthy and dynamic centers that anchor the well-
            being of towns, cities and regions of the world. IDA members are downtown champions who
            bring urban centers to life. For more information on IDA, visit downtown.org.

            IDA Board Chair: Tami Door, President & CEO, Downtown Denver Partnership
            IDA President & CEO: David T. Downey, CAE, Assoc. AIA, IOM

            IDA Research Committee
            The IDA Research Committee comprises industry experts who help IDA align strategic goals and
            top issues to produce high-quality research products informing both IDA members and the place
            management industry. Chaired and led by IDA Board members, the 2019 Research Committee
            advances the work set forth in the IDA research agenda by publishing best practices and case
            studies on top issues facing urban districts, establishing data standards to calculate the value of
            center cities, and furthering industry benchmarking.

            IDA Research Committee Chair: Brian Douglas Scott, Principal, BDS Planning & Urban Design
            IDA Director of Research: Cathy Lin, AICP
            IDA Research Coordinator: Tyler Breazeale

            International Downtown Association
            910 17th Street, NW, Suite 1050
            Washington, DC 20006
            202.393.6801
            downtown.org

            © 2019 International Downtown Association, All Rights Reserved. No part of this publication may be
            reproduced or transmitted in any form—print, electronic, or otherwise—without the express written
            permission of IDA.
T H E VA L U E O F U . S .
                                                                      DOWNTOWNS AND
                                                                      CENTER CITIES

Stantec’s Urban Places
Project Advisors for The Value of U.S. Downtowns and Center Cities
Stantec’s Urban Places is an interdisciplinary hub bringing together leaders in planning and
urban design, transportation including smart and urban mobility, resilience, development,
mixed-use architecture, smart cities, and brownfield redevelopment. They work in downtowns
across North America—in cities and suburbs alike—to unlock the extraordinary urban promise of
enhanced livability, equity, and resilience.

Vice President, Urban Places Planning and Urban Design Leader: David Dixon, FAIA
Principal: Craig Lewis, FAICP, LEED AP, CNU-A

IDA would like to thank the following individuals for their efforts on the
2019 edition of this project:
Boise                           Huntsville                      Tempe
Jordyn Neerdaels                Chad Emerson                    Kate Borders
Lynn Hightower                  Karla Bolin
                                                                Toledo
Cleveland                       Spartanburg                     Cindy Kerr
Joe Marinucci                   Jansen Tidmore                  MacGregor Driscoll
Michael Deemer                  Jalitha Moore                   Rachel Bach
Audrey Gerlach
Mark Pugacz                     Tampa                           Waikiki
                                Lynda Remund                    Jennifer Nakayama
Hollywood                       Shaun Drinkard                  Brandon Barbour
Kris Larson                     Karen Kress
Lorin Lappin                    Alana Braiser
Devin Strecker

CONTENTS

Section One: Project Overview
Introduction                                  8
Urban Place Management Organizations          8
About the Value of Downtowns Study            9
Methodology Overview                         11
Known Limits to this Study                   12
Improvements and Areas for Future Research   12

Section Two: Downtown Profile
Overview                                     14
Economy                                      17
Inclusion                                    20
Vibrancy                                     24
Identity                                     27
Resilience                                   29
Downtown Profile                             32

Appendices
Project Framework and Methodology            36
What factors make a vibrant downtown?        38
Principles and Benefits                      44
Data Sources                                 49
Selected Study Definitions                   50
Additional IDA Sources                       52
Bibliography                                 53

References
Endnotes                                     56
Photo Credits                                57


SECTION ONE

PROJECT
OVERVIEW

              1
1                                                 PROJECT OVERVIEW

                                                                       “
    Introduction
                                                                          The city is an invention to

                                                                                                      ”
    GREAT CITIES START DOWNTOWN

    No city or region can succeed without a strong downtown,
                                                                          maximize exchange and
    the place where compactness and density bring people,                 minimize travel.1
    capital, and ideas into the kind of proximity that builds
    economies, opportunity, community and identity. Taking                                                  David Engwicht
    David Engwicht’s point a step farther, no place in the
    city maximizes exchange and minimizes travel the way
    downtowns and center cities do. Despite a relatively small
    share of a city’s overall geography, downtowns deliver             Urban Place Management
    significant economic and community impacts across both city
    and region. Downtowns serve as the epicenter of commerce,          Organizations
    capital investment, diversity, public discourse, socialization,
    knowledge and innovation. They provide social benefits             IDA members are UPMOs who manage growing districts to
    through access to community spaces and public institutions.        help create vital, healthy, thriving cities for everyone — from
    They play a crucial role as the hub for employment, civic          residents to tourists to business owners. These UPMOs are
    engagement, arts and culture, historical importance, local         downtown champions who bring urban centers to life.
    identity, and financial impact. In short, the very proximity and
                                                                       Since 1970, property and business owners in cities
    density that downtowns and center cities champion make
                                                                       throughout North America have realized that revitalizing
    them strong environments for the city at large to thrive.
                                                                       and sustaining vibrant downtowns, city centers and
    Though geographically small, the impact of a strong                neighborhood districts requires special attention beyond
    downtown or center city is felt far beyond its boundaries.         the services city administrations can provide alone.
    Downtowns contain a disproportionately large share of              These private-sector actors come together, with funding
    the city and region’s most important resources. These              from property and business owners, to form nonprofit
    range from economic assets such as jobs, tax revenue,              management associations that deliver key services
    private investment, and property value to cultural and             and activities within their districts. UPMOs are often
    recreational resources like restaurants, historical places,        called business improvement districts (BIDs), business
    theatres, museums, public art and festivals. Vibrant and vital     improvement areas (BIAs), partnerships and alliances.
    downtowns drive growth in and around their districts. A
    thriving downtown increases nearby value, driving growth in
    adjacent neighborhoods and beyond.

    Leveraging IDA’s unique industry-wide perspective and
    expertise, this study quantifies the value of U.S. downtowns
    and center cities across five core value principles and over
    150 metrics, with a focus on how downtown contributes to
    the city and region around it. The Value of U.S. Downtowns
    and Center Cities study is a partnership between IDA and
    a local urban place management organization (UPMO).
    UPMOs have invaluable insights into their managed areas
    and the relationships to unlock essential data sources for this
    study.

8                                                                                   IDA   |   The Value of U.S. Downtowns and Center Cities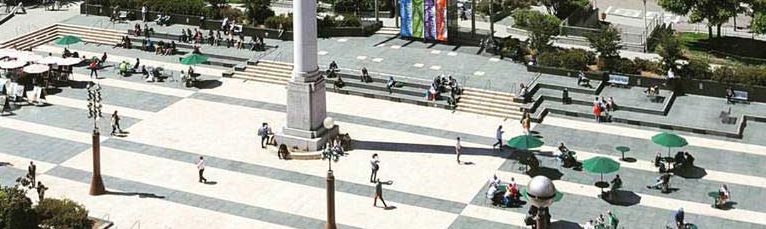
PROJECT OVERVIEW
                                                                                                                               1

    About the Value of Downtowns Study
    The study aims to emphasize the importance of downtown, to demonstrate its unique return on investment, to inform future
    decision making, and to increase support for downtown from local decision makers. The project has two primary goals:

                       Provide a common set of metrics to communicate the value of downtown.

                       Expand the range of arguments UPMOs can make to their stakeholders using
                       publicly available data.

    IDA began this research in 2017, working in collaboration         and resilience. IDA and our UPMO partners work together
    with Stantec’s Urban Places and an initial cohort of 13           to collect over 250 individual metrics across four benchmark
    UPMOs to develop a methodology for compiling and                  years (most current year available, 2015, 2010, and 2000),
    evaluating data form their downtowns. In 2019, our analysis       and across three geographic levels (study area, city, and
    adds 9 new locations to bring the total to 33 downtowns           MSA/county). In total, more than 3,000 individual pieces of
    and center cities across the U.S.                                 data are collected for each participating downtown. Our
                                                                      downtown database currently contains around 100,000 data
    The analysis focuses on how downtown provides value in
                                                                      points.
    the five principles of economy, inclusion, vibrancy, identity,

                                                                                                  VALUE OF DOWNTOWNS
                                                                                                   STUDY PARTICIPANTS
                                                                                                        (2017-2019)

downtown.org | | ©©2019
downtown.org        2019International
                          InternationalDowntown
                                        DowntownAssociation
                                                 Association                                                                         9
1                             PROJECT OVERVIEW

     ECONOMY      Downtowns and center cities deliver great value due to their roles as economic anchors for
                  their regions. As traditional centers of commerce, transportation, education, and government,
                  downtowns and center cities frequently serve as hubs of industry and revenue generators—
                  despite their making up only a small fraction of the land area. Downtowns support high
                  percentages of jobs across many different industries and skill levels. Thanks to relatively high
                  density of economic activity in the center city, investment provides a greater return per dollar
                  for both public and private sectors.

     INCLUSION    As the literal and figurative heart of the city, downtowns welcome residents, employees,
                  and visitors from all walks of life. Residents of strong downtowns vary widely in age
                  and often come from a wide range of racial, socioeconomic, cultural, and educational
                  backgrounds. This diversity ensures that as an inclusive place, downtown has a broad
                  appeal to all users and a strong social fabric. Downtowns provide access to opportunity,
                  essential services, culture, recreation, entertainment and civic activities for everyone.

     VIBRANCY     The ability of vibrant places to attract new residents, and a regionwide consumer base
                  creates value. Vibrancy is the buzz of activity and excitement that comes with high-quality
                  experiential offerings like breweries, restaurants, theatres, or outdoor events. Many unique
                  regional cultural institutions, businesses, centers of innovation, public spaces and activities
                  are located downtown As the cultural center of a city, downtown typically attracts a large
                  share of citywide visitors and accounts for a large share of citywide hotels and hotel rooms.

     IDENTITY     Downtowns and center cities often serve as iconic symbols of their cities, and this strong
                  sense of place enhances local pride. The distinctive cultural offerings in downtown enhance
                  its character, heritage, and beauty, and create an environment that other parts of the city
                  can’t replicate. Combining community history and personal memory, a downtown’s cultural
                  value plays a central role in preserving and promoting the region’s identity. Downtowns and
                  center cities serve as places for regional residents to come together, participate in civic life,
                  and celebrate their region, which in turn promotes tourism and civic society.

     RESILIENCE   As key centers of economy and culture, downtowns play a key role in ensuring stability,
                  sustainability, and prosperity; they can power citywide and regional efforts to bounce
                  back from economic or environmental shocks. Thanks to the diversity and density of their
                  resources and services, center cities and their inhabitants can better absorb economic,
                  social, and environmental shocks and stresses than their surrounding cities and regions.
                  The diversity and economic strengths of successful downtowns and center cities equip
                  them to adapt to economic and social shocks better than more homogenous areas.
                  Consequently, they can play a key role in advancing regional resilience, particularly
                  in the wake of economic and environmental shocks that disproportionately affect less
                  economically and socially dynamic areas.

10                                                                 IDA   |   The Value of U.S. Downtowns and Center Cities
PROJECT OVERVIEW
1
Methodology Overview i
The study began by identifying the best boundaries for The analytical focus of the report is to make data-supported
defining a downtown district. Geographic parameters value statements about downtown by comparing it to the
often vary across data sources and may not align with a city, identifying its growth trends, and illustrating its density.
UPMO’s jurisdiction. This study defined the commercial For instance, the data allowed us to conclude this about
downtown even when that meant moving beyond the downtown Seattle’s 2017 employment totals:
boundaries of local development authority or business
improvement district. IDA’s Value of Investing in Canadian
Downtowns report expresses the challenge well: “Overall, Downtown is a strong employment and industry hub
endless debate could be had around the exact boundaries for the city, with a concentration of high-paying and
of a downtown, what constitutes a downtown and what high-growth employment sectors. 43% of all citywide
elements should be in or out. Yet it is the hope of this jobs are located downtown and 58% of citywide
study that anyone picking up this report and flicking to knowledge jobs. Overall, employment increased 14%
their home city will generally think: Give or take a little, this since 2010, outpacing both the city and region. In
downtown boundary makes sense to me for my home city.”2 addition, the number of knowledge jobs grew 28%
IDA worked with each UPMO to determine the boundaries during the same period. Per square mile there are
of its downtown for this project, focusing on alignment with 85,924 workers on average, more than ten times the
census tracts for ease of incorporating data from the U.S. average job density citywide.
Census.
To measure the value of downtowns relative to their cities,
the analysis relied heavily on data that could be collected
efficiently and uniformly for each downtown, its city, and its
region. IDA collected data from multiple national databases
such as the U.S. Census, Longitudinal Employer-Household
Dynamics program (LEHD), and ESRI. In addition, we asked
our UPMO partners to collect local data through local
channels like county assessors or commercial real estate
brokers. We then analyzed the data to identify individual
downtown trends, benchmark performance against the
city and region, and compare the downtown against other
downtowns in the study.
We used meaningful qualitative observations to
acknowledge unique features or add nuance and context to
trends revealed in the data. As an example, universities often
sit just outside the downtown study area. We can assume
that the student body, even if technically outside the study
area, forms a major consumer market for downtown and
describe in our analysis how students influence the study
area.
i Refer to the appendix for the full methodology.
downtown.org | | ©©2019
downtown.org 2019International
InternationalDowntown
DowntownAssociation
Association 111 PROJECT OVERVIEW
Known Limits to this Study
While this study seeks to quantify the value of downtowns, data also comes predominantly from the 2017 American
we several limitations to our approach. Data collection from Community Surveys (ACS), the 2017 LEHD On the Map tool,
local sources was inconsistent. Some of the supplemental and ESRI Business Analyst. Due to a lag in data availability,
data we asked our local partners to collect was not always some metrics may not align with more recent data from local
available, making comparisons based on these metrics downtown, municipal, or proprietary sources.
impossible. At times, the data we asked for simply did not
Citywide context plays a large role in the analysis. Because
exist or hadn’t been collected at the relatively small scale
the size of cities varies significantly (e.g., from 20 square
of census tracts or downtown neighborhoods. This made
miles in Spartanburg to 606 square miles in Oklahoma
it challenging to rely on local data for analysis and often
City), comparisons of the percentage of citywide jobs and
resulted in some missing pieces in our narrative.
residents between districts can be skewed. However, since
The sample size of 33 does gain representational power each downtown operates within the context of its city,
by its selection of downtowns that operate across a understanding the comparative proportion of jobs and
range of geographies and within widely varying contexts. residents, along with other metrics, provides an important
Nevertheless, we recognize that its extrapolations may not tool for assessing a downtown’s contribution to its city and
apply to every downtown across the U.S. Our most recent region.
Improvements and Areas for Future Research
This year, IDA implemented a new data-collection system In addition to all the data collected in previous years, we
that allows us not only to expand the database for new study have continued to add new metrics from untapped data
participants, but also to make regular updates in the publicly sources. Most notably, we collected new data from Zillow,
available data from downtowns analyzed in previous years. the Center for Neighborhood Technology, the Centers for
This means that we benchmarked this year’s cohort of data to Disease Control and Prevention, National Register of Historic
the updated data from previous years, rather than comparing Places, and Geolounge.
older data. We have begun to develop a plan for updating
Analysis this year also included maps of population change
the local data from earlier cohorts (e.g., tax information,
and job concentration in downtown versus the city. We plan
visitor counts, etc.) to coincide with the results of the 2020
to develop additional forms of spatial analysis in future
census.
updates.
12 IDA | The Value of U.S. Downtowns and Center CitiesSECTION TWO
DOWNTOWN
PROFILE
22 DOWNTOWN PROFILE
Downtown Profile | Overview
A city’s strength and prosperity depend on a strong downtown and center city, which
serve as centers of culture, knowledge, and innovation. The performance of downtowns
and center cities strengthens the entire region’s economic productivity, inclusion,
vibrancy, identity, and resilience.
“The city has never been in better shape,” said Bob
Study Area Savage, a Toledo-born civic leader, in a 2017 interview
with Alan Soloman for the Chicago Tribune. “It’s the
rejuvenation of downtown that’s making it happen.”1 New
DOWNTOWN PARTNER sports and cultural offerings added to downtown since 2000
ConnecToledo bring in visitors by the thousands—even tens of thousands—
on game or event nights. This new energy has invigorated
CITY a growing food and bar scene, creating a buzz and sense of
liveliness in downtown. The renewed life and traffic spurred by
Toledo, OH the stadiums built in the 2000s refocused attention on unique
assets downtown has had for decades, like The Valentine
Theatre, and it enabled the establishment of unique new
spaces like Gathered Glassblowing Studio. Together, downtown
Residential amenities have won Toledo recognition and accolades from
publications like Livability.com.
Population Despite these victories, data doesn’t show dramatic economic
and residential growth in downtown. Yet key underlying
Downtown City Region trends point in a positive direction. Despite overall population
decline since 2010, more middle-class and high-income
Population 3,742 279,455 605,204 households have begun choosing to live downtown, signaling
growing appeal to a demographic group with the means to
City Share 1% n/a n/a live anywhere. While office vacancy rates remain high, the
Per Square Mile 3,198 3,463 444 region’s largest employer, ProMedica Health System, moved its
headquarters downtown in 2017.
Residential Growth
12% -10.9% -2.1% In fact, 2017 proved to be a landmark year for downtown
2000-2017
improvements. ProMedica’s arrival brought 1,000 workers to
Source: U.S. Decennial Census (2000); American Community Survey 5-Year Estimates (2013 – 2017) a renovated historic space on the downtown riverfront, work
began on the waterfront Metropark, Promenade Park was
renovated, and the ambitious Downtown Toledo Master Plan
won approval.
Growth rates and trends aside, downtown serves as a significant
employment center and revenue generator for the city. With
less than 2% of citywide land area, it hosts 18% of citywide jobs
and produces 9% of citywide property tax revenue.
14
18 IDA
IDA | | The
The Value
Valueof
ofU.S.
U.S.Downtowns
Downtownsand
andCenter
CenterCities
CitiesDOWNTOWN PROFILE
2
Downtown was home to around 3,750 residents as of 2017, an
Employment increase of 400 and 12% since 2000. During the same period,
both the city and region lost population. Data sources offer
Population different growth estimates for the period since 2010. A clearer
picture will emerge over time, but 475 new residential units
under construction represent an encouraging sign of further
Downtown City Region
growth.
Jobs 25,135 139,973 310,121 The average job density in a square mile of greater downtown
is a magnitude higher than the citywide or regional average.
Downtown Share n/a 18% 8% This concentration of jobs points to greater downtown’s role
Per Square Mile 18,347 1,735 227 as a key regional employment hub. Despite a slight decline in
employment between 2017 and 2019, greater downtown still
Worker Population -1.5% n/a n/a contains a significant share of city and regional jobs.
Growth 2017-2019
The greater downtown has a large share of the region’s office
Source: ESRI Business Analyst Business Summary Reports (2019, 2017)
space and had a 16% vacancy rate in 2016. The cost per square
foot to rent office space remains very low–a big attraction for
small businesses and startups. In addition, as the downtown
Inventory Greater % of
Downtown Region
Per
Square Mile master plan points out, downtowns have have become
increasingly attractive to employers in recent years for their
walkability, potential for interaction, and unique sense of place.
The combination of downtown appeal and low rents could act
9.2M 30% 7.8M as a powerful draw for new businesses. The downtown master
plan estimates 10-year office demand at 760,000 square feet,
OFFICE (SF)
if greater downtown can capture 25% of regional employment
growth, or attract new jobs to the market. That would require
no new office development, as greater downtown already has
1.3M n/a 1.1M 1.4 million square feet of vacant commercial space.
RETAIL (SF)
2,257 n/a 1,966
RESIDENTIAL
(UNITS)
535 8% 457
HOTEL (ROOMS)
Source: CoStar (2016); Downtown Toledo Master Plan (2017)
downtown.org | © 2019 International Downtown Association 15
192 DOWNTOWN PROFILE
“Greater downtown,” shown in orange on the comparison
map, includes the section between Monroe Street and I-75 that
houses a large number of jobs; applying the geography used
for the rest of the study, shown in purple, would have excluded
them from the report data.
IDA and ConnecToledo wanted to build a deeper
understanding of downtown’s contribution to citywide and
regional performance across a range of areas. IDA grouped
these areas under five principles—economy, inclusion, vibrancy,
identity, and resilience—developed in 2017 in workshops with
the first cohort of urban place management organizations
assembled for this analysis. IDA evaluated data for multiple
factors within each principle, focusing on trends and growth
over time and how downtown compared to the city and the
region.
Defining Boundaries
Downtown Toledo study area and Greater Downtown
This study area extends beyond the boundaries of the business
improvement district; geographic parameters vary across data
sources and don’t typically align with a place management
organization’s jurisdiction. For this study, IDA recommended
that participating urban place management organizations
use the commonly understood definitions of their downtowns
and match boundaries to hard edges like roads, water,
natural features or highways. IDA worked with each group to
align its study area with census tract boundaries for ease of
incorporating publicly available data from the U.S. Census.
As noted, this report used data from two overlapping
geographies. Employment, tax, property value, and a few
Downtown Share
other figures refer to “greater downtown,” which aligns closely
with the boundaries used for the downtown master plan. All of City Land Area 1.4%
other data came from “downtown” or “the study area.” Each
table notes the boundary to which its data refers. Geographic
limitations of available census data required this split. The
study team had no accurate way to capture the economic core
of downtown using only census tracts or block groups. The
Avenue. Moving east on Woodruff to the intersection of
census tract-based boundary excluded a key area of downtown
Cherry Street, the border then follows Cherry southeast to
employment, making the resulting employment numbers a
the Maumee River and turns southward. The boundary then
poor reflection of downtown’s employment base. Adding the
tracks Swan Creek west to City Park Avenue, which it follows
census tract containing the rest of downtown’s economic core
north to Belmont Avenue. The boundary includes a few
would have meant including a large area beyond the boundary
additional blocks north of Belmont between Division Court,
of what Toledoans consider downtown.
Indiana Avenue, and S. 15th Street. At Belmont’s intersection
The study area comprises three census tracts: 27, 28, and 37. with Lafayette the boundary proceeds east for a block, then
Its boundary begins just east of the Toledo Art Museum at follows S. Ontario Street northeast to Monroe Street, where it
Collingwood Boulevard, which it follows north to Woodruff proceeds northwest to reconnect with Collingwood Boulevard.
16
20 IDA
IDA | | The
The Value
Valueof
ofU.S.
U.S.Downtowns
Downtownsand
andCenter
CenterCities
CitiesDOWNTOWN PROFILE
2
Economy | Impact, Innovation
Downtowns make up a small share of their city’s land area but have substantial
economic importance.
While downtowns and center cities constitute a small share
of citywide land area, there’s no understating their regional
economic importance. As traditional centers of commerce, Greater Downtown
transportation, education, and government, downtowns
serve as economic anchors for their cities and regions.
Employment
Thanks to highly concentrated economic activity, investment
in the center city yields a high level of return per dollar.
Analyzing the economic role of downtowns and center cities
in the larger city and region highlights their unique value and
provides a useful guide for development policy.
Benefits of Economy: Economic Output, Economic 18%
CITY’S JOBS
18%
CITY’S KNOWLEDGE
Impact, Investment, Creativity, Innovation, Visitation,
Spending, Density, Sustainability, Tax Revenue, Scale, INDUSTRY JOBS
Commerce, Opportunity
Jobs/Industries
Greater downtown contains a significant share of the Toledo’s
economic assets, especially its jobs. With just over 25,000
jobs, it concentrates 18% of citywide employment into a 11%
CITY’S CREATIVE
little more than one square mile. The largest sectors are
public administration; professional, scientific, and technical JOBS
services; and health care and social assistance. Within these
Source: ESRI Business Analyst Business Summary Reports (2019)
sectors, greater downtown contains 63% of the city’s public
administration jobs and 48% of professional, scientific, and
technical service jobs. Greater downtown is a regional hub elsewhere in the city while offering the intangible advantages
for knowledge work, housing a total of 10,500 knowledge of proximity to potential collaborators and business partners.
jobs. This accounts for 8% of all knowledge jobs in the MSA,
In addition, downtown provides a variety of services for
despite downtown’s only occupying 0.09% of metro land area.
entrepreneurs and startups. Two of the three coworking
Some of the largest companies in Northwest Ohio— spaces in the city operate in downtown, SEED Coworking
including ProMedica, HCR Manor Care, Owens Corning, and and Rustbelt Works. SEED, created by local entrepreneurs
Libbey—maintain headquarters or a major facility downtown. through a Kickstarter campaign, serves as headquarters for
The Regional Growth Partnership, an economic development multiple software developers, artists, and small business
group serving Northwest Ohio, reports that these four owners. By offering discounted space to students and
enterprises employ a combined 18,850 people in downtown hosting events and meetups for the entrepreneurial
and across the region.2 On the other end of the spectrum, community, SEED adds a level of social and community
downtown offers a welcoming environment for small value. A recent addition, Jumpstart, operates as part of the
businesses. Office space rents for slightly less than space Ohio Third Frontier initiative, which supports technology
downtown.org | © 2019 International Downtown Association 17
212 DOWNTOWN PROFILE
startups. Supported by a public and private partnership
among KeyBank and other banks, the Toledo Community
Foundation, the City of Toledo, University of Toledo, and Greater downtown Toledo’s
Bowling Green State University. Jumpstart provides financial
assistance, technical support, and mentoring to local small assessed value is $764M,
business owners. ConnecToledo also acts as an approved more than 9%
micro-lender through KIVA.
of the city’s
Fiscal Impact
total assessed
Greater downtown contains 9.1% of Toledo’s overall
assessed value. On average, one square mile of land within value.
greater downtown boasts $454 million more in value than
a square mile of land elsewhere in the city and carries
the same value as 39 square miles of the MSA. Greater Source: Lucas County Auditor (2017); City of Toledo (2016 to 2019)
downtown’s value continues to rise, even as citywide value
has declined.
The City relies increasingly on greater downtown as a
revenue generator. In 2010, it provided only 6% of citywide
property tax revenue. By 2017, that proportion had increased Land Value
to 9%. Per square mile, greater downtown generates $53.3
million in tax revenue, compared to a citywide average of
and Investment
$9.9 million. Since 2000, property value and tax revenue from Greater
greater downtown have increased 48%, while citywide value Downtown City Region
and revenue have declined by 10%. This demonstrates why ASSESSED
the city should encourage public and private investment in VALUE
$764M $8B $19B
downtown: downtown property produces a much higher
AREA IN
return on investment than anywhere else in the city or region.
SQUARE MILES
1.37 80.6 1.3K
Development interest in downtown has grown in recent
VALUE PER
years. One of the biggest wins for downtown came with
SQUARE MILE
$558M $104M $14M
ProMedica’s relocation to the former Toledo Edison Steam
Plant in 2017. ProMedica, a health system operating in 28 PUBLIC AND
states, spent $46 million renovating the interior of the historic PRIVATE $332M* n/a n/a
brick facility on the riverfront into modern office space, INVESTMENT
accommodating approximately 1,000 employees in the heart SINCE 2016
of downtown. A vocal supporter of downtown, Randy Oostra, *Some developments do not report an investment figure and are excluded
from this total
ProMedica’s CEO, has made clear his hope that the move
will encourage more growth in the future and accelerate Source: Lucas County Auditor (2017); City of Toledo (2016 to 2019)
downtown revitalization.3
18
22 IDA
IDA | | The
The Value
Valueof
ofU.S.
U.S.Downtowns
Downtownsand
andCenter
CenterCities
CitiesDOWNTOWN PROFILE
2
Knowledge Industry Employment Growth 2010-2017
Finance, Insurance, Management of Professional, Information Health Care and
Real Estate and Companies Scientific, and Social Assistance
Rental and Leasing and Enterprises Technical Services
Share of
Citywide
40% 2% 48% 43% 8%
Jobs
Total Jobs 1,409 3 4,305 1,764 3,016
Greater
Downtown
Source: ESRI Business Analyst Business Summary Reports (2019)
Over the last three years, greater downtown has seen a
healthy infusion of investment from both public and private
Tax Impact sectors, averaging a combined $110,700,000 annually.
Another key indicator of growing downtown development
interest comes in the volume of building permits approved
annually. In 2010, the City approved only 53 construction
Greater permits in downtown, representing a combined investment
Downtown % of City % of Region of $3.4 million. In 2017, the number of approvals tripled
PROPERTY
TAX $72M 9% 4% to 174 and totaled $90.7 million in investment—21% of all
money spent on permitted construction projects citywide.
PROPERTY
Greater
TAX
Downtown City Region
REVENUE
CHANGE
SINCE 2000
48% -10% 8%
Source: Lucas County Auditor (2000, 2017)
downtown.org | © 2019 International Downtown Association 19
232 DOWNTOWN PROFILE
Inclusion | Diversity, Affordability
Downtowns and center cities invite and welcome residents and visitors by providing
access to opportunity, essential services, culture, recreation, entertainment and
participation in civic activities.
Resident Diversity
Downtown displays much greater diversity than the larger
Residents By Race*
region, with a Diversity Index score of 56 compared to 46 for WHITE
the region. (The Diversity Index, an indicator of the mix of 38%
residents within an area, expresses the probability that two
random people within the district identify as different races 60%
or ethnicities.) Downtown has a much higher concentration
of black residents than the city or the region. 75%
BLACK
Benefits of Inclusion: Equity, Diversity, Affordability, Civic
Participation, Culture, Mobility, Accessibility, Tradition, 51%
Heritage, Services, Opportunity
27%
“Inclusive spaces 14%
in the public realm, ASIAN
0%
particularly in our cities’
1%
downtowns, can help 2%
break down the social ALL OTHER
barriers that often 2%
divide us. Thriving 4%
downtown districts and 3%
public spaces promote HISPANIC OR LATINO
not only economic 7%
prosperity, but also 8% Downtown
City
social cohesion.”5 7% Region
Source: American Community Survey 5-Year Estimates (2013 – 2017)
20
24 IDA
IDA | | The
The Value
Valueof
ofU.S.
U.S.Downtowns
Downtownsand
andCenter
CenterCities
CitiesDOWNTOWN PROFILE
2
The black population has declined 13% (a drop of 300
residents) since 2000, while the white population has
increased 60% (an increase of 540 residents). This shift
represents the inverse of the city and region, which have
seen rising black population and falling white population.
The number of Hispanic residents downtown has more than
doubled since 2000 (an increase of 150 residents) and has
risen across the city and region despite overall population
loss. Since 2000 the city has added 6,000 Hispanic residents
and the MSA has added 13,000.
Lucas County “Certified Welcoming” for Immigrants
and Refugees
In April 2019, Lucas County won a “Certified Welcoming”
designation from Welcoming America, a national
nonprofit that provides guidance and support to help
communities become more inclusive toward immigrants
and refugees. “To become certified,” according to the
group, “communities undergo a rigorous audit to evaluate
compliance with the seven categories in Welcoming
America’s Welcoming Standard framework: government
leadership, civic engagement, equitable access, education,
connected communities, economic development, and
safe communities.” Since 2000, the share of the Toledo
MSA’s population that is foreign-born has risen from 2.9%
to 3.5%, for an increase of 3,300 residents. Lucas County
Commissioner Gary Byers stated that the “certification
recognizes what we have always known in Toledo and Lucas
County. Our diversity is our strength. Together, we do better
as a community, as a government.”4
downtown.org | © 2019 International Downtown Association 21
252 DOWNTOWN PROFILE
Socioeconomic Diversity
The study area has contained primarily low-income residents
since 2000, with more than 50% of households earning
less than $15,000 annually. Additionally, 73% of downtown
households make less than $40,000 annually, compared to
Household
42% regionally. At $17,000, the median household income for Income
downtown residents registers at less than half the citywide
median. This has kept rents extremely low: 32% of downtown DOWNTOWN CITY REGION
$17K $35K $48K
renters pay less than $300 per month, compared to 10% MEDIAN
citywide. INCOME
While median income and rent figures suggest that most MIDDLE-
people who can afford to live elsewhere still choose to do so,
the data shows strong growth in demand for luxury housing
CLASS
RESIDENTS
23% 47% 48%
downtown and a notable increase in middle- and high-
HOUSING AND TRANSPORTATION INDEX
income households. Since 2010, the share of households
paying more than $800 in rent has grown from 9% to 29%.
The socioeconomic breakdown of downtown has shifted as
33% 47% 55%
well, with the number of households earning above $40,000
Source: American Community Survey 5-Year Estimates (2013 – 2017); Center for
annually more than doubling since 2000. Neighborhood Technology (2017)
2000
Number of Households by Income 2017
1,200
1,000
800
600
400
200
0
Under $15,000 to $40,000 to $75,000 to More than
$15,000 $40,000 $75,000 $100,000 $100,000
Source: U.S. Decennial Census (2000); American Community Survey 5-Year Estimates (2013 – 2017)
22
26 IDA
IDA | | The
The Value
Valueof
ofU.S.
U.S.Downtowns
Downtownsand
andCenter
CenterCities
CitiesDOWNTOWN PROFILE
2
Educational Attainment for Residents 25+
42%
High School or Less 47%
41%
34%
Some College 34%
33%
13%
Bachelor’s Degree 12%
16%
11%
Advanced Degree 7%
10%
0% 10% 20% 30% 40% 50% 60%
Downtown City Region Downtown 2010
Source: American Community Survey 5-Year Estimates (2006 – 2010, 2013 – 2017)
Downtown Residents’ Age Educational Attainment
A quarter of downtown residents hold a bachelor’s degree or
higher, a rate 7% higher than the city and only 1% behind the
6% region. Since 2000, downtown has added 401 new residents
19% with bachelor’s degrees or higher, doubling the proportion
14% Under 18 of residents with post-secondary education. Despite the
increase, downtown still lags peer downtowns on education
18-24
with the fourth-lowest share of residents with a bachelor’s
12% 25-34 degree or higher among the 33 districts studied.
35-54 Age
25%
55-64 Downtown has a mix of residents of all ages, although a
65+ relatively small share of residents older than 65. Millennials,
25%
aged 18-34, account for more than a third of residents.
Within that group, residents aged 25 to 34 have increased
from 19% of the population in 2010 to 25% today.
Source: American Community Survey 5-Year Estimates (2013 – 2017)
downtown.org | © 2019 International Downtown Association 23
272 DOWNTOWN PROFILE
Vibrancy | Spending, Fun
Due to their expansive base of users, center cities can support a variety of unique retail,
infrastructural, and institutional uses that offer cross-cutting benefits to the region.
Downtowns and center cities typically form the regional
epicenter of culture, innovation, community and commerce.
Downtowns flourish due to density, diversity, identity and use. Residential
An engaging downtown “creates the critical mass of activity
that supports retail and restaurants, brings people together Change
in social settings, makes streets feel safe, and encourages
people to live and work downtown because of the extensive RESIDENTIAL Downtown City Region
POPULATION
amenities.”6
CHANGE 12% -11% -2%
(2000-2017)
Benefits of Vibrancy: Density, Creativity, Innovation,
Investment, Spending, Fun, Utilization, Brand, Variety,
Infrastructure, Celebration
RESIDENTIAL
UNITS IN 580 n/a n/a
DEVELOPMENT
Source: American Community Survey 5-Year Estimates (2013 – 2017); Reichle
Klein Report (2017)
Residential Growth
Census data doesn’t reveal a clear trajectory for downtown’s population. While sources agree that the count has risen
since 2000, different datasets reach conflicting conclusions on whether population has grown or shrunk since 2010.
Estimates aside, the 580 units of housing under construction or in planning reflect a growing demand for downtown living
and suggest strongly that population is rising. The growing census tracts within downtown (27 and 28) added a combined
713 residents between 2000 and 2017; the third tract (37) lost 313 residents. The accompanying map shows widespread
citywide population decline, highlighting the significance of downtown growth in the face of the broader trend.
Population Change in Lucas County 2000–2017
Source: U.S. Decennial Census (2000) American Community Survey 5-Year Estimates
(2013 - 2017)
24
28 IDA
IDA | | The
The Value
Valueof
ofU.S.
U.S.Downtowns
Downtownsand
andCenter
CenterCities
CitiesDOWNTOWN PROFILE
2
Retail Vitality
Downtown’s storefront businesses make up just 5% of all
All Retail storefront businesses in Toledo yet produce $24 million more
in retail sales per square mile than the citywide average.
TOTAL RETAIL BUSINESSES AND RESTAURANTS With four times as many storefronts per square mile as
the citywide average, downtown’s retail density creates an
Downtown City Region
engaging and active environment that boosts vibrancy. And
110 2,004 4,415 this retail serves more than just downtown residents. Of the
$86.3 million spent on retail in the study area, an estimated
$57.8 million—67%—came from people who don’t live
RETAIL INVENTORY (SF) PER SQUARE MILE downtown. Such a high share of spending by non-residents
underscores downtown’s value as a regional destination.
Downtown City Region
Overall, downtown’s retail inventory has higher vacancy
94 25 3 and lower leasing costs than the regional averages. This
combination suggests low demand for downtown retail
space, yet it doesn’t tell the whole story. Retail thrives within
NUMBER OF RESTAURANTS AND BARS
localized active and vibrant places in downtown. Even
Downtown City Region though more than a quarter of downtown retail space sits
vacant, heavily trafficked areas like Hensville have very few
84 654 1,411 vacancies. As downtown revitalization continues, less-central
retail locations will likely see growing demand.
Source: ConnecToledo (2019); ESRI Retail Marketplace Profile Report (2019)
Retail Market
Downtown
Retail Sales Vitality
Share of City SQUARE Downtown Region
Annual FEET OF
Spending $86M 2% RETAIL 1.3M n/a
RETAIL Downtown Region
Revenue per
square mile $73M VACANCY
RATE 24% 14%
RETAIL Downtown Region
RENT (SF)
$6.74 $8.36
Source: ESRI Retail Marketplace Profile Report (2019)
TRIPLE NET
Source: Downtown Toledo Master Plan (2017), Reichle Klein Report (2017)
downtown.org | © 2019 International Downtown Association 25
292 DOWNTOWN PROFILE
Live Events and Entertainment
Downtown’s greatest asset may lie in the strength and
diversity of its entertainment offerings. Certainly, the local Downtown
consensus holds that events, arts, and entertainment
launched and continue to fuel downtown’s revitalization.
Events
In particular, the area immediately around Fifth Third Field
and Huntington Center, where sporting events and arena
concerts take place, has injected new energy into downtown
and boosted economic growth.
In 2018, Livability.com published “5 Reasons Millennials
Should Give Toledo, OH, a Second Look,” an article
34
EVENT VENUES
1
FARMERS
highlighting several key selling points for the city. Each item WITH LIVE MARKET
on the list revolved around downtown—in fact, the list led ENTERTAINMENT
off with “A Vibrant and Evolving Downtown.” The article
3 2
points to the baseball Mud Hens’ 2002 arrival as the start
of downtown’s rebirth. New bars and restaurants opened
around the stadium to capitalize on the increase in visitors,
THEATRES PROFESSIONAL
which the opening of Huntington Center a few years later
LEVEL STADIUMS
compounded.
172 15
The second item on the Livability.com list, “Big City Arts
Scene,” focuses on the Toledo Museum of Art at the
western edge of downtown and on other arts offerings like
Art Loop, Valentine Theatre, and creative maker spaces like TOTAL ANNUAL TOTAL
FESTIVALS / CONVENTIONS
Gathered Glassblowing Studio.7 A strong nonprofit, The
PARADES WITH
Arts Commission, has worked to foster local arts since 1959
1,000+ ATTENDEES
by launching multiple creative public events and innovative
150,000
programs. In addition to Art Loop, The Arts Commission
also runs the Creative Placemaking Program, which aims to
use arts, culture, and creative process as tools for promoting
downtown revitalization. The commission’s efforts to support CONVENTION ATTENDEES
and develop local creative talent has helped strengthen and
expand Toledo’s arts ecosystem. Source: ConnecToledo (2019), Destination Toledo Convention & Visitors Bureau (2019)
Another article on Livability.com ranked Toledo as the top
minor-league sports city in the U.S. In 2019, the Mud Hens Winter Festival, Toledo PRIDE and Zombie Crawl. In August
drew 418,500 fans during their season, and the Walleye set 2021, Toledo will host the Solheim Cup, a prestigious female
a new record for attendance—more than 280,000 helped golf competition with anticipated attendance of 160,000.
sell out 25 home games over the previous two seasons. Not Departing from tradition, the Solheim Cup organizers plan
only do these teams attract die-hard fans, but they also host to use downtown and not the golf course as the main venue
family-friendly events before the game and during breaks in for the opening ceremonies. Downtown’s vibrancy played a
play to attract casual fans and families. 8, 9 significant role in tipping the choice of a host city to Toledo.
Downtown provides the setting for large annual events
throughout the year. Among the largest are the Fire + Ice
26
30 IDA
IDA | | The
The Value
Valueof
ofU.S.
U.S.Downtowns
Downtownsand
andCenter
CenterCities
CitiesDOWNTOWN PROFILE
2
Identity | Visitation, Heritage, Tradition
Downtowns and center cities preserve the heritage of a place, provide a common point
of physical connection for regional residents and contribute positively to the brand of
the regions they anchor.
Downtowns are “iconic and powerful symbols for a city and
often contain the most iconic landmarks, distinctive features,
and unique neighborhoods. Given that most downtowns
were one of the oldest neighborhoods citywide, they offer
rare insights into their city’s past, present, and future.”10
The authentic cultural offerings in downtown enhance its
character, heritage, and beauty, and create a unique sense of
place not easily replicable in other parts of the city.
Benefits of Identity: Brand, Visitation, Heritage, Tradition,
Memory, Celebration, Fun, Utilization, Culture
Social Media
Downtown represents the heart of the city and its cultural
33,212
PHOTOS POSTED ON center. Toledo takes great pride in its historical roots as a
INSTAGRAM WITH city built by and for makers and manufacturers. It earned
#DOWNTOWNTOLEDO
the moniker “The Glass City” for a long history of glass
production and manufacturing, both industrial and artistic.
12,400
FOLLOWERS ON TWITTER Glass production remains a big part of Toledo’s economy,
@DOWNTOWNTOLEDO with both Owens Corning and Libbey still headquartered
downtown. Glassblowing workshops and studios occupy
multiple creative spaces around the city. The Toledo Museum
24,432
FOLLOWERS ON FACEBOOK
of Art features unique pieces of glass art in its collection, and
DOWNTOWN TOLEDO
Gathered Glassblowing Studio showcases glass home décor
and custom items. Fiat Chrysler’s strong presence, focused
* Source: Instagram, Twitter, and Facebook counts as of December 11, 2019 on Jeep production, continues the city’s long history as a
major center of the automotive industry. Toledo celebrates
its relationship with the automotive industry at the annual
Jeep Fest, which in 2019 drew more than 70,000 people
from 32 states for a parade and three days of Jeep-themed
events.
downtown.org | © 2019 International Downtown Association 27
312 DOWNTOWN PROFILE
Having grown up along the Maumee River, Toledo continues
to identify strongly with its riverfront, which still supports
domestic and international cargo operations. The City has Downtown Destinations
invested significantly in renewing its connection to the
river. Recently renovated Promenade Park has become a
popular waterfront venue for outdoor events and concerts.
It will soon have a complement across the river in the
Glass City Metropark. In late 2019, Metroparks Toledo
20 2
awarded an $8 million contract for construction of the first
phase of the 30-acre green space. The launch of The Glass
City Metropark marks a big step in the larger Glass City
Riverwalk plan backed by ConnecToledo. That plan, born HISTORIC MUSEUMS
from the Downtown Toledo Master Plan, aims to activate STRUCTURES
the waterfront up and down the river, create a valuable
community and regional amenity, and increase recreational
opportunities and open space along the water for residents
and visitors alike.
4 9
Close to 10% of all citywide hotel rooms are located
downtown, speaking to its significance as a destination for
visitors. That said, there are only 2 hotels, with 535 rooms, in
downtown, among the lowest counts of the downtowns in PLAZAS / SQUARES / PARKS
the study. AMPHITHEATERS
Hotels
57
PUBLIC ART INSTALLATIONS
DOWNTOWN CITY
HOTELS 2 52 Source: National Register of Historic Places (2019); Metroparks Toledo Park Inventory
(2017); Lucas County (2017); ConnecToledo (2019)
HOTEL ROOMS 535 5,598
VISITORS 3,000,000 n/a
Source: Destination Toledo Convention & Visitors Bureau (2019)
28
32 IDA
IDA | | The
The Value
Valueof
ofU.S.
U.S.Downtowns
Downtownsand
andCenter
CenterCities
CitiesDOWNTOWN PROFILE
2
Resilience | Sustainability, Diversity
At its broadest, resilience means a place’s ability to withstand shocks and stresses.
Thanks to their diversity and density of resources and services, center cities and their
residents can better absorb economic, social, and environmental shocks and stresses
than other parts of the city.
Diversity and economic vitality equip downtowns and center Economic Resilience
cities to adapt to economic and social shocks better than As noted earlier, the regional economy took a major hit
more homogenous communities. Similarly, density better during the Great Recession and still hasn’t fully recovered.
positions downtowns and center cities to make investments As downtown continues to rebuild employment numbers,
needed to hedge against and bounce back from increasingly encouraging a variety of industry sectors can help weather
frequent environmental shocks and stresses. future shocks to any one sector. Strong growth in the number
of residents with bachelor’s and advanced degrees also
Benefits of Resilience: Health, Equity, Sustainability, means that more residents stand better equipped to handle
Accessibility, Mobility, Durability of Services, Density, changing economic conditions.
Diversity, Affordability, Civic Participation, Opportunity,
Scale, Infrastructure
Downtown Community Resources
1
LIBRARY
3
RECREATION AND
12
RELIGIOUS
9
PARKS AND
3
POSTSECONDARY
7
PRIMARY AND
COMMUNITY INSTITUTIONS NATURAL INSTITUTIONS SECONDARY
CENTERS AREAS SCHOOLS
Source: Toledo-Lucas County Public Library (2019); Metroparks Toledo Park Inventory (2017); ConnecToledo (2019)
downtown.org | © 2019 International Downtown Association 29
332 DOWNTOWN PROFILE
Social Resilience
Downtowns function as hubs for social resilience. Their
dense nature gives a diverse mix of residents and employees
Downtown Residents
access to a multitude of community resources in a small area. Commuting Patterns*
Nine parks and natural areas, the main branch of the newly
renovated Toledo Lucas County Public Library, a recreation BIKE
center and 12 religious institutions together give residents, Downtown City Region
employees, and visitors multiple places to meet, learn, and
participate in civic life.
0% 0% 0%
TRANSIT
Access to these resources plays a critical role in boosting social Downtown City Region
resilience, particularly for low-income residents. About 1,700
residents, or 45% of the downtown population, live in poverty. 7% 3% 1%
This high proportion suggests that a large group of residents CAR POOL
rely on these resources. Typically, residents of downtowns with Downtown City Region
good access to resources have a higher life expectancy than
the population citywide. As well, fewer residents of downtowns 6% 9% 8%
typically report being physically inactive. Life expectancy for WALK
downtown residents in Toledo, however, falls nearly five years
Downtown City Region
below the regional average, and their rate of physical inactivity
is four percent higher. 17% 3% 3%
Despite the prevalence of lower-income households, only 19%
of renter households pay more than 30% of income toward DRIVE ALONE
housing. This number—surprisingly low for an urban place— Downtown City Region
indicates that downtown remains largely affordable for those
who live there. A high level of subsidized housing units— 69% 84% 87%
nearly one third of all housing—has helped keep downtown’s *Percentages may not add up to 100% due to rounding and exclusion of taxicabs.
housing affordable. Maintaining affordability so that housing
Source: American Community Survey 5-Year Estimates (2013-2017)
remains an option for households at all income levels will
strengthen the community’s social fabric.
Social
Resilience
DOWNTOWN CITY
RESIDENTS IN
POVERTY 1,684 72K
RENT-BURDENED
RESIDENTS 711 27K
AVERAGE LIFE
EXPECTANCY (CBD) 72.1 n/a
NO LEISURE-TIME
PHYSICAL ACTIVITY 37% 33%
Source: American Community Survey 5-Year Estimates (2013-2017); CDC (2018)
30
34 IDA
IDA | | The
The Value
Valueof
ofU.S.
U.S.Downtowns
Downtownsand
andCenter
CenterCities
CitiesDOWNTOWN PROFILE
2
Environmental Resilience
Mobility Options Downtown ranks as much more walkable than the city at
large, making downtown households less reliant on vehicles
DOWNTOWN CITY REGION to get where they need to go. Partially as a result, an average
BIKESHARE downtown household produces three fewer tons of CO2
STATIONS 17 n/a n/a annually than an average city household (or 41% less) and
DOCKED four fewer tons than an average regional household (49%
BIKES 75 75 75 less). Downtown has also laid the groundwork for increasing
its supply of open space and parks. The Glass City Riverwalk,
SCOOTERS 0 50 50 described in the Identity section, represents the first step in a
TOTAL TRANSIT wider plan to bring investment to the banks of the Maumee
STOPS INCLUDING
RAIL AND BUS
84 2,183 2,441 River with the aim of creating a green community amenity.
Downtown’s Walk Score and Bike Score fall on the lower end
of the scale for an urban place, but as residential density
Source: ToleGO App (2019); Lime Scooters (2019); Toledo Area Regional Transit Authority (2019)
increases and it becomes easier for people to run daily
errands without needing a car, these scores will improve. Car
dependency has gotten worse: Since 2000, the number of
Environmental downtown residents not driving alone to work has dropped
Resilience 20%, and the number driving alone has doubled. Despite
those disappointing trends, downtown still does better than
DOWNTOWN CITY REGION the city overall, with 15% fewer residents driving alone to work
than residents citywide.
ACRES OF OPEN
SPACE 24 3K 50K Toledo has taken steps to reduce its car dependence in
recent years. The City’s Division of Engineering Services
% OF LAND FOR
OPEN SPACE 3% 6% 6% commissioned a study to assess the state of downtown’s
transportation systems and highlight opportunities for and
ANNUAL GHG challenges to creation of a safe, efficient, and equitable
EMMISIONS PER
HOUSEHOLD
4.4 7.5 8.6 mobility network. In public meetings the planning team
gathered input on what the public would like to see in
(IN TONS) downtown. The plan calls for a complete overhaul of Summit
Street, downtown’s signature thoroughfare, to make it more
Source: Metroparks Toledo Park Inventory (2017); Center for Neighborhood Technology (2017) pedestrian-friendly. The redesign will add on-street parking,
new lighting, landscaping, and a wider median. In 2019,
the Toledo Area Regional Transit Authority (TARTA) spent
Walk, Bike and Transit Scores Downtown $2.15M to build a new transit center on the northern edge
City
of downtown.11 Additionally, the City of Toledo Bike Plan,
79 published in 2016, calls for investing $32 million to build more
46 than 100 miles of bicycle infrastructure across the city, with
several trails crossing through downtown. These actions and
projects demonstrate a strong will to invest in and improve
53 alternate transportation options and encourage more
45
sustainable modes of transportation.
Source: Walk Score (2019)
downtown.org | © 2019 International Downtown Association 31
35You can also read