The Science of Science - Dashun Wang
←
→
Page content transcription
If your browser does not render page correctly, please read the page content below
The Science of Science

 Dashun Wang and Albert-László Barabási

 Part 3: The Science of Impact

 This is the submitted version.
 The printed version1 is published by Cambridge University Press in 2021.

 1
 Wang, Dashun, and Albert-László Barabási. 2021. The Science of Science. Cambridge University Press.
doi:10.1017/9781108610834.

 1
“If I have seen further, it is by standing on the shoulders of giants,” wrote Isaac Newton in a letter to

Robert Hooke on February 1676 [1]. That oft-quoted line succinctly captures a fundamental feature of

science: its cumulative nature. Indeed, scientific discoveries rarely emerge in isolation but tend to build on

previous work by other scientists. Scientists throughout the ages have typically acknowledged the

provenance of the ideas they built upon. Over time this custom has turned into a strict norm, giving rise to

citations.

 A citation is a formal reference to some earlier research or discovery, explicitly identifying a particular

research paper, book, report, or other form of scholarship in a way that allows the reader to find the source.

Citations are critical to scientific communication, allowing readers to determine whether previous work

truly supports the author’s argument. Used appropriately, they help the author bolster the strength and

validity of their evidence, attribute prior ideas to the appropriate sources, uphold intellectual honesty, and

avoid plagiarism. For the author, citations offer a vehicle to condense and signal knowledge and eliminate

the need to reproduce all of the background information necessary to understand the new work.

 Lately, however, citations have taken on an additional role: the scientific community has begun using

them to gauge the scientific impact of a particular paper or body of work. This is possible, the thinking

goes, because scientists only cite papers that are relevant to their work. Consequently, groundbreaking

papers that inspire many scientists and research projects should receive many citations. On the other hand,

incremental results should receive few or no citations.

 Yet as straightforward as this linkage between impact and citations may appear, it is fraught with

ambiguity: How many citations constitutes “a lot”? What mechanisms drive the accumulation of citations?

And what kinds of discoveries tend to garner more citations? Can we know how many citations a paper will
collect in the future? How soon can we tell if a discovery has sparked serious interest? We must also take

a step back and ask what citation counts tell us about the validity and impact of the ideas described in the

paper. Put simply: Are citations meaningful at all?

 We seek quantitative answers to these questions in the next six chapters. We have previously examined

a range of patterns underlying individual scientific careers and collaborations in the first two parts of this

book. Now that we have understood a lot more about the “producers” of science, be it individuals or teams,

it is now time to focus on what they produce. Our first question is therefore, how many papers have we
produced? For that, we need to go back to 1949 and pay a visit to Singapore.

 2
Chapter 3.1

Big Science

 In 1949, Derek de Solla Price was teaching applied mathematics at Raffles College in Singapore when

the college’s new library received a complete set of the Philosophical Transactions of the Royal Society of

London. Published since 1662, Philosophical Transactions was the first journal exclusively devoted to

science. As the library was still waiting for its future building, de Solla Price kept the volumes at his bedside.

He spent the next year reading the journals cover to cover, sorting each decade of volumes into a separate

pile. One day, as he looked up from his reading, he made a curious observation: the pile for the first decade

was tiny, and the second only slightly taller. But as the decades went on, the height of the piles began to

grow faster and faster, accelerating wildly in the most recent decades. Altogether, the 28 piles formed what

looked like a classic exponential curve.

 It was an observation that sparked a lifetime of passion—in the following decades, de Solla Price

would systematically explore how science grew over time. By 1961, he had counted everything he could

get his hands on: the number of scientific journals, the number of scientists who contributed to them, and

the total number of abstracts in multiple fields [2]. No matter which dimension he charted, the same

exponential curve greeted him, confirming his original insight that science was accelerating [2].
“[E]xponential growth, at an amazingly fast rate, was apparently universal and remarkably long-

lived,” he concluded [3].

 But, de Solla Price was quick to realize, such exponential growth is rarely sustainable. We know that

from studies on bacterial colonies: the number of bacteria grows exponentially in the beginning, but

eventually the nutrients that sustain their growth are exhausted, and the growth saturates. Hence, de Solla

Price predicted that the exponential growth of science must represent merely an initial growth spurt.

Science must run out of steam and saturate eventually. He even went as far as to predict that the rapid

growth in science should taper off shortly after the 1950s [4].

 3
As we show in this chapter, while his observation was real, his prediction was wrong. The exponential

growth of scientific research has continued virtually uninterrupted since de Solla Price’s time, dramatically

reshaping the world along the way.

3.1.1 The Exponential Growth of Science

Figure 3.1.1 The Growth of Science. The number of papers catalogued in the Web of Science (WoS)
published over the past century, illustrates the exponential growth of the scientific literature. It was only
disrupted around 1915 and 1945 due to the World Wars. The figure also shows the growth of the physics
literature, which follows an exponential growth similar to that followed by science as a whole. After Sinatra et
al. [5].

 Figure 3.1.1 shows the number of publications indexed yearly by Web of Science (WoS), documenting

that for over a century the number of published papers has been increasing exponentially. On average, the

total number has doubled roughly every 12 years. The figure also shows that science did not saturate after

the 1950s as de Solla Price expected. Rather, its exponential growth has continued for the past 110 years,

an expansion that was halted only temporarily by the two World Wars. Moreover, if we measure the growth

rate of a single discipline, such as physics, we find similar exponential growth (Fig. 3.1.1). The fact that

individual disciplines have accelerated in the same fashion suggests that the expansion of science is not

simply driven by the emergence of new fields, but is instead a feature that applies across different areas of

science.

 What has the exponential growth of science meant for science, and for scientists? In this chapter, we

will attempt to answer these complex questions.

 4
Box 3.1.1 How many papers are there?

 Considering the exponential growth of science over the centuries, you might wonder how many papers has

science produced. In 2014, researchers estimated the total number of scholarly documents on the Internet using a

“mark and recapture” method [6] (originally developed by ecologists to estimate the population size of wild animals

when they cannot count every individual). They found that back then, there were at least 114 million English-language

scholarly documents accessible on the web. Obviously, given the size of the Internet, we will never know the precise

number of scholarly documents out there. But whatever the estimated number may be at any given point in time, it

would quickly become outdated. Indeed, thanks to the exponential growth of science, by March 2018, four years after

the 114 million estimated, Microsoft Academic Search has indexed more than 171 million papers [7].

3.1.2 The meaning of exponential growth

 Any system following an exponential growth must expand at a rate proportional to its current size.

Since the scientific literature doubles roughly every 12 years, this means that of all scientific work ever

produced, half of it has been produced in the last 12 years. Thus, science is characterized by immediacy

[3]: the bulk of knowledge remains always at the cutting edge. Furthermore, with an ever-growing number

of scientists, scientists are often contemporaneous with those who have revolutionized their discipline. This

is well captured by de Solla Price in his book, Little Science, Big Science, and Beyond [3]:

 “During a meeting at which a number of great physicists were to give firsthand accounts of

 their epoch-making discoveries, the chairman opened the proceedings with the remark: ‘Today

 we are privileged to sit side-by-side with the giants on whose shoulders we stand.’ This, in a

 nutshell, exemplifies the peculiar immediacy of science, the recognition that so large a

 proportion of everything scientific that has ever occurred is happening now, within living

 memory. To put it another way, using any reasonable definition of a scientist, we can say that 80

 to 90 percent of all the scientists that have ever lived are alive now.”

 To understand what this exponential growth has meant for individuals, imagine a young scientist at
the beginning of her career [3]. After years of reading the literature, with guidance from knowledgeable

 5
mentors, she has finally reached the frontier of her discipline, and is ready to strike out on her own. If

science had stopped growing years ago, she would be voyaging alone into uncharted seas. While happily

making discovery after discovery, she would also be quite lonely, having relatively few peers with whom

to collaborate or learn from. Hence, in this respect, the continual growth of science is good news, supplying

ample like-minded colleagues and interesting ideas, so that scientists can build on the work of one another

and explore the world of unknowns together.

 But the rapid expansion of science gives rise to another problem. As our young scientist unties the

rope and tries to sail away from the harbor, she will find that there are many other boats, big and small,

headed in the same direction, captained by peers with the same level of training, ambition, determination,

and resources. This competitive environment will have serious consequences for our young scientist

throughout her career.

 First, try as she might, it will not be possible for her to monitor closely where each boat is headed.

While the volume of new knowledge grows exponentially, the time a scientist can devote to absorbing new

knowledge remains finite. As such, it is impossible for an individual today to read every paper in her own

field.

 Perhaps more importantly, each of those boats is hoping to discover something new. Indeed, in science,

priority for a discovery has always been of key importance. Our young scientist would want to chart a new

water than to sail in the wake of others. But so much competition may affect the individual’s odds of making

that grand discovery.

 Many people have a heroic conception of science, believing that the field is moved forward by a small

number of geniuses. But in reality, groundbreaking discoveries are often the culmination of years of hard
work by many scientists. A “Eureka” moment happens when someone acknowledges what came before and

manages to take the next logical leap. Indeed, Francis Bacon once argued, all innovations, social or

scientific, “are the births of time rather than of wit” [8]. In other words, apples fall when they are ripe,

regardless of who is around to harvest them. Thus, if a scientist misses a particular discovery, someone else

will discover it instead. After all, if we already have a steam engine and a boat, how long will it take for

someone to invent a steamboat?

 This perhaps underlies one of the most important ways in which science differs from other creative
endeavors. If Michelangelo or Picasso had never existed, the sculptures and paintings we admire in art

 6
museums would be quite different. Similarly, without Beethoven, we would not have the 5th Symphony,

nor the distinctive “Pa pa pa PAM!” However, if Copernicus had never existed, we would not have arrived

at an alternative description of the solar system—sooner or later we would have figured out that earth orbits

around the sun, and not the other way around.

 This has important implications for scientists: Apples may not care who harvests them—but for apple

pickers, being the first to reach a ripe apple is critical. If science is a race to be the first to report a discovery,

then the exponential growth of science poses a major question: Did the increasing competition make it more

difficult to practice science?

 The answer is not obvious. After all, as spectacular as the recent growth of science has been, the

historical record suggests that pressures to digest and create new knowledge are not new. For example, in

1900, after being scooped by Pierre and Marie Curie on a radioactivity paper, Ernest Rutherford wrote: “I

have to publish my present work as rapidly as possible in order to keep in the race.” [9] (See Box 3.1.1).

Or consider this confession [3]:

 “One of the diseases of this age is the multiplicity of books; they doth so overcharge the world

 that it is not able to digest the abundance of idle matter that is every day hatched and brought

 forth into the world.”

This passage by Barnaby Rich dates back to 1613, half a century before the publication of the first scientific

journal. Clearly the experience of feeling overwhelmed by the quantity of existing knowledge—and

daunted by the prospect of adding to it—predates our generation. So, is practicing science really getting

harder? To find out, let’s break down the steps required to become a successful scientist, examining how

each step has evolved in this age of big science.

Box 3.1.2 The birth of “Letters” Letters are a common publication format in many journals, such as Nature or

Physical Review Letters. But the title may seem deceiving; these “letters” are usually complete research papers, rather

than anything resembling a letter. So where does the name come from? It traces back to Ernest Rutherford, whose

pragmatic choice of communicating his research shaped the way we disseminate scientific knowledge today [10].

 7
At the beginning of the twentieth century, being the first to make a discovery was already an important goal; however,

very few journals published frequently enough to allow for the rapid dissemination of new discoveries [11]. One such

journal was Nature, which was published weekly and was read by European (mainly British) scientists, Rutherford’s

primary competition and audience. He cleverly started using the “Letters to the Editor” section—a column traditionally

dedicated to comments on someone else’s work—as a way to rapidly communicate his own discoveries and establish

priority. If you read Rutherford’s “letters” as far back as 1902, you will find that they look more like scientific papers

than short commentaries. This Trojan Horse approach proved so successful that it was soon adopted by Rutherford’s

students and collaborators, notably Otto Hahn, Niels Bohr and James Chadwick. By the 1930s Otto Frisch, Lise

Meitner, and the “Copenhagen school” of physicists working with Bohr had adopted it, eventually morphing the letters

section into the format we know today.

3.1.3 Is it getting harder to become a scientist?

Figure 3.1.2 How long does it take to get a PhD in the United States? In 2007, it took a median of 7.2
years to complete a science or engineering PhD. After Cyranoski et al. [12].

 Becoming a scientist these days requires a few essential steps, from getting the appropriate degree, to

finding employment that allows the individual to pursue science. The rapid growth of training opportunities

and that of the scientific workforce have affected both of these steps.

Obtaining a PhD

 Figure 3.1.2 plots the time it takes to complete a science PhD in the United States, showing that the

process today takes only slightly longer than it did 40 years ago. Despite a slight downward trend in the last

two decades, the average time to degree in the life sciences and engineering remains six to eight years. In

 8
fact, the five years quoted by most Ph.D. programs, remains a dream for most candidates—less than 25%

of students manage to complete degrees within this period [13, 14]. Instead, 55% of candidates require

seven or more years to complete their degree. And these statistics only count the individuals who do obtain

a degree, obscuring the fact that 40% to 50% of candidates who begin their doctoral education in the US

never graduate [13, 15].

 It certainly seems easier than ever to begin doctorate training, given the rapidly growing number of

programs. But, why does it take so long to acquire a PhD? Multiple measures show that, once enrolled in the

program, it is getting harder to produce the dissertation required for graduation.

 Consider, for example, the length of the thesis itself: the average length of biology, chemistry and

physics PhD theses nearly doubled between 1950 and 1990, soaring from 100 pages to nearly 200 pages in

just four decades [16]. The number of references contained in a paper has been also rising over the years

[17], indicating that research papers today build on a larger body of previous knowledge than ever before.

Finally, the bar for publishing that dissertation—often a key milestone for aspiring scientists—has also

grown higher: Comparing biology papers published in three major journals in the first six months of 1984

with the same period in 2014, researchers found that the number of panels in experimental figures (the charts

and graphs published alongside papers) rose two- to four-fold [18], indicating that the amount of evidence

required for a successful publication has increased significantly.

 These statistics make clear how hard it has become to earn a PhD. But completing one’s degree is only

the first step toward a successful career in science.

 9
Figure 3.1.3 The academic pipeline. Since 1982, almost 800,000 PhDs have been awarded in science and
engineering (S&E). These graduates competed for about 100,000 academic faculty positions. The number
of S&E PhDs awarded annually gradually increased over this time frame, from 19,000 in 1982 to 36, 000
in 2011. Yet the number of faculty positions created each year has remained stable or even fallen slightly.
In 2010, the 40,000 PhD candidates competed for roughly 3,000 new academic positions. After
Schillebeeckx et al. [15].

Securing an Academic Job

 Price’s observation that “80 percent to 90 percent of the scientists who ever lived are alive now”

memorably illuminates the exponential growth of the scientific workforce. Yet not all parts of the academic

pipeline have expanded equally quickly. For example, the number of science doctorates earned each year

grew by nearly 40% between 1998 and 2008, reaching 34,000 across the 34 countries that constitute the

Organization for Economic Co-operation and Development (OECD) [12]. In the same three decades,

however, the number of faculty positions in those nations has remained largely unchanged and even fallen

slightly (Fig. 3.1.3) [15].

 While not everyone with a PhD aims to secure an academic position, the vast majority of PhDs

today do seem to prefer an academic career to alternatives in industry, government, or non-profits. In a

world-wide survey conducted by Nature in 2017, nearly 75% of the 5,700 doctoral students polled preferred

a job in academia to these non-academic alternatives [19]. For them, the trend shown in Fig. 3.1.3 may seem

disheartening, showing a steadily growing PhD pool competing for a fixed number of opportunities.

Box 3.1.3 Academic pipelines around the world. The United States produced an estimated 19,733 PhDs in the life

and physical sciences in 2009 [12], a number that has continued to increase ever since. But the proportion of science

PhDs who secure tenured academic positions has been dropping steadily, and industry has not been able to fully absorb

the slack. In 1973, 55% of US doctorates in the biological sciences had secured tenure-track positions six years after

completing their PhDs, and only 2% were still in a postdoc or other untenured academic position. By 2006, the fraction

of graduates who had secured a tenure-track position within six years dropped to 15%—but 18% were now holding

untenured positions.

The number of PhD holders in mainland China is also going through the roof, with some 50,000 students graduating

with doctorates across all disciplines in 2009, more than twice the number of US degree recipients. However, thanks

to China’s booming economy, most Chinese PhD holders quickly find jobs in the private sector.

 10
Japan, too, has sought to get its science capacity on par with the West. In 1996, the country’s government announced

an ambitious initiative to increase the number of Japanese postdocs to 10,000, and stepped up PhD recruitment to meet

that goal. Yet, the government gave little thought to where all those postdocs would find jobs once their fellowship

ends. Even though the government once offered companies a subsidy of around 4 million yen (US$47,000) to hire

these well-educated individuals, the country still has 18,000 former postdocs who are still unemployed.

 One consequence of increasing PhD production is a booming number of postdoctoral fellowships,

representing short-term, non-tenure track research positions. As Fig. 3.1.4 illustrates, the number of

researchers in US postdoctoral positions has more than tripled since 1979, with growth particularly

prominent in the life sciences. Although postdocs drive research in many disciplines, they are often poorly

compensated. Five years after receiving a PhD, the median salaries of scientists in tenure-track positions or

industry far outstrip those of postdocs.

Figure 3.1.4 The Postdoc Pileup. The number of researchers in US postdoctoral positions has more than
tripled since 1979. The vast majority of postdocs are in the life sciences. Across fields, median postdoc

 11
salaries are outstripped by those who choose non-postdoc careers, when measured up to five years after
receiving a PhD. After Powell [20].

 Such bleak prospects for landing a full-time university job means that many scientists have to seek

alternatives outside academia. But how well do they fare once they leave science? To answer this question,

researchers collected data in eight American universities and linked anonymized Census data on

employment and income to administrative records of graduate students at these universities [21]. Focusing

on those PhD students who graduated between 2009 and 2011, they found that almost 40% had entered

private industry, with many getting jobs at large, high-wage establishments in the technology and

professional services industries. Top employers included electronics, engineering and pharmaceutical

companies. These results show that PhDs who leave science tend to navigate toward large firms and earn a

median salary of more than $90,000. Related research also suggests that scientists in the private sector

experience very low unemployment rates overall [22]. According to the National Science Foundation’s

Survey of Doctorate Recipients, just 2.1% of individuals with doctorates in science, engineering or health

in the United States were unemployed in 2013, while the overall national unemployment rate for people

aged 25 and older was 6.3%.

 Together, these data show that for the voyagers, the ocean of knowledge and opportunities is getting

increasingly crowded. As the number of PhDs grows and the number of available university posts remains

constant, competition intensifies, leading to a soaring number of postdocs, and more people leaving

academia to pursue careers elsewhere. But it is important to note that this trend is not necessarily detrimental

to society, nor to the scientists who pursue a wide range of careers. All signs so far indicate that PhDs who

leave science do tend to find fulfilling jobs. And while they may not be creating knowledge in the scholarly

sense, their work often leads to critical patents, products, and innovative solutions. As such, the loss for

science is often a gain for the society.

3.1.4 Is science running out of gas?

 As we stated earlier, apples fall when they are ripe—that is, scientific breakthroughs are possible

once a critical mass of knowledge has been amassed. But with more and more people trying to harvest ripe

 12
apples, has the remaining fruit on the tree become harder to reach? More specifically, do new discoveries

require more effort now than they did in the past?

 Tracking changes in productivity can help us answer this question. Economists define productivity

as the amount of work-hours required to produce an output, like building a car or printing a book. In science,

it corresponds to making a new discovery, measuring the amount of effort required to write a research

paper. As we have shown, both scientific discoveries and the scientific workforce have been growing

exponentially for decades. But depending on which has grown faster, the average productivity per scientist

may be either rising or falling. And if scientific productivity has indeed decreased, that would imply that

more labor is now required to achieve any breakthrough—in other words, that science may be becoming

more difficult.

 Consider a related example from the computer industry. In 1965, Intel co-founder Gordon Moore

noticed that the number of transistors per square inch on integrated circuit boards (now called microchips)

had doubled every year since their invention. He predicted that this trend would continue into the

foreseeable future. Moore’s prediction proved correct: For nearly half a century, the chip density has indeed

doubled approximately every 18 months, representing one of the most robust growth phenomena in history.

But this growth required the efforts of an ever-increasing number of researchers [23]. Indeed, the number

of individuals required to double chip density today is more than 18 times larger than the number required

in the early 1970s. Therefore, even though processing power continues to grow exponentially, when it
comes to producing the next generation of microchip, individual productivity has plummeted; every new

release requires unprecedented amounts of manpower. Similar patterns have been observed in a wide array

of industries, from agricultural crop yields to the number of new drugs approved per billion dollars spent

on research [23]. This means that in these industries, the exponential growth of progress hides the fact that

“apples” are indeed getting harder and harder to find.

 In science, while the number of publications has grown exponentially, large-scale text analysis of

physics, astronomy, and biomedicine publications revealed that the number of unique phrases in article

 13
titles has grown only linearly [24]. This suggests that the cognitive space of science—approximating the

number of distinct scientific ideas in existence—may be growing much slower than scientific outputs.

 So, is science running out of gas? As shown in this chapter, the exponential increase of scientific

publications is indeed accompanied by an exponential growth in the number of scientists. But, if we

compare the two growth rates across a large variety of disciplines, ranging from computer science to physics

and chemistry to biomedicine, we find that the former is often comparable with the latter [25]. Indeed, as

we discussed in Ch. 1.1, in science, individual productivity has stayed relatively stable over the past century,

and even increased slightly in recent years.

 As scientists look back upon the 20th century, we marvel at the discoveries and inventions that our

predecessors have made, from internal combustion engines to computers to antibiotics. The tremendous

progress in these areas could imply diminishing returns, as the sweetest, juiciest apples are already

harvested. Yet this does not seem to be the case. The data suggests that we are poised to discover and invent

even more in the next twenty years than we have in all of scientific history. In other words, even after a

century of breakneck progress, science today is fresher and more energetic than ever.

 How can science continue to run tirelessly after a century of exponential growth? Because unlike a

car or a colony of bacteria, science runs on ideas. While a car will eventually run out of gas, and bacteria

will run out of nutrients, ideas are resources that grow the more they are used. Existing ideas give birth to

new ones, which soon begin to multiply. So, while our ability to further improve internal combustion

engines, computers, or antibiotics may indeed have diminished, we now look forward to new advances in
genetic engineering, regenerative medicine, nanotechnology, and artificial intelligence—fields that will

once again revolutionize science and our society, opening up whole new chapters beyond our wildest

imagination.

 14
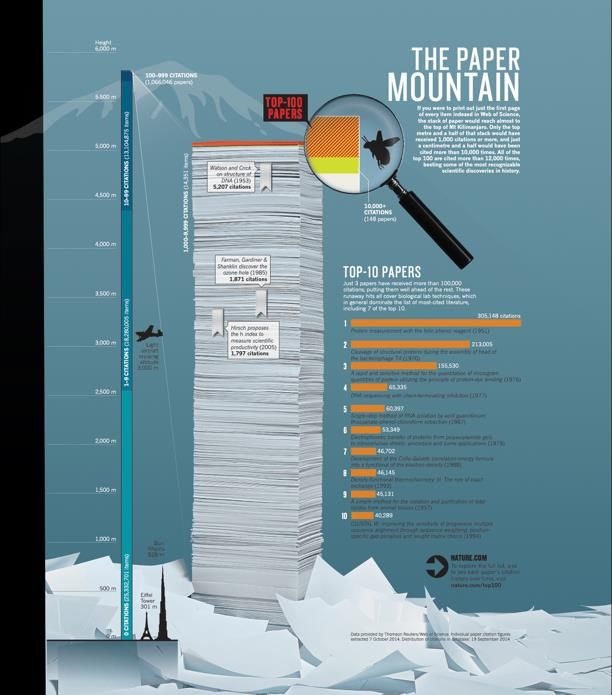
Chapter 3.2

Citation Disparity

 On the fiftieth anniversary of Eugene Garfield’s Science Citation Index (SCI), Nature teamed up with

Thomson Reuters to tally the number of papers indexed by SCI, counting 58 million in all [26]. If we were

to print just the first page of each of these papers and stack them on top of each other, the pile would reach

to the top of Mt. Kilimanjaro (Fig. 3.2.1).

 While this heap is certainly impressive, even more remarkable is the disparity in scientific impact that

the mountain hides. If we order the pages based on the number of citations each paper received, placing the

most cited ones on top and working downward, the bottom 2,500 meters—nearly half of the mountain—

would consist of papers that have never been cited. At the other extreme, the top 1.5 meters would consist

of papers that have received at least 1,000 citations. And just a centimeter and a half at the very tip of this

mountain would have been cited more than 10,000 times, accounting for some of the most recognizable
discoveries in the history of science.

 15
Figure 3.2.1 The Mountain of Science. If you print out just the first page of each research paper indexed
in Web of Science by 2014, the stack would reach almost to the top of Mt Kilimanjaro. Only the top meter
and a half of that stack would have received 1,000 citations or more, and just a centimeter and a half would
have been cited more than 10,000 times. The top 100 papers have all been cited more than 12,000 times,
including some of the most recognizable scientific discoveries in history. After Van Noorden [26].

3.2.1 Citation distribution

 The difference in impact among papers can be captured by a citation distribution, P(c), representing

the probability that a randomly chosen paper has c citations. de Solla Price was the first to compute this

distribution [27], relying on citation data manually curated by Garfield and Sher in the early 1960s [28].

For this he counted by hand the number of papers that had been cited once, twice, three times, and so forth.

 16
He found that most papers had very few citations, but that a handful of papers had many more. Plotting the

data, he realized that the citation distribution can be approximated by a power-law function,

 ( )~ − , (1.1)

with citation exponent γ ≈ 3.

 Most quantities in nature follow a normal or Gaussian distribution, commonly known as a bell curve.

For example, if you measure the height of all your adult male acquaintances, you will find that most of them

are between five and six feet tall. If you draw a bar graph to represent their heights, it will have a peak

somewhere between five and six feet, and will decay quickly as you move away from the peak in either

direction. After all, it is very unlikely that you know an eight-foot or a four-foot adult. Many phenomena,

from the speed of molecules in a gas to human IQ, follow a similar bell curve.

 Power laws like (1.1), however, belong to a different class of distributions, often called “fat-tailed

distributions.” The key property of these fat-tailed distributions is their high variance. For example, as Fig.

1.2 shows, the millions of papers with only a few citations coexist with a tiny minority of papers that have

thousands of citations (See Box 3.2.1 The 80/20 rule.) If citations were to follow a bell curve, we would

never observe such highly cited papers. Indeed, imagine a planet where the heights of the inhabitants follow

a fat-tailed distribution. On such a planet, most creatures would be quite short, under one foot—but we

would also occasionally encounter two-mile-tall monsters walking down the street. The strangeness of this

imaginary planet highlights the stark difference between the fat-tail distribution followed by citations and

the bell curves frequently seen in nature (Fig. 3.2.2).

 17
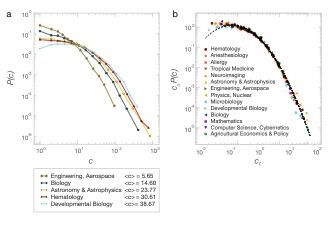
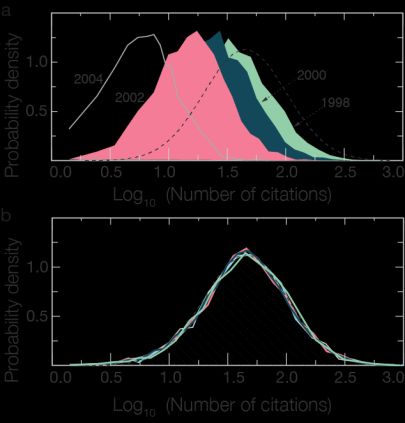
Figure 3.2.2 Illustrating normal, power-law, and lognormal distributions. (a) Comparing a power law
and a lognormal function to a normal distribution on a linear-linear plot. (b) The same comparison shown
on a log-log plot, helping us see the fundamental difference between the normal and fat-tailed distributions
in the high citation regime. A power law follows a straight line on a log-log plot, its slope indicating the
citation exponent γ. Sometimes, it can be difficult to tell lognormal and power laws apart, as they appear
similar on a log-log plot.

Box 3.2.1 The 80/20 Rule

Power law distributions are frequently seen in the context of income and wealth. Vilfredo Pareto, a 19th century

economist, noticed that in Italy a few wealthy individuals were earning most of the money, while the majority of the

population earned rather small amounts. Looking more closely, he concluded that incomes follow a power law [29].

His finding is also known as the 80/20 rule: He observed that roughly 80 percent of money is earned by only 20 percent

of the population.

Versions of the 80/20 rule apply to many situations with fat-tailed distributions [30-32]. For example, in business,

20% of sales reps typically generate 80% of total sales; on the World Wide Web, 80 percent of links lead to 15 percent

of webpages; and in hospitals, 20% of patients account for 80% of healthcare spending.

3.2.2 Universality of citation distributions

 There are remarkable differences in citations between disciplines. For example, biology papers

regularly collect hundreds or even thousands of citations, while a highly influential math paper may struggle

to collect a few dozen. These differences are illustrated in Fig. 3.2.3a, which depicts the distribution of

citations for papers published in 1999 across several disciplines. As these plots show, the probability of an

aerospace engineering paper gathering 100 citations is about 100 times smaller than the odds of a

developmental biology paper reaching the same threshold. These systematic differences indicate that simply

comparing the number of citations received by two papers in different disciplines would be meaningless.

The less-cited aerospace engineering paper may have reported defining discoveries in that field, whereas a

more cited biology paper may have reported a merely incremental advance within its discipline.

 18
Figure 3.2.3 Universality of citation distribution. a. The distribution of citations for papers published in
1999, grouped by discipline. The panel shows the probability P(c) of a paper receiving exactly c citations for
several scientific disciplines, illustrating that in some fields, like developmental biology, highly cited papers
are more common than in engineering. b. Rescaled citation distribution, illustrating that in fact all curves
shown in A follow the same distribution, once rescaled by ⟨ ⟩, the average number of citations in the same
field and year. The dashed line shows lognormal fit (1.2) to the data. After Radicchi et al. [33].

 To get a better idea of how influential a particular paper is, we can compare it to the average article in

its discipline. Dividing a paper’s citations by the average number of citations for papers in the same field

in the same year gives us a better measure of relative impact. When the raw citation counts are normalized

in this way, we find that the distribution for every field now neatly follows a single universal function (Fig.

3.2.3b). The finding that the curves that were so visibly different in Fig. 3.2.3a now collapse in a single

curve offers two important messages:
 (i) Citation patterns are remarkably universal. Whether you publish in math, the social sciences

 or biology, the impact of your work relative to your own discipline has the same odds of being

 mediocre, average, or exceptional as the research happening in every other building on campus

 (Fig. 3.2.2B).

 (ii) The universal curves are well approximated by a lognormal function
 1 −(ln − )2
 ( )~ ( ), (1.2)
 √2 2 2

 19
Box 3.2.2 A variety of functions capture citation distributions

As illustrated in Fig. 3.2.2, when plotted, fat-tailed distributions like the lognormal (1.2) or power-law function (1.1)

can appear quite similar to each other. But how do we know which function offers the best fit? Various studies have

argued that a variety of functions could capture the citation distribution—from power laws [31, 32, 34, 35] and shifted

power laws, [36] to lognormals, [33, 35, 37-42] to other more complicated forms [43-47]. How well these distributions

suit the data often depends on which corpus of papers researchers analyzed, the publication year, the selection of

journals, scholars, and their departments, universities, and nations of origin, to name a few factors. The mechanisms

governing the emergence of different forms for P(c) is an active research topic and will be discussed in the next

chapters.

 The universality of the citation distributions offers a simple way to compare scientific impact across

disciplines. Let’s focus on two hypothetical papers: Paper A is a computational geometry paper published

in 1978, which has collected 32 citations to-date; paper B is a biomedical paper published in 2002 with 100

citations. Although it may feel like an apples-to-oranges comparison, the relative citation function helps us

compare the impact of the two papers. To do so, we first take all computational geometry papers published

in 1978 and count their average citations. Similarly, we take all biomedical papers published in 2002, and

calculate their corresponding average. Comparing the raw citation counts of paper A and B to the averages

in their respective field and year provides a metric of relative impact for each, allowing us to make an

unbiased comparison between the two.

 In Table A1 (in Appendix), we calculate the average citation counts up to 2012 for all subject

categories in 2004. As the table reveals, the more papers in a particular subject area, the more citations its

average paper tends to receive—likely because there are more opportunities to be cited in that field. For

instance, the biological sciences have some of the highest average citation counts, mostly in the 20s,

whereas those in engineering and math have some of the lowest. There can be large differences even within

the same subject. For example, biomaterials, a hot subfield of material science averages 23.02. Yet, the

characterization and testing of materials, another subfield of material science, averages just 4.59.

Interestingly, the number of papers in the two areas are not that different (2,082 vs. 1,239), suggesting that

biomaterials papers are often cited in other disciplines.

 20
Box 3.2.3 The Widening Citation Gap

The Occupy Wall Street Movement, born during the 2008 economic crisis, highlighted the fact that in the US, 1% of
the population earns a disproportionate 15% of total income. This signals a profound income disparity, rooted in the
fact that the income distribution follows a power-law distribution. Yet the debate about the 1% is less about the
magnitude of its wealth than its trend over time: Income disparity has been skyrocketing for the last several decades
(Fig. B3.2.4).

Given that citations follow fat-tailed distributions, could there be a similar rise in impact disparity in science? To
answer this, we looked at the most-cited 1% of papers published in Physical Reviews journals in every year since
1893, measuring what fraction of total citations those papers received in the year following publication [48]. As Fig.
B3.2.4 shows, impact disparity in the physical sciences is indeed present, and has been rising steadily over the past
century.

Figure B3.2.4: The top 1% of Science. The fraction of income earned by the top 1% of the population in US between
1930 and 2010, and the share of citations received by the top 1% most cited papers in Physical Reviews. We used the
Physical Reviews (PR) corpus of 463,348 papers published between 1893 and 2009 to determine the share of citations
each paper gains the following year. After Barabasi, Song, and Wang [48].

3.2.3 What do citations (not) capture?

Many of the things you can count, don’t count. Many of the things you can’t count, do count.

 — Albert Einstein

 21
Citations and citation-based indicators are often used to quantify the impact or the quality of a paper.

These metrics play an important role both in science policy and in the evaluation of individual scientists,

institutions, and research fields. For example, citation counts are often discussed at hiring and tenure

decisions, as well as in prize recommendations. Furthermore, many countries consider them in decisions

pertaining to grants and other resources. Given their widespread use, it is easy to forget that citations are

merely a proxy for impact or scientific quality. Indeed, there are many ground-breaking scientific

discoveries that have received relatively few citations, even as less important papers amass hundreds.

Consider some of the reasons why this could be:

 • Review papers that summarize the state of a field or a topic, tend to be more frequently cited than

 regular articles, yet are often viewed as minor contributions to science than original research [49].

 • Sometimes citations seek not to build upon what came before, but rather to criticize or correct

 previous papers. These should be viewed as “negative citations”—yet citation counts do not

 distinguish between supporting and critical references [50].

 • Some citations may be “perfunctory,” simply acknowledging that other studies have been

 conducted without contributing to the main narrative of the discovery. Indeed, manual

 examinations of 30 articles in Physical Review on theoretical high energy physics from 1968 to

 1972 suggests that the fraction of such citations could be substantial [51]. This means, while each

 citation is counted the same, they have different roles in advancing science.

 All of which prompts the question: Are better-cited papers really better? To what degree do citations

correctly approximate scientific impact, or what working scientists perceive as important? A number of

studies have explored these questions. Overall, they find that citations correlate positively with other

measures of scientific impact or recognition, including awards, reputation [52], peer ratings [53-57], as well

as the authors’ own assessments of their scientific contributions [49]. For example, a survey of the 400

most-cited biomedical scientists asked each of them a simple question [11]: Is your most highly cited paper

also your most important one? The vast majority of this elite group answered yes, confirming that citation

counts do constitute a valuable metric for a paper’s perceived significance.

 But would other researchers in the field agree? If we picked two papers in the same field, showed them

side-by-side to researchers who work in that area, and asked them to say which is more relevant to their

research, would they reliably pick the paper with more citations?

 22
Close to 2,000 authors from two large universities performed precisely this exercise. However, the

results were not straightforward [58]. The scholar’s selection typically depended on whether or not he was

asked to judge his own work. If both papers offered had been authored by the researcher, he systematically

picked his better cited paper as the more relevant one. If, however, the author was asked to compare his

paper with a paper by someone else, he overwhelmingly preferred his own paper—even if the other option

was one of the most cited papers in their field, and even if the difference in impact amounts to several orders

of magnitude.

 These results suggest that, just as someone else’s baby—no matter how adorable—can never compare

to your own, scientists have a blind spot when asked to compare their work to that of others, which can

skew their perception of even the most pivotal work.

 Taken together, these surveys seem to tell two conflicting stories. On one end, scientists are not

immune to biases, especially when it comes to their own work. But at the same time, citations could be a

meaningful measure, since they largely align with the perceptions of experts. This suggests that, despite

their shortcomings, citations likely play a critical role in gauging scientific impact.

 But there is another, more fundamental reason why citations matter: There is not one scientist in the

world who can single-handedly demand that a paper amass citations [59]. Each of us decides on our own

whose shoulders to stand upon, citing the papers that inspired our work, and those which were key to

developing our ideas. When all of those individual decisions are combined, what emerges is the collective

wisdom of the scientific community on a paper’s importance. It is not enough for one scientist to decide

that a paper is great. Others in the community must also agree, with each additional citation acting as an

independent endorsement. In other words, scientific impact is not about what you think; it’s about what
everyone else thinks.

Box 3.2.4 Patent Citations

Citations can also help quantify the importance of inventions. When a patent is issued by the patent office, it includes

citations to prior patents, as well as to the academic literature. Patent citations can be added by inventors, their

attorneys or by patent examiners. Just like in science, patents with the most citations tend to describe important

inventions [60, 61]. But patent citations go a step further, conveying not just an invention’s importance, but also its

 23
economic impact. For example, studies have found that more highly-cited medical diagnostic imaging patents produce

machines that attract more demand [62] and that companies with highly-cited patents have higher stock market values

[63]. More importantly, the link between the commercial value of a patent and its citations is positive and highly

nonlinear. One survey polled patent owners 20 years after their invention, asking them how much they should have

asked for their patent knowing what they know today. The responses revealed a dramatic, exponential relationship

between the economic value of a patent and its citations [64]: A patent with 14 citations, for example, had 100 times

the value of a patent with 8 citations.

 24
Chapter 3.3

High Impact Papers

 Why are most papers rarely cited, and how do a few lucky ones turn into runaway successes? These

questions present a deep puzzle. In every new paper, the authors carefully select which work to cite, based

on the topic of the manuscript and their own familiarity with the literature. Yet somehow these many

personal decisions result in a highly stable citation distribution, capturing impact disparities that transcend

disciplines. How do citation superstars emerge? What determines which papers are highly cited, and which

are forgotten? And why are these universal citation distributions universal, independent of the discipline?

 In this chapter we show that, perhaps somewhat counterintuitively, citation superstars and the

universality of the citation distribution emerge precisely because citations are driven by individual

preferences and decisions. Although our individual choices differ widely, the behavior of the scientific

community as a whole follows highly reproducible patterns. As such, despite the seemingly countless

factors that govern each paper’s impact, the emergence of exceptionally impactful papers can be explained

by a handful of simple mechanisms.

3.3.1 The ‘Rich-Get-Richer’ Phenomenon

 No scientist can read the million or so scientific papers published each year. So we typically discover

papers of interest while reading other papers, and looking at the work they cite. This leads to a curious bias:

the more widely cited a paper already happens to be, the more likely it is that we will encounter it through

our reading. And since we typically only cite work that we read, our reference lists frequently becomes

 25
populated with highly cited papers. This is an example of a “rich-get-richer” phenomenon—similar to the

Matthew effect encountered in Chapter 1.3—the higher a paper’s citation count, the more likely it is to be

cited again in the future.

 As simple as it seems, the rich-get-richer mechanism alone can explain much of the citation disparity

among scientific publications, and for the universal, field-independent nature of citation distributions. This

was formalized in a model first proposed by de Solla Price in 1976 (Box 3.3.1), sometimes called the Price

model [65, 66], which incorporates two key aspects of citations:

 1. The growth of the scientific literature. New papers are continuously published, each of which cite

 a certain number of previous papers.

 2. Preferential attachment. The probability that an author chooses a particular paper to cite is not

 uniform, but proportional to how many citations the paper already has.

 As discussed in more detail in Appendix A2.1, the model with these two ingredients (growth and

preferential attachment) predicts that citations follow a power-law distribution, hence can explain the

empirically observed fat-tailed nature of citations.

Box 1.3.1. The rich-get-richer effect has been independently discovered in multiple disciplines over the last

century, helping to explain disparities in city and firm sizes, abundance of species, income, word

frequencies, and more [65, 67-73]. The best-known version was introduced in the context of complex

networks [30, 74], where the term preferential attachment was proposed by the Barabasi-Albert model [73]

to explain the existence of hubs in real networks. In sociology, it is often called “the Matthew effect,” as

discussed in Chapter 1.3 and also called cumulative advantage by de Solla Price [65].

 This analysis leads us to a critical takeaway. Clearly there are myriad factors that contribute to the

impact of a paper, some of which will be considered in later chapters. But the accuracy with which Price’s

model captures the empirically observed citation distribution demonstrates that these additional factors don’t

matter if our only goal is to explain the origin of the fat-tailed distribution of citations. Growth and

preferential attachment, together leading to a rich-get-richer effect, can fully account for the observed

citation disparity, pinpointing the reason why citation superstars emerge (see Appendix A2.2 for the origins

of preferential attachment). It also explains why citation distributions are so universal across widely

 26
different disciplines: While many factors may differ from one discipline to the other, as long as the same

preferential attachment is present, it will generate a similar citation distribution, independent of any

disciplinary peculiarities.

3.3.2 First-Mover Advantage

 Price’s model has another important takeaway: The older a paper is, the more citations it should

acquire. This phenomenon is called the first-mover advantage in the business literature. That is, the first

papers to appear in a field have a better chance of accumulating citations than papers published later. Then,

thanks to preferential attachment, these early papers will retain their advantage in perpetuity.

 This prediction was put to the test by analyzing citations patterns of papers published in several

subfields, like network science and adult neural stem cells [75], finding a clear first-mover effect, whose

magnitude and duration are quite similar to that predicted by Price’s model. To appreciate the size of this

effect, let’s look at the field of network science, born at the end of the 1990s. The first 10% of papers

published in this field received an average 101 citations, while the second 10% received just 26 on average.

Since the second batch was published immediately after the first, the difference is likely not due to the fact

that the second batch had less time to collect citations.

 Scientists tend to treat the first papers as founders of a field, which may explain their high citation

count. The first researcher to bring a problem to the attention of the scientific community deserves credit

for it, regardless of whether all of the original results retain their relevance.

 Occasionally, however, prominent latecomers do take over. Consider, for example, the Bardeen-

Cooper-Schrieffer (BCS) paper [76], which introduced the first widely accepted theory of superconductivity.

It was a relatively late contribution to the field of superconductivity. Yet by explaining a wide range of puzzles

plaguing the field with a single elegant theory, it quickly became the defining paper, and the citations followed.

Hence, the BCS paper is a living testament to the fact that the first-mover principle is not absolute, prompting

us to ask: If only the rich are allowed to get richer, how can a latecomer succeed?

 To answer this question, we must recognize that preferential attachment is not the only mechanism driving

citation counts. As we will see next, there are other mechanisms that determine which papers loom large in the

scientific canon, and which fade into obscurity.

 27
3.3.3 The Fit Get Richer

 Despite its simplicity, Price’s model omits a crucial factor that does influence the accumulation of
citations: not all papers make equally important contributions to the literature. Indeed, there are huge
differences in the perceived novelty, importance, and quality of papers. For example, some papers report
highly surprising discoveries that alter the prevailing paradigm, and others, like the BCS paper, bring
clarity to long-standing puzzles in a large and active field—but these papers coexist with other
publications that merely rehash old ideas or proffer half-baked theories. Papers also differ in their
publication venues, the size of the audience they speak to, and the nature of their contribution (i.e., review
papers and method papers tend to be cited more than regular research papers). In other words, papers differ
in their inherent ability to acquire citations, each being characterized by some set of intrinsic properties
that will determine its impact relative to the pack. We will call this set of properties fitness, a concept
borrowed from ecology and network science [77].
 Price’s model assumes that the growth rate of a paper’s citations is determined solely by its current
number of citations. To build upon this basic model, let’s assume that citation rate is driven by both
preferential attachment and a paper’s fitness. This is called the fitness model [77, 78], or the Bianconi-
Barabási model, which incorporats the following two ingredients (See Appendix A2.3 for more detail).

 • Growth: In each time step, a new paper i with a certain number of references and fitness ƞi is
 published, where ƞi is a random number chosen from a distribution p(ƞ). Once assigned, the
 paper’s fitness does not change over time.

 • Preferential Attachment: The probability that the new paper cites an existing paper is
 proportional to the product of paper i’s previous citations and its fitness ƞi.
Here a paper’s citation is not just dependent on its existing citations, captured by the preferential

attachment mechanism we have discussed earlier. It also depends on its fitness, indicating that between

two papers with the same number of citations, the one with higher fitness will attract citations at a higher

rate. Hence, the presence of fitness assures that even a relatively new paper, with a few citations initially,

can acquire citations rapidly if it has greater fitness than other papers.

Box 1.3.2: The origin of the lognormal citation distribution. As we discussed in Ch. 3.2, several recent studies have

indicated that citation distributions sometimes are better-fitted by lognormal distributions. While a lognormal form is

inconsistent with the Price’s model (which predicts a power law), it can be explained by the fitness model [77]. Indeed,

 28
You can also read