The Logistics Report Summary 2021 - Produced by Logistics UK Policy
←
→
Page content transcription
If your browser does not render page correctly, please read the page content below

The Logistics Report Summary 2021
Produced by Logistics UK Policy
We support, shape and stand-up for efficient logistics

Logistics UK is one of the biggest business groups in the UK, supporting,
shaping and standing up for efficient logistics. We are the only
organisation in the UK that represents all of logistics, with members
from the road, rail, sea and air industries, as well as the buyers of freight
services such as retailers and manufacturers whose businesses depend on
the efficient movement of goods.

An effective supply chain is vital to Keep Britain Trading, directly
impacting over seven million people employed in making, selling and
moving the goods that affect everyone everywhere.

With Brexit, technology and other disruptive forces driving changes in the
way goods move across borders and through the supply chain, logistics
has never been more important to UK plc.

As champions and challengers, Logistics UK speaks to Government with
one voice on behalf of the whole sector, greatly increasing the impact of
our messages and achieving amazing results for members.

Cover image: www.istockphoto.com

All rights in this documentation, including (but not limited to) copyright, trade marks, logos, designs, concepts,
ideas, methodologies, confidential information or other intellectual property or proprietary rights (‘IPR’), is
owned by Logistics UK or used under licence from third party owners. Any use of this documentation or its
contents, including copying or storing it or them in whole or in part, other than for your internal business
purposes, is prohibited without the written permission of Logistics UK. You are prohibited from copying,
modifying, transmitting, distributing, selling, displaying, licensing or reproducing any content including images
and other media in this documentation for any commercial purpose of your own. In addition, you will treat the
confidential information in this document as confidential and will require those in your organisation to do the
same, and will not disclose or not reproduce any confidential information contained within this documentation
in any form, including electronic readable or hard copy form, except with Logistics UK’s prior written consent.
Logistics UK does not provide any guarantee or warranty in respect of information or IPRs belonging to other
third parties.

Foreword
                                       Welcome to the Logistics Report 2021. For over 10 years we have produced this report
                                       to provide an annual view of the performance of the logistics sector and the principal
                                       challenges it faces.

                                       Never have we had to reflect on such an extraordinary year as the last one. But in the face
                                       of the pandemic our industry is transforming, growing and demonstrating exceptional
                                       resilience. We are now also seeing welcome evidence of recovery in the wider economy
                                       and in our society, as the successful vaccine programme proceeds at pace.

                                       As in previous years, the Logistics Report contains information on our industry from
                                       respected official and commercial sources. But vitally it also contains the findings of
                                       Logistics UK’s annual Logistics Industry Survey, along with other member research we
                                       have conducted; our members’ support for our surveys adds immeasurably to the richness
                                       of the report.
David Wells
Chief Executive                        The Logistics Report provides expert insights on our industry and raises awareness of
Logistics UK                           the issues that matter most to our members and the sector we represent. Before the
                                       pandemic, the sector was already operating in a changing context: driver shortages; new
                                       rules because of the exit from the EU; and adapting freight to deliver a cleaner, greener
                                       future. COVID-19 has not meant these factors have gone away, but it has accelerated them
                                       and made responding to them more complex.

                                       As we recover from the effects of the pandemic, investment in the future of logistics
                                       – including rail freight, which will be vital in cutting the UK’s carbon emissions in line
                                       with its targets – will be essential. Investment in automation and connectivity is also
                                       an opportunity for the future. We are urging Government and those involved in the
                                       development of Connected and Autonomous Mobility to focus on applications that will
                                       build the most robust business cases for industry. If businesses are operating on margins
                                       of less than 2%, investment cannot be wasted.

                                       The performance of our economy is dependent on sufficient and efficient logistics.
                                       But this is not possible without skilled staff. Driver vacancies and the shortage of skills
                                       to support the wider industry are the biggest challenge we currently face, and we are
                                       engaging with Government and industry on the urgent action needed to address this.

                                       The Logistics Report is also celebration of the industry, its size, its scale, its determination
                                       to innovate and adapt for the future, even in these testing times. It showcases the industry
                                       as one to invest in, make a career in and work with.

The Logistics Report 2021 sets out how logistics is performing on key measures and the events and trends currently shaping it. It also
contains the findings of the annual Logistics UK Industry Survey 2020/21, which gathers views from 500 businesses engaged in logistics,
spanning over 15 sectors, in the UK and globally. In addition to the survey, the report draws from an array of respected sources, bespoke
analysis commissioned by Logistics UK and insights from our policy experts.

The following is a brief summary of the seven sections that make up the full report. To obtain a copy of the full Logistics Report 2021, please
contact customerservices@logistics.org.uk.
Logistics Business Index
Business expectations Logistics Business Index*
Compared to a year ago, have you experienced
This is an ongoing measure of respondents’ sentiment improvements or a deterioration in the following:
about their business’s performance in the next six months.
Before COVID-19 and the end of the Brexit transition
period on 1 January 2021, business confidence and 50
business investment in the logistics sector was positive but Overall business 43.5
had fallen relative to a year ago. The economic impact of confidence 51.6
the coronavirus pandemic has affected revenue and profit,
while clarity on future trading arrangements with the EU Investment in 48.3
has deteriorated in the past year. Fuel price pressures have the business 55.2
eased, as has recruitment, but overall there is a decline.
54.4
Competitiveness
61.7
38.5
Revenue
Logistics activity
55.0
37.6
Logistics activity was derived from a set of modal activity Profit
49.5
confidence indices which are described in detail in of the
main report. The index comprises sentiment indices across 72.4
New technology use
all modes and includes an indirect measure of warehousing 77.2
through road activity and usage. The Logistics Activity
56.4
Index was derived by weighting the individual indices by New/alternative fuels
proportion of their contribution to Gross Value Added 57.8
(GVA). Decarbonisation 58.0
progress N/A
In 2020 there was a deterioration in logistics activity
with air freight showing the largest fall in confidence. It is 47.9
Fuel prices
expected that in 2021 there will be large positive swing in 26.9
logistics activity driven improvements in the road sector.
The Logistics Business Index also indicates an uplift in Recruitment of 35.9
business confidence in 2021 compared with 2020. skilled staff 31.3
41.4
Filled vacancies
38.2
Clarity on future
31.0
trading arrangements
with the EU† 29.4†
January 2021 January 2020
*50 = Improvement
†
was “Legal/political uncertainties/Brexit”
Source: Logistics UK Industry Survey 2020/21
4 THE LOGISTICS REPORT SUMMARY 2021 © LOGISTICS UKThe logistics sector
Key facts warehousing distribution premises expected to reduce in
1 The logistics sector contributes £127 billion 2021. However, progress with vaccinations and clarity over
Gross Value Added (GVA)1 to UK economy. Brexit is expected to have a positive impact on businesses.
2 There are 205,380 logistics enterprises in the UK.
3 Online retail averaged 28.1% of retail sales Expectations/things to watch for
in 2020, up from 19.2% in 2019. 1 Adaptations of business due to new social
distancing measures and an increase in
Summary home working and online shopping.
The UK logistics sector is vital for the country’s financial 2 Large-scale business investment intentions
success, contributing 10% to the UK non-financial business for 2021 indicate an increase in purchases of
economy. Despite the pressures brought on by the COVID-19 additional warehousing distribution premises.
pandemic, the industry has adapted well, and the proportion 3 Potential liquidations and insolvencies as Government
of businesses in the transport and storage sector with cash support measures are wound up.
reserves of more than six months rose after April 2020 before
stabilising. Fleet investment intentions, the number of goods
vehicle operator licences and new HGV and van registrations 1 Approximate Gross Value Added at basic prices (aGVA) is the amount individual
businesses, industries or sectors contribute to the economy.
declined during 2020, with the leasing of additional
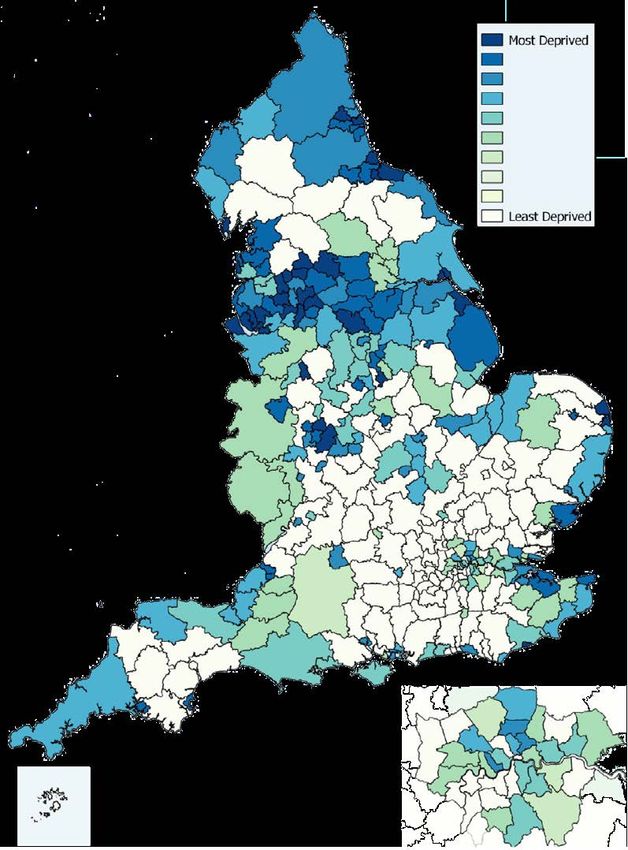
Proportion of logistics employees, number of enterprises by deprivation index
Employment in logistics is spread unevenly across the UK. There is some correlation between the number of logistics
businesses and lower levels of deprivation, indicating the role freight operations play in providing employment and
generating growth for a region.
Scotland
Proportion of
7%
9,705 logistics employees Note: there are 123 Districts with
no Lower-layer Super Output
Number of enterprises Areas in the most deprived 10%
of areas. These areas score zero
on this summary measure and are
shown in the least deprived decile.
North East
3%
4,425
Northern Ireland
2% Yorkshire and
5,495 the Humber
9%
18,745
East Midlands
10%
North West
19,070
13%
22,795
East of
West Midlands England
12% 9%
23,470 22,540
Wales London
4% 9%
7,070 31,240
South East
South West 13%
8% 26,605
14,220
Sources: UK Business: Activity, Size and Location, ONS, 2020;
Labour Force Survey, Q2 2020, ONS;
The English Indices of Deprivation 2019 – Statistical Release,
Ministry of Housing, Communities and Local Government
THE LOGISTICS REPORT SUMMARY 2021 © LOGISTICS UK 5Competitiveness
Key facts fuel prices potentially offset some of these rises. The UK’s
1 A global shortage of shipping containers contributed future competitiveness is likely to depend on its ability
to a rise of 185% in rates by the end of 2020. to adapt to a new regulatory regime post Brexit and the
2 Brent crude prices reached a 21-year extent to which it deploys emerging policy and regulatory
low of $17/bbl in spring 2020. reforms in the wake of the pandemic.
3 2020 levels of warehouse take up reached a new record.
Expectations/things to watch for
Summary 1 Freight rates expected to increase
The UK ranked in the top 10 or 15 countries for every dramatically across all modes in 2021.
metric in the World Economic Forum’s 2020 Global 2 Increased demand for incentivising
Competitiveness Report. Costs increased for all modes, alternative fuels and carbon reduction.
possibly due to pandemic restrictions, reduction in the 3 New freeports and a tax cut likely to boost
availability of services (such as flights) and the price of productivity-gaining enterprises.
implementing COVID-19 measures, though the drop in
Barriers to business recovery
Barriers to business recovery as the coronavirus restrictions lift were explored in Logistics UK’s February 2021 Logistics
Performance Tracker. ‘Social distancing’ (78%), ‘customers no longer trading’ (73%) and ‘new trading relationship with the
EU’ (68%) were cited by respondents as the most prevalent barriers.
Social distancing
22.1% 43.6% 28.2% 6.1%
Cash flow
60.7% 20.0% 14.0% 5.3%
Customers no longer trading
27.3% 36.0% 22.0% 14.7%
MOT availability
41.3% 35.0% 16.1% 7.7%
Recruitment of drivers
42.7% 28.0% 19.6% 9.8%
Access to Driver CPC training
45.5% 27.6% 22.1% 4.8%
Relicensing vehicles for use 1.6%
77.0% 13.9% 7.4%
Lack of demand for business/lack of work
40.0% 32.0% 16.0% 12.0%
Extended payment terms from suppliers/delayed payments
48.9% 28.1% 14.4% 8.6%
New trading relationship with the EU
32.1% 37.5% 18.8% 11.6%
Not a barrier Somewhat of a barrier Moderate barrier Extreme barrier
Source: Logistics UK, February 2021
6 THE LOGISTICS REPORT SUMMARY 2021 © LOGISTICS UKInternational trade
Key facts partners, and the top 10 exports from the UK to the EU had
1 UK remains a net importer with a negative trade an estimated value of £78 billion. Adapting to changes in
balance that narrowed by £11.3 billion in 2020. moving or trading goods after the EU Exit transition period
2 In 2019, 95% of international freight tonnage and introduction of the NI Protocol proved to be difficult at
arriving in the UK was moved by sea. the beginning of 2021.
3 USA and China remain UK’s largest
non-EU trading partners. Expectations/things to watch for
1 New trade agreements with EU partners.
Summary 2 OECD doubled its predictions for UK growth in
UK’s imports and exports were disrupted by the 2021, citing the USA’s new economic stimulus
coronavirus pandemic, as well as the uncertainty around package as an important factor in this increase.
the end of the EU Exit transition period. £301.7 billion of 3 Imports and exports are expected to increase in 2021.
goods were imported from the UK’s top 10 import trading
UK trade UK trade by direction and international mode of transport
The UK remains a net importer, with a negative trade (2019)
balance that narrowed by £11.3 billion in 2020; the
majority (£10.9 billion) came in the final quarter of the
year. This is likely to have been caused by stockpiling in the
lead up to the end of the EU Exit transition period.
At the beginning of 2021, the Office for National Statistics
(ONS) made it clear that, due to disruption from COVID-19
mt = million tonnes
and the EU Exit, caution should be taken when looking at
short-term comparisons of trade data. January 2021 saw
a record (since 1997) fall in exports and imports compared
to the year before. The ONS established that data is hard
to compare month on month due to the combination of
border delays, COVID-19-related trade pressures and
global supply chain disruption, as well as the end of the
transition period. Trade data also indicates evidence of
stockpiling in the final quarter, in the lead up to the new
trading arrangement with the EU. This is comparable to
previous Brexit deadlines in March and October 2019.
95% 255.8mt 127.4mt 91%
4% 11.6mt 10.9mt 8%
1% 1.3mt 1.2mt 1%
ARRIVING LEAVING
Source: Transport Statistics Great Britain 2020, ONS, 17 December 2020
THE LOGISTICS REPORT SUMMARY 2021 © LOGISTICS UK 7Connectivity
Key facts rail reliability increased, though demand for air freight
1 HGVs moved 1.3% more goods in 2019 than 2018, plummeted. Global maritime trade is estimated to have
with the amount of goods lifted increasing by 2.4%. fallen by 4.1% in 2020 due to supply chain disruption
2 In air freight, overall volumes of global cargo caused by COVID-19.
tonne-kilometres (CTKs) fell by 10.6% year-on-
year, the largest decline since since 1990. Expectations/things to watch for
3 486.1 million tonnes of freight were handled by 1 Growth of world seaborne trade is expected
UK ports in 2019, up 1% on the previous year. to expand by 4.8% in 2021, assuming the
world economic output recovers.
Summary 2 Air cargo volumes to improve as passenger
Freight operations have been affected by lockdown flights resume, following pandemic restrictions,
restrictions, though efficient adaptations led to road, providing more bellyhold space.
rail and cargo-flight-specific air freight recovering to 3 Reliability of road freight could decrease if traffic
pre-pandemic levels by the end of 2020. Road and volumes return to pre-lockdown levels.
Seaborne trade
The performance of the global economy impacts on the
success of world seaborne trade. According to a report by
the United Nations Conference on Trade and Development
(UNCTAD), global maritime trade is estimated to have
fallen by 4.1% in 2020 due to supply chain disruption
caused by COVID-19. The report published in November
2020 warned that new waves of the pandemic might
cause an even steeper decline. The short-term outlook
for maritime trade is downbeat and the pandemic’s
longer-term impact, as well as the timing and scale of
the industry’s recovery, is uncertain. However, growth
is expected to expand by 4.8% in 2021, assuming world
economic output recovers.
Freight handled by UK major ports (million tonnes) in
2019
-3.7%
Other cargo
Roll-on/roll-off 17.2mt
105.0mt
-2.4%
475.4mt
4.6%
(major ports)
-2.1% Liquid bulk
192.7mt
Lift-on/lift-off
67.0mt -0.5%
Dry bulk
mt = million tonnes 93.5mt
Source: UK Port Freight Statistics 2019, DfT, August 2020
8 THE LOGISTICS REPORT SUMMARY 2021 © LOGISTICS UKLabour and skills
Key facts status and increased demand for online delivery services
1 At the start of coronavirus restrictions, around meant many businesses were able to continue, with 46% of
a quarter of logistics staff were furloughed. respondents to the Logistics UK Industry Survey 2020/21
2 Average pay across all sectors increased by indicating they had increased staff gross pay. The sector is
4.7%, affected upwards by a fall in the number under continued pressure to meet staffing needs.
and proportion of lower-paid jobs.
3 The number of HGV drivers in employment Expectations/things to watch for
fell by around 21,000 in Q2 2020. 1 Respondents to the Logistics UK Industry
Survey 2020/21 indicated that increasing
Summary the number of staff and training were the
There are currently 1.7 million jobs in the specific logistics highest HR priorities for the year ahead.
sector. COVID-19 drastically affected working practices 2 Increased demand for fitter, mechanic and technician
over the past year, with furloughing and redunancies roles, as these were the hardest to fill in 2020.
affecting every sector. However, the industry’s ‘key worker’ 3 Increase in staff gross pay.
Total tests
There is an ongoing, historical problem in the sector with
filling driver vacancies. In order to drive a HGV, drivers
must pass a vocational driving test. HGV drivers employed
or used in commercial capacity also need to acquire
and then maintain a Driver CPC; however, with testing
suspended for a year, supply of licensed drivers has fallen
even further behind demand. Comparing calendar years,
the average pass rate has remained fairly consistent,
averaging at 57.7% from 2015-2019. It is only higher in
2020 because of the very high average pass rate from
April to June, averaging 79.4% and skewing the overall
average higher, when testing rates collapsed.
Compared to 2019, there were 43% less tests conducted
in 2020. 35% of these were conducted in the first quarter
(January to March), when more than 15,000 tests were
carried out, prior to the pandemic. However, during the
first lockdown period of April through June, only 631 tests
took place. By comparison, in 2019, 18,625 tests were
conducted over a similar period. Testing structures were
reinstated from April, but there is now a significant backlog
of drivers seeking tests which will take time to clear,
causing further delays.
Pass rate
Conducted Passes
(%)
2016 77623 43643 56.22
2017 72446 41867 57.82
2018 72787 42192 57.97
2019 73554 43282 58.82
2020 42200 24626 63.73
Driver Testing Statistics, UK Government, April 2020
THE LOGISTICS REPORT SUMMARY 2021 © LOGISTICS UK 9Sustainability
Key facts growth of online retail had a positive effect on warehouse
1 First Clean Air Zones and other local emission- take-up and home deliveries, while COVID-19 restrictions
reduction schemes being implemented in 2021. improved traffic levels for freight as the majority of private
2 Phase out of new petrol and diesel vehicles stayed off the road.
vehicles given date of 2035.
3 Nationally, drivers saved more than £3.4 billion in time Expectations/things to watch for
savings compared to 2019 due to improved traffic levels. 1 Continuing increase in online shopping which will drive
warehouse take-up and home delivery services.
Summary 2 More zero-emission vehicles developed and introduced
Despite plans facing disruptions due to the coronavirus as local and national schemes restrict access for
pandemic, logistics’ journey to net zero is picking up vehicles that do not meet emission requirements.
again with the introduction of low-emission schemes and 3 Additional Clean Air Zones and Low or
an increase in sustainable technology development. The Zero Emission Zones developed.
Traffic levels during COVID-19
Road congestion was positively impacted by COVID-19 restrictions, through a reduction in traffic density, due mainly to the
fall in car traffic after the first COVID-19 lockdown on 23 March 2020; car traffic was on average 30% lower than pre-23
March lockdown levels to the end of 2020, while vans and HGVs were 17% and 7% lower, respectively.
% of normal levels
140% 1st lockdown 2nd lockdown 3rd lockdown
120%
100%
80%
60%
40% Bank holiday
Bank holiday
20% VE day
Easter
0% Christmas and New Year
1 Oct 2020
1 Mar 2020
1 Apr 2020
1 May 2020
1 Jun 2020
1 Jul 2020
1 Aug 2020
1 Sep 2020
1 Nov 2020
1 Dec 2020
1 Jan 2021
1 Feb 2021
Cars Vans HGVs
Source: Transport use by modes: Great Britain, since 1 March 2020, DfT, 15 February 2021
10 THE LOGISTICS REPORT SUMMARY 2021 © LOGISTICS UKSafety and innovation
Key facts vehicle decreased. As the sector recovers from the
1 Goods vehicle operator licences fell by 2.5% pandemic, technology developments are expected to drive
in 2019/20 compared to 2018/19. a rise in automation and sustainability benefits across
2 Number of HGV fatal accidents per billion vehicle all modes.
miles was 22% lower compared to a decade ago.
3 Government spent around £10.5 Expectations/things to watch
billion on Britain’s roads. 1 Volumes of vocational driving tests to increase,
to make up the backlog created during
Summary lockdowns when testing was suspended.
Both vehicle and driver testing has been impacted by 2 Use of automated and connected technology
lockdown restrictions over the last year, though data expected to grow across all four modes.
suggests industry compliance may have improved overall 3 Slow recovery of air freight, especially as
and the number of fatal accidents involving a commercial plans for airport expansions are delayed.
Number of accidents and casualties and
accidents involving HGVs
The number of HGV fatal accidents per billion vehicle
miles was 22% lower compared to a decade ago and 9%
lower in 2019 compared with 2018. The number of van
fatal accidents per billion vehicle miles was 16% lower in
2019 compared to 2010 but up 10% compared to 2018.
With growing traffic volumes, the interaction between
commercial vehicles and other road users, particularly
cyclists in urban areas, presents a considerable challenge
to the road freight logistics sector. 2019 saw a drop across
the board in the number of HGVs involved in accidents
with vulnerable road users. The number of cyclist fatalities
remained the same in 2019 as the year before, but the
number of HGVs involved fell by over a third.
12,000
Number of accidents
11,000
Number of casualties
10,000
9,000
8,000
7,000
6,000
5,000
4,000
2008 2018
Source: Reported Road Casualties in Great Britain: 2019 annual report,
DfT, September 2020
THE LOGISTICS REPORT SUMMARY 2021 © LOGISTICS UK 11T: 01892 526171* F: 01892 534989 www.logistics.org.uk Logistics UK is a trading name of Freight Transport Association Limited *Calls may be recorded for training purposes Registered office: Hermes House, St John’s Road, Tunbridge Wells, Kent TN4 9UZ Correct at time of going to press but subject to change. Registered in England Number 391957 ©Logistics UK. All rights reserved. 05.21/SW
You can also read