The genetic and biochemical determinants of mRNA degradation rates in mammals - bioRxiv
←
→
Page content transcription
If your browser does not render page correctly, please read the page content below
bioRxiv preprint doi: https://doi.org/10.1101/2022.03.18.484474; this version posted March 19, 2022. The copyright holder for this preprint
(which was not certified by peer review) is the author/funder, who has granted bioRxiv a license to display the preprint in perpetuity. It is made
 available under aCC-BY-NC-ND 4.0 International license.

 The genetic and biochemical determinants of mRNA
 degradation rates in mammals

 Vikram Agarwal 1,♱, David Kelley1,♱

 1
 Calico Life Sciences LLC, South San Francisco, CA 94080, USA

 ♱
 Correspondence to Vikram Agarwal (vagar@calicolabs.com) and David Kelley (drk@calicolabs.com)

 1

bioRxiv preprint doi: https://doi.org/10.1101/2022.03.18.484474; this version posted March 19, 2022. The copyright holder for this preprint
(which was not certified by peer review) is the author/funder, who has granted bioRxiv a license to display the preprint in perpetuity. It is made
 available under aCC-BY-NC-ND 4.0 International license.

 ABSTRACT

 Background: Degradation rate is a fundamental aspect of mRNA metabolism, and the factors

 governing it remain poorly characterized. Understanding the genetic and biochemical

 determinants of mRNA half-life would enable a more precise identification of variants that

 perturb gene expression through post-transcriptional gene regulatory mechanisms.

 Results: Here, we establish a compendium of 54 human and 27 mouse transcriptome-wide

 mRNA decay rate datasets. A meta-analysis of these data identified a prevalence of technical

 noise and measurement bias, induced partially by the underlying experimental strategy.

 Correcting for these biases allowed us to derive more precise, consensus measurements of

 half-life which exhibit enhanced consistency between species. We trained substantially improved

 statistical models based upon genetic and biochemical features to better predict half-life and

 characterize the factors molding it. Our state-of-the-art model, Saluki, is a hybrid convolutional

 and recurrent deep neural network which relies only upon an mRNA sequence annotated with

 coding frame and splice sites to predict half-life (r=0.77). Saluki predicts the impact of RNA

 sequences and genetic mutations therein on mRNA stability, in agreement with functional

 measurements derived from massively parallel reporter assays.

 Conclusions: Our work produces a more robust “ground truth” with regards to

 transcriptome-wide mRNA half-lives in mammalian cells. Using these consolidated

 measurements, we trained a model that is over 50% more accurate in predicting half-life from

 sequence than existing models. Our best model, Saluki, succinctly captures many of the known

 determinants of mRNA half-life and can be rapidly deployed to predict the functional

 consequences of arbitrary mutations in the transcriptome.

 2
bioRxiv preprint doi: https://doi.org/10.1101/2022.03.18.484474; this version posted March 19, 2022. The copyright holder for this preprint
(which was not certified by peer review) is the author/funder, who has granted bioRxiv a license to display the preprint in perpetuity. It is made
 available under aCC-BY-NC-ND 4.0 International license.

 KEYWORDS

 mRNA stability, mRNA half-life, deep neural networks, post-transcriptional gene regulation

 INTRODUCTION

 The steady-state level of RNA is governed by two opposing forces: the rate of transcription and

 the rate of decay. While much headway has been made in the problem of predicting steady-state

 mRNA abundances through the lens of DNA-encoded features that influence transcription rates

 [1–5], relatively less is known about the RNA-encoded determinants that govern decay rates.

 Models to predict half-life from RNA sequence in mammals (achieving r2=0.20 and r2=0.39)

 [6,7] have severely lagged behind the performance of those in yeast (achieving r2=0.59) [8].

 Integrating the modeling of transcription and RNA decay into a unified model to predict

 steady-state mRNA levels [2] from genetic sequences would elucidate the full spectrum of

 regulatory functions of non-coding DNA. Consequently, this would advance the goals of

 providing a mechanistic explanation for evolutionary constraint in conserved sequences [9–11],

 identifying causal eQTLs [12,13], diagnosing pathogenic non-coding genetic variants [14], and

 designing more stable and effective mRNA therapeutics [15].

 The rate of mRNA decay is experimentally measured as its half-life, or the time elapsed until the

 initial RNA concentration has decreased by half. Experimental measurement of

 transcriptome-wide half-life can be achieved by one of two strategies: i) the application of

 transcriptional inhibitors [e.g., Actinomycin D (ActD) and α-Amanitin] to cells, or ii) a

 pulse-chase based method of pulsing modified nucleosides (e.g., 4sU, 5EU, and BrU) followed

 by chasing with unmodified nucleosides to distinguish newly synthesized RNA from pre-existing

 3

bioRxiv preprint doi: https://doi.org/10.1101/2022.03.18.484474; this version posted March 19, 2022. The copyright holder for this preprint
(which was not certified by peer review) is the author/funder, who has granted bioRxiv a license to display the preprint in perpetuity. It is made
 available under aCC-BY-NC-ND 4.0 International license.

 RNA [16]. Both strategies are followed by the profiling of RNA levels over a time course, and

 data for each gene are fit to an exponential decay curve to ascertain the gene’s half-life. Although

 it has long been appreciated that different methods induce measurement bias [16–18], many

 modern studies that deploy these methodologies fail to acknowledge the prevalence and impact

 of these biases on result interpretation.

 Measurement biases emerge for a multitude of reasons. Transcriptional inhibitors are convenient,

 but do not necessarily enter all cells to fully block transcription [16]. Moreover, such drugs can

 lead to cytotoxicity [17] or impact unintended pathways such as translation, thus preventing the

 attachment of mRNA to ribosomes and resulting in artificially altered mRNA metabolism

 [16,18]. Pulse-chase methods are inaccurate in the scenario in which the half-life is shorter than

 the chase period, and cellular parameters such as doubling time and drug uptake further bias

 half-life measurement [18]. Finally, the incorporation of uridine analogs is thought to be a

 stochastic process that is proportional to the number of Us in an RNA, leading to

 RNA-length-dependent labeling and enrichment biases [19,20]. Collectively, the ultimate

 consequence of these biases is the disagreement between different methods in the physiologically

 relevant estimate of half-life [16].

 It has been postulated that considering an ensemble of different methods would empower a more

 precise measurement of half-life, providing a path towards circumventing the tradeoffs and

 limitations among any individual method [18]. While a meta-analysis of half-life datasets in

 yeast revealed surprisingly discordant results among half-lives measured by different research

 groups [21], the consistency among half-life datasets in mammalian organisms remains largely

 4
bioRxiv preprint doi: https://doi.org/10.1101/2022.03.18.484474; this version posted March 19, 2022. The copyright holder for this preprint
(which was not certified by peer review) is the author/funder, who has granted bioRxiv a license to display the preprint in perpetuity. It is made
 available under aCC-BY-NC-ND 4.0 International license.

 uncharacterized. Collecting such a compendium of datasets would potentially enable the

 derivation of consensus measurements of cellular mRNA half-life in a fashion that is less

 obfuscated by technical noise and methodological bias.

 A precise measurement of RNA half-life would enable a clear-eyed examination of how different

 molecular pathways modulate half-life relative to one another. Numerous RNA-binding proteins

 (RBPs) and sequence-encoded features have been implicated in regulating half-life. Examples

 include: i) generic features of an mRNA such as its GC content [22], length, and ORF exon

 junction density [6,7]; ii) the presence of microRNA (miRNA) binding sites [23–25]; iii) codon

 frequencies and interactions with the translation machinery [8,26–30]; iv) mRNA structure

 [31,32]; v) Pumilio binding elements [33]; vi) AU-rich elements (AREs) [16,34]; and vii)

 YTHDF proteins [35] via m6A recognition [36,37].

 Attempts to examine the relative contribution of sequence and biochemical features to the

 specification of half-life [6–8,38–40] have been undermined by half-life measurement biases,

 and have not exhaustively considered all of the known pathways that affect RNA stability. In this

 study, we assembled a compendium of 54 human and 27 mouse mRNA half-life datasets to

 derive more precise, consensus measurements of RNA stability in mammalian cells. Using our

 enhanced measurements, we derived improved genetic and biochemical models towards the

 goals of quantifying the relative influence of different pathways and improving the predictability

 of half-life from such features. Our state-of-the-art model Saluki, a hybrid convolutional and

 recurrent neural network, is capable of predicting the effects of RNA sequences and genetic

 5
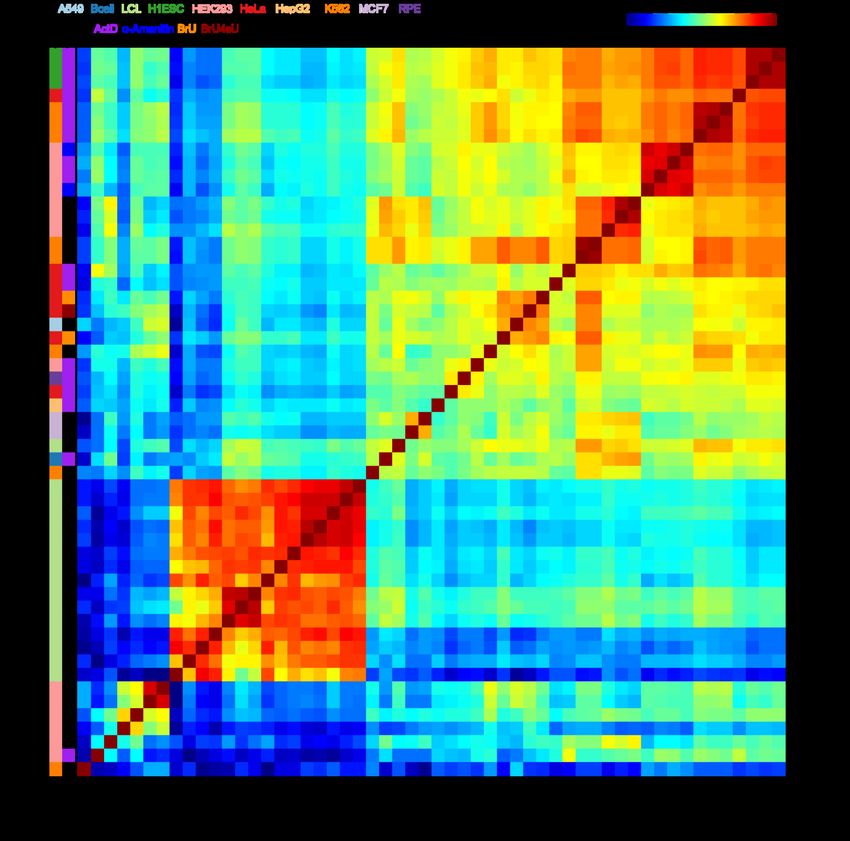
bioRxiv preprint doi: https://doi.org/10.1101/2022.03.18.484474; this version posted March 19, 2022. The copyright holder for this preprint
(which was not certified by peer review) is the author/funder, who has granted bioRxiv a license to display the preprint in perpetuity. It is made
 available under aCC-BY-NC-ND 4.0 International license.

 variants therein on RNA stability, in agreement with functional measurements derived from

 massively parallel reporter assays.

 RESULTS

 Comparison of study concordance in the mammalian half-life compendium

 To generate a compendium of mammalian half-life datasets, we mined the literature for

 published human and mouse half-life data. In total, we identified 33 publications reporting

 transcriptome-wide half-lives, with 16 submitting human data, 14 submitting mouse data, and 3

 submitting data from both species (Table 1). Counting individual replicates, this led to a total of

 54 human and 27 mouse half-life measurements. The human studies encompassed 10 cell types

 and 5 measurement procedures, while the mouse studies encompassed 8 cell types and 3

 procedures (Table 1). Each of the human studies reported half-lives for between ~2,500–13,000

 genes (Additional file 1: Fig. S1), while those from the mouse reported half-lives for between

 ~500–18,000 genes (Additional file 1: Fig. S2a) (Additional file 2: Dataset S1).

 In order to evaluate the consistency among studies, we computed the pairwise Spearman

 correlations of all datasets, using the subset of common genes measured by each pair of studies.

 Most pairs of human datasets exhibited strong (i.e., ≥0.6) correlations (Fig. 1). However, the

 datasets segregated largely into two clusters; the first encompassed a diverse array of studies, cell

 types, and procedures, and the second encompassed datasets from only five studies [27,41–44]

 which appeared to be outliers in that they exhibited poor (i.e., ≤0.5) correlation to most studies

 other than to those from their own batch (Fig. 1). Most subclusters did not cleanly segregate by

 cell type or experimental method; rather, they tended to cluster closely by their study or

 6
bioRxiv preprint doi: https://doi.org/10.1101/2022.03.18.484474; this version posted March 19, 2022. The copyright holder for this preprint
(which was not certified by peer review) is the author/funder, who has granted bioRxiv a license to display the preprint in perpetuity. It is made
 available under aCC-BY-NC-ND 4.0 International license.

 GroupID Method Species Cell types Samples Reference
 Akimitsu BrU (BRIC-seq) H HeLa 1 [45]
 Akimitsu2 BrU+4sU (Dyrec-seq) H HeLa 1 [46]
 Bazzini 4sU (SLAM-seq), ActD H K562, RPE, HeLa, HEK293 4 [29]
 Cramer 4sU (TT-seq) H K562 1 [47]
 Cramer2 4sU (TT-seq) H K562 1 [43]
 Darnell ActD H HepG2 1 [38]
 Dieterich 4sU H HEK293, MCF-7 4 [48]
 Gejman 4sU H LCLs (7 lines) 15 [44]
 He ActD H HeLa 2 [36]
 Jaffrey ActD H HEK293 1 [42]
 Marks ActD H HeLa 1 [49]
 Mortazavi 4sU (Long-TUC-seq) H GM12878 1 [50]
 Oberdoerffer BrU (BRIC-seq) H HeLa 1 [51]
 Rinn ActD H K562, H1-ESC 6 [52]
 Rissland 4sU H HEK293 4 [27]
 Shendure 4sU H A549 1 [53]
 Rissland2 4sU, ActD, α-Amanitin H, M HEK293, 3T3 6, 2 [41]
 Simon 4sU (TimeLapse-seq) H, M K562, MEF 2, 2 [54]
 Zimmer ActD H, M B cell, 3T3 1, 1 [55]
 Ameres 4sU (SLAM-seq) M mESC 1 [56]
 Bartel ActD M 3T3 1 [7]
 Bartel2 5EU M 3T3 2 [57]
 Darnell ActD M mESC 1 [58]
 Dolken 4sU (SLAM-seq) M M2-10B4 (bone marrow) 1 [59]
 Hanna ActD M mESC, mEB 2 [60]
 Hu ActD M mESC (E14Tg2a) 1 [61]
 Ko ActD M mESC 4 [6]
 Koszinowski 4sU M 3T3 1 [62]
 Mattick ActD M Neuro-2a 1 [45]
 Regev 4sU M Dendritic cells 1 [63]
 Regev2 4sU M Dendritic cells 1 [64]
 Selbach 4sU M 3T3 2 [65]
 Wilusz ActD M C2C12 3 [66]

 Table 1. Overview of studies compiled for meta-analysis, listing each publication by a GroupID, the
 method of determining half-lives, the species of origin (M: mouse, H: human), the cell type of origin, and
 number of samples (comma-separated when listing human and mouse, respectively).

 7
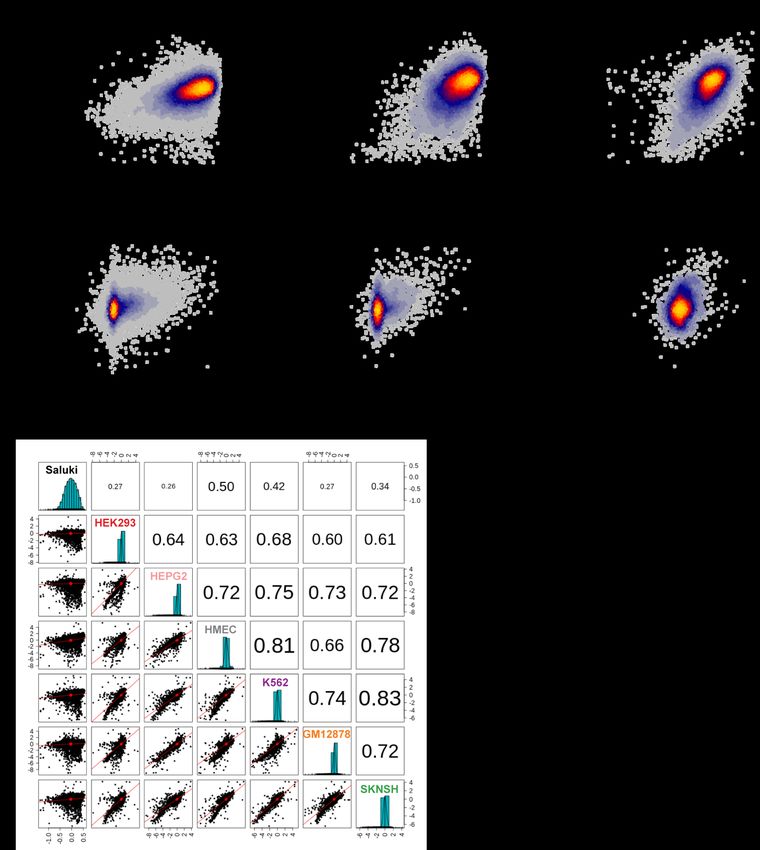
bioRxiv preprint doi: https://doi.org/10.1101/2022.03.18.484474; this version posted March 19, 2022. The copyright holder for this preprint
(which was not certified by peer review) is the author/funder, who has granted bioRxiv a license to display the preprint in perpetuity. It is made
 available under aCC-BY-NC-ND 4.0 International license.

 Figure 1. Comparison of half-lives in a compendium of human datasets. Heatmap of the absolute
 value of the Spearman correlations measured between half-lives derived from each pair of 54 human
 samples. Absolute values were used to accommodate five samples from four studies [29,38,46,49] whose
 data were deposited as degradation rates rather than half-lives. Samples are clustered using hierarchical
 clustering according to the indicated dendrogram. Rows are labeled by the study of origin (Table 1) and
 colored by the cell type of origin and measurement approach.

 8
bioRxiv preprint doi: https://doi.org/10.1101/2022.03.18.484474; this version posted March 19, 2022. The copyright holder for this preprint
(which was not certified by peer review) is the author/funder, who has granted bioRxiv a license to display the preprint in perpetuity. It is made
 available under aCC-BY-NC-ND 4.0 International license.

 laboratory of origin. This indicated the likely presence of batch effects which masked the

 cell-type specific signal captured by the data. Datasets from the mouse exhibited similar patterns

 of clustering, except that only two studies [60,64] appeared to be the greatest outliers due to their

 poor correlation to most other studies (Additional file 1: Fig. S2b).

 Comparison of methodological bias and cell-type specificity captured in the mammalian half-life

 compendium

 Given the wide disparity in reported genes (Additional file 1: Fig. S1 and S2a) and potential

 existence of outliers in some samples, we pre-processed our gene x sample human and mouse

 half-life matrices to improve our ability to evaluate sample relatedness and examine possible

 sources of measurement bias. We standardized the samples in each matrix, used iterative PCA to

 impute missing gene measurements, and performed quantile-normalization to align the samples

 into similar distributions. In total, we recovered 13,921 human genes and 14,463 mouse genes in

 our matrices (Additional file 3: Dataset S3). Finally, we performed PCA to evaluate the

 relatedness among the 54 human samples. As observed previously (Fig. 1), PC1 identified

 samples from a single study [44] to be the greatest outliers relative to all other studies

 (Additional file 1: Fig. S3). We therefore found it parsimonious to assume that measurements

 from this study were severely biased, and henceforth excluded samples from this study from

 further analysis.

 Reperforming the PCA analysis on the remaining 39 human samples revealed weak to

 non-existent clustering by cell type, and stronger clustering by measurement method (Fig. 2a).

 Specifically, PC2 seemed to segregate samples derived from pulse labeling experiments (i.e.,

 9
bioRxiv preprint doi: https://doi.org/10.1101/2022.03.18.484474; this version posted March 19, 2022. The copyright holder for this preprint
(which was not certified by peer review) is the author/funder, who has granted bioRxiv a license to display the preprint in perpetuity. It is made
 available under aCC-BY-NC-ND 4.0 International license.

 Figure 2. Assessment of measurement bias and cell-type specificity present in half-life data.
 a) PCA of all human samples except those from an outlier study [44], with sample names colored
 according to cell type and corresponding data point colored according to measurement approach. Axes are
 labeled according to the percentage of variance among samples explained by the first two PCs. See also
 Additional file 1: Fig. S3 for the same analysis using all samples. b) Boxplot of sample distributions
 along PC2, partitioned according to the measurement method (i.e., pulse labeling or transcriptional
 shutoff). Replicates for the same study were first averaged according to their PC2 value prior to assessing
 differences between the methods, with statistical differences between distributions evaluated using a
 two-sided Wilcoxon rank-sum test. c) Evaluation of the Pearson correlations between pairs of half-life
 samples. Considered in this plot were the subset of pairs of two different studies that interrogated
 half-lives in either the same cell type or different cell types. Statistical differences between the
 distributions were evaluated using a one-sided Wilcoxon rank-sum test to assess whether correlations
 from the same cell type exceeded those from a different cell type. d-e) These panels are the same as those
 in (a) and (c), respectively, except compare mouse samples. f) Comparison of consensus, cell-type
 agnostic (i.e., methodology and cell-type independent) measurements of human and mouse half-lives
 among one-to-one orthologous genes. Half-lives for each species were computed as PC1 of the respective
 gene x sample matrix. Also indicated are the Pearson (r) and Spearman (rho) correlation values as well as
 sample size (n) of genes considered. Shown in all boxplots is the median value (bar), 25th and 75th
 percentiles (box), and 1.5 times the interquartile range (whiskers).

 10
bioRxiv preprint doi: https://doi.org/10.1101/2022.03.18.484474; this version posted March 19, 2022. The copyright holder for this preprint
(which was not certified by peer review) is the author/funder, who has granted bioRxiv a license to display the preprint in perpetuity. It is made
 available under aCC-BY-NC-ND 4.0 International license.

 those using 4sU, BrU, and BrU4sU) with those derived from transcriptional shutoff experiments

 (i.e., those using ActD and α-Amanitin). After averaging the PC2 values among replicates, we

 observed a statistically significant difference between the PC2 distributions for these two

 methodological classes (Fig. 2b), revealing a fundamental inconsistency in these techniques.

 To ascertain whether the human data captured cell-type-specific half-lives, we evaluated all

 pairwise Pearson correlations between half-lives from samples derived from different studies (in

 order to minimize the influence of inflated correlations among replicates of the same study), but

 assessed on either the same cell type or different cell types. We hypothesized that we should see

 stronger correlations among samples evaluating the same cell type; however, we did not observe

 statistical support for this hypothesis (Fig. 2c), indicating that there was no detectable

 cell-type-specific signal for half-lives in human cells. Nearly identical results were achieved

 using Spearman correlations instead of Pearson correlations (data not shown). Given the known

 tissue-specific roles of miRNAs [67] and other post-transcriptional RBP regulators, we find it

 more plausible that technical noise and methodological bias obscure the cell-type specificity of

 half-life measurements relative to the possibility that none exists biologically.

 Next, we again used PCA to evaluate the relatedness among the 27 mouse samples. In the

 mouse, there appeared to be stronger clustering by cell type and measurement methodology

 along both PC1 and PC2 (Fig. 2d). Indeed, Pearson correlations between pairs of half-life

 measurements from the same cell type and different study exceeded those from different cell

 types and different studies (Fig. 2e), suggesting the detection of a cell-type specific signature.

 Although this observation is encouraging, the limited sample size, coupled with the confounded

 11
bioRxiv preprint doi: https://doi.org/10.1101/2022.03.18.484474; this version posted March 19, 2022. The copyright holder for this preprint
(which was not certified by peer review) is the author/funder, who has granted bioRxiv a license to display the preprint in perpetuity. It is made
 available under aCC-BY-NC-ND 4.0 International license.

 nature of measurement methodology and cell type, make it ultimately impossible to decompose

 the relative influence of methodological bias and cell-type specificity in the measurement of

 mouse half-lives. In the future, a controlled study measuring half-lives in a number of different

 cell types with multiple experimental approaches would help to more accurately assess this.

 Given our lack of success in identifying clear cell-type-specific measurements of half-life in the

 human and mouse samples, we instead focused on deriving cell-type-agnostic (i.e., universal)

 measures of half-life which integrate information across all methodologies and cell types.

 Towards this end, we computed the first PC in each of our gene x sample matrices to derive

 consensus measurements of half-life for each gene from each species. The PC1s explained

 62.4% and 62.6% of variance among genes in each species, respectively, while PC2s explained

 merely 6.6% and 9.8% of variance, so were henceforth not used. Given that this procedure was

 performed independently in each species, we would expect that any artifacts induced by the

 procedure would corrupt the evolutionary relationship of measurements between species.

 However, we instead observed a strong concordance between our consensus half-life

 measurements among one-to-one orthologs between the two species (Fig. 2f). Our interspecies

 Pearson correlation of 0.78 greatly exceeds that of 0.61 reported previously in the literature [6].

 This indicates that mRNA half-life has been more strongly conserved than previously

 appreciated between mammalian species separated by ~75 million years of evolutionary time.

 Moreover, this finding also demonstrates our ability to recover a highly precise measurement of

 half-life that successfully ameliorates the impact of technical noise and methodological bias.

 12
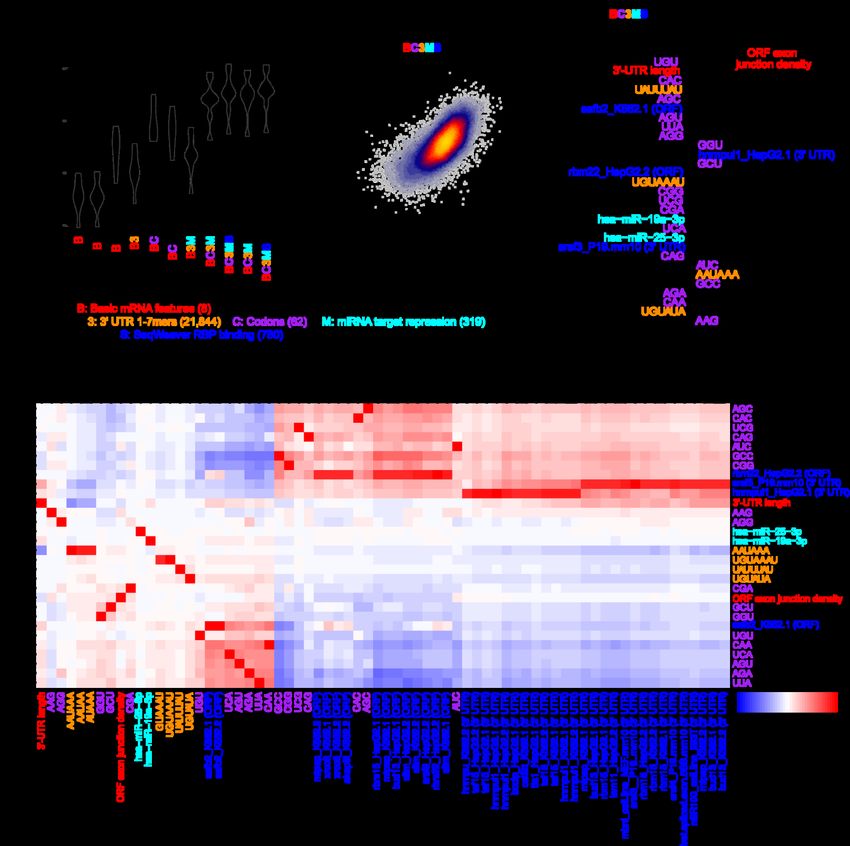
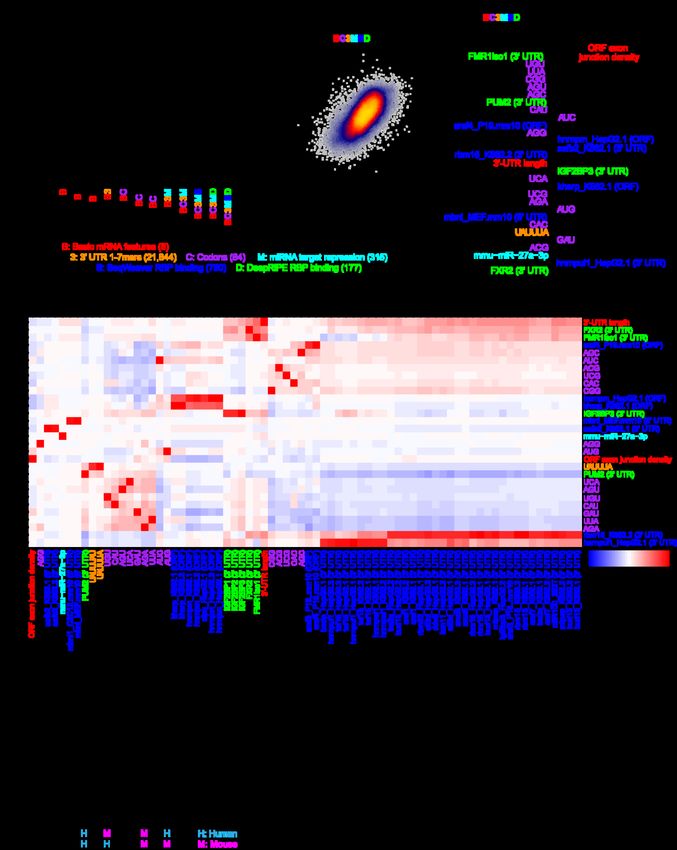
bioRxiv preprint doi: https://doi.org/10.1101/2022.03.18.484474; this version posted March 19, 2022. The copyright holder for this preprint
(which was not certified by peer review) is the author/funder, who has granted bioRxiv a license to display the preprint in perpetuity. It is made
 available under aCC-BY-NC-ND 4.0 International license.

 A genetic model of mRNA half-life

 Given our consensus measurements of mRNA half-life, we sought to determine whether it was

 possible to improve the predictability of half-life from mRNA sequence. Towards this end, we

 engineered groups of features (Table 2) with the goal of deriving a machine learning (ML)-based

 regression model to automatically select the subset of pertinent features. Our sequence-derived

 feature groups consisted of: i) basic mRNA features such as the length and G/C content of

 different functional regions and ORF exon junction density [2,6,7]; ii) k-mer frequencies of

 length 1-7 in the 5′ UTR, ORF, or 3′ UTR; iii) codon frequencies; iv) predicted repression scores

 of mammalian-conserved miRNA families [24]; and v) predicted binding of various RBPs to the

 mRNA sequence by SeqWeaver [68] and DeepRiPE [69]. RBP binding was predicted separately

 for the 5′ UTR, ORF, and 3′ UTR because it has previously been observed from cross-linking

 and immunoprecipitation sequencing (CLIP-seq) that RBPs have a tendency to bind in specific

 functional regions [70].

 Next, we sought to determine which of these sequence-derived groups of features would be

 useful for predicting half-life. Because of the hierarchical association of each feature to a group

 (Table 2), we thus evaluated a series of nested models which iteratively considered additional

 groups of features. Each feature set was fed into a lasso regression model, and the relative model

 performance was compared between a simpler and more complex group on different folds of

 held-out data using a 10-fold cross-validation (CV) strategy. This helped to establish whether the

 inclusion of additional groups was justified. Evaluating the model series on our human half-life

 data, we observed that: i) 5′-UTR k-mers did not improve the model, ii) ORF k-mers did not

 improve the model beyond the simpler consideration of codons, iii) both 3′-UTR k-mers and

 13
bioRxiv preprint doi: https://doi.org/10.1101/2022.03.18.484474; this version posted March 19, 2022. The copyright holder for this preprint
(which was not certified by peer review) is the author/funder, who has granted bioRxiv a license to display the preprint in perpetuity. It is made
 available under aCC-BY-NC-ND 4.0 International license.

 Feature description Feature type Data source # features

 Basic mRNA features such as length and G/C Sequence-derived Custom Perl scripts 8
 content of 5′ UTR, ORF, and 3′ UTR; intron
 length; ORF exon junction density

 Codon frequencies Sequence-derived Custom R scripts 64

 1- to 7-mer frequencies in the 5′ UTR Sequence-derived Custom R scripts 21,844

 1- to 7-mer frequencies in the ORF Sequence-derived Custom R scripts 21,844

 1- to 7-mer frequencies in the 3′ UTR Sequence-derived Custom R scripts 21,844

 Predicted average binding score of human RBPs Sequence-derived DeepRiPe predictions [69] 177
 (in each of 5′ UTR, ORF, and 3′ UTR)

 Predicted average binding score of human and Sequence-derived SeqWeaver predictions [68] 780
 mouse RBPs (in each of 5′ UTR, ORF, and 3′
 UTR)

 Number of CLIP peaks for various RBPs Biochemical ENCORI database [71] 133

 Number of eCLIP peaks for various RBPs Biochemical ENCORE database [72] 225
 (K562, HepG2, and adrenal gland)

 Number of PAR-CLIP peaks Biochemical [70] 146

 Number of CLIP peaks for m6A pathway Biochemical [37,42,73–77] 13
 components (a6A, m6Am, YTHDF2, METTL3,
 METTL14, and WTAP)

 RIP-seq of diverse RBPs and translational Biochemical [36,78–80] 34
 efficiency

 Table 2. Summary of features considered in models trained to predict mRNA half-life, with a description
 of the features considered, feature type (i.e., sequence or biochemical), data source, and number of
 features in the category. Sequence features were calculated identically for both human and mouse.
 Biochemical features were calculated only with respect to human data.

 predicted miRNA repression scores improved the model, and iv) SeqWeaver predictions of RBP

 binding improved the model more than those from DeepRiPE (Fig. 3a). Our final model that

 optimally balanced the tradeoff between complexity and performance was the “BC3MS” model,

 which considered basic mRNA features, codon frequencies, 3′-UTR k-mers, miRNA repression

 scores, and SeqWeaver predictions.

 14
bioRxiv preprint doi: https://doi.org/10.1101/2022.03.18.484474; this version posted March 19, 2022. The copyright holder for this preprint
(which was not certified by peer review) is the author/funder, who has granted bioRxiv a license to display the preprint in perpetuity. It is made
 available under aCC-BY-NC-ND 4.0 International license.

 Figure 3. Prediction of human half-lives using sequence-encoded features.
 a) Performance of trained lasso regression models on each of 10 held-out folds of data. Compared is the
 relative performance between pairs of nested models which iteratively consider greater numbers of
 features. Each model is described by a code indicating the features considered. A description of the code
 is provided in the key, along with the corresponding number of features considered listed in parentheses.
 An improvement in a more complex model relative to a simpler model was evaluated with a one-sided,
 paired t-test, adjusted with a Bonferroni correction to account for the total number of hypothesis tests.
 Features which were ultimately determined to contribute to performance improvement are colored, or are
 left black if they did not improve the model. b) Shown are the final predictions for the optimal model (i.e.,
 BC3MS) after concatenating the observations for all 10 folds of held-out data. Also indicated are the
 Pearson (r) and Spearman (rho) correlation values. c) The top 30 ranked model coefficients corresponding
 to the BC3MS model, trained on the full dataset. Features are colored according to the same key as that in
 panel (a). d) Pearson correlation matrix between the union of all top 30 features from (c), shown as rows,

 15
bioRxiv preprint doi: https://doi.org/10.1101/2022.03.18.484474; this version posted March 19, 2022. The copyright holder for this preprint
(which was not certified by peer review) is the author/funder, who has granted bioRxiv a license to display the preprint in perpetuity. It is made
 available under aCC-BY-NC-ND 4.0 International license.

 and other features sharing a Pearson correlation either ≤ –0.8 or ≥ 0.8, shown as columns. Feature names
 are colored according to the origin of the feature as shown in the same key as panel (a). Hierarchical
 clustering was used to group features exhibiting similar correlation patterns.

 Concatenating the predictions across all folds of held-out data, we observed a correlation of 0.67

 between the BC3MS model predictions and observed human half-lives (Fig. 3b). We retrained

 this model on the full dataset to assess which features contributed most significantly to half-life

 prediction. The top-30 ranked features of the model consisted primarily of basic mRNA

 properties, codon frequencies, and predicted miRNA/RBP binding sites (Fig. 3c). Consistent

 with previous work [2,6,7], ORF exon junction density was the dominant feature. Moreover, the

 signs of coefficients associated with codon frequencies are consistent with previously published

 human Codon Stability Coefficients (CSCs) [26,27,29,30], which were computed based upon an

 isolated Pearson or Spearman correlation between the codon frequencies and half-lives [28].

 CSCs have been previously established as a quantitative metric that captures the association

 between a codon and mRNA stability [26–30]. Our model contextualized relative codon

 influence with respect to other sequence features in a multiple linear regression framework, and

 re-ranked their utility in the prediction task.

 Next, despite considering over 20,000 possible 3′-UTR k-mers, the model automatically

 discovered highly conserved regulatory motifs such as UAUUUAU, the core AU-rich element

 (ARE) [16,34]; UGUAAAU and its variant UGUAUA, Pumilio binding elements [33]; and

 AAUAAA, the cleavage and polyadenylation motif involved in alternative polyadenylation

 [81,82]. The binding of four RBPs emerged as the most useful features, including that of SAFB2

 and RBM22 in the ORF as well as HNRNPUL1 and SRSF3 in the 3′-UTR. Finally, consistent

 16
bioRxiv preprint doi: https://doi.org/10.1101/2022.03.18.484474; this version posted March 19, 2022. The copyright holder for this preprint
(which was not certified by peer review) is the author/funder, who has granted bioRxiv a license to display the preprint in perpetuity. It is made
 available under aCC-BY-NC-ND 4.0 International license.

 with previous work showing that miRNAs weakly impact half-life [7], the model predicted light

 repressive roles for two miRNAs, miR-19a and miR-25.

 Although we find these factors to be promising candidates, we caution that the interpretation of

 feature selection and coefficient-based ranking is inherently limited by the substantial degree of

 multicollinearity among features. To guard against the possibility of lasso regression selecting

 one feature over another through its spuriously higher correlation to half-life, we examined the

 full set of features strongly correlated to the top 30 selected features (Fig. 3d). While the

 majority of features were not strongly correlated to other features, we indeed found that

 SeqWeaver predicted a similar degree of binding among numerous alternative factors such as

 MTPAP, XRCC6, AKAP8L, RBM15, BUD13, SLTM, SRSF9, HNRNPU, TAF15, BCCIP,

 CSTF2T, TIA1, LSM11, MBNL, and SRSF4. We consider this full set of RBPs, in conjunction

 with our earlier set, as candidate post-transcriptional regulators for future experimental

 investigation.

 We repeated the same analyses independently for the mouse, with the goal of devising a genetic

 model to predict mouse half-lives. While most findings were highly similar between the two

 species, key differences include: i) DeepRiPE features significantly boosted performance,

 leading to the optimality of the “BC3MSD” model (Additional file 1: Fig. S4a); ii) the model

 achieved a slightly lower Pearson correlation of 0.61 (Additional file 1: Fig. S4b); iii) the

 feature ranking varied, with the inclusion of FMR1, SRSF4, HNRNPM, RBM15, IGF2BP3,

 KHSRP, MBNL, miR-27a, and FXR2 in the top 30 coefficients (Additional file 1: Fig. S4c);

 17
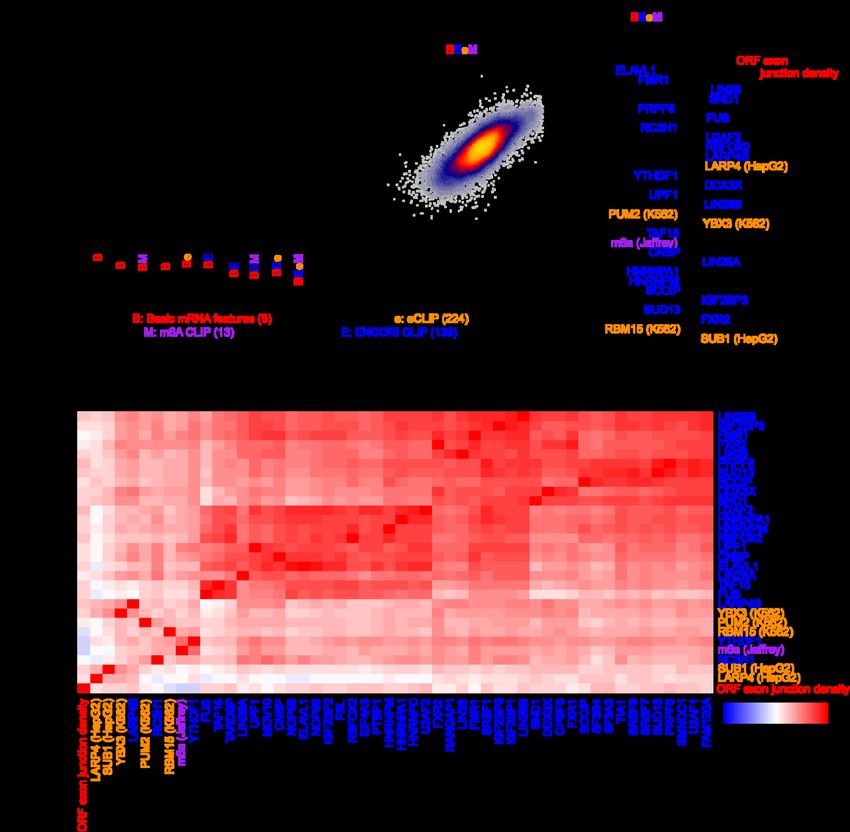
bioRxiv preprint doi: https://doi.org/10.1101/2022.03.18.484474; this version posted March 19, 2022. The copyright holder for this preprint
(which was not certified by peer review) is the author/funder, who has granted bioRxiv a license to display the preprint in perpetuity. It is made
 available under aCC-BY-NC-ND 4.0 International license.

 and additional factors correlated with the top 30 features, such as HNRNPM, SFPQ, SRSF3,

 TRA2A, SRSF1, EIF3D, DDX6, XRCC6, and SRSF7 (Additional file 1: Fig. S4d).

 Finally, we evaluated the ability of the models trained in each species to generalize to the

 opposite species. Our interspecies comparisons revealed that models tested in the opposite

 species performed competitively, albeit slightly worse, than models trained within the same

 species, for both the human and mouse (Additional file 1: Fig. S4e). This indicates that the vast

 majority of the learned half-life-associated features have strong predictive value more generally

 across the mammalian phylogeny.

 A biochemical model of mRNA half-life

 Given the recent trove of biochemical data evaluating RBP binding, we attempted to identify

 experimentally supported features that are predictive of mRNA half-life. Towards this goal, we

 assembled an array of several large-scale datasets measuring RBP binding to develop an

 ML-based regression model analogous to our genetic model. Our biochemical feature groups

 consisted of: i) the number of CLIP peaks in an mRNA for various RBPs in the ENCORI

 database [71], ii) the number of eCLIP peaks for various RBPs in the ENCORE database [72],

 iii) the number of PAR-CLIP peaks for various RBPs [70], iv) the number of CLIP peaks for

 m6A pathway components [37,42,73–77], v) and RIP-seq of diverse RBPs and translational

 efficiency [36,78–80] (Table 2). Implementing the same strategy as before to compare nested

 models with 10-fold CV, we observed that: i) PAR-CLIP data did not improve the model, ii)

 RIP-seq data did not improve the model after jointly considering eCLIP and m6A CLIP data, and

 iii) the remaining datasets all improved the model, with the greatest benefit emerging from

 18
bioRxiv preprint doi: https://doi.org/10.1101/2022.03.18.484474; this version posted March 19, 2022. The copyright holder for this preprint
(which was not certified by peer review) is the author/funder, who has granted bioRxiv a license to display the preprint in perpetuity. It is made
 available under aCC-BY-NC-ND 4.0 International license.

 considering the ENCORI database (Fig. 4a). “BEeM” was our best model, which considered

 basic mRNA features, ENCORI CLIP, eCLIP, and m6A CLIP data.

 Figure 4. Prediction of human half-lives using biochemical features. This figure is organized in the
 same fashion as Fig. 3, except it evaluates features derived from biochemical experiments. All CLIP data
 is computed as the number of peaks on the full-length transcript, while RIP-seq is represented as a
 continuous measurement of the enrichment of RBP binding relative to a control IP.

 19
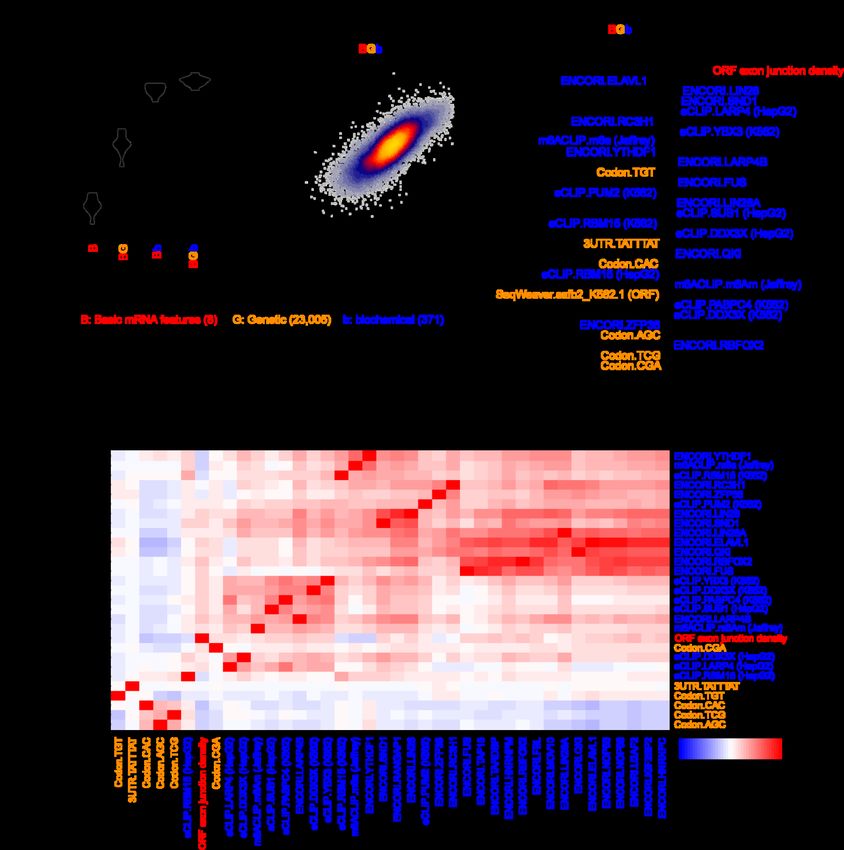
bioRxiv preprint doi: https://doi.org/10.1101/2022.03.18.484474; this version posted March 19, 2022. The copyright holder for this preprint
(which was not certified by peer review) is the author/funder, who has granted bioRxiv a license to display the preprint in perpetuity. It is made
 available under aCC-BY-NC-ND 4.0 International license.

 We observed a global correlation of 0.77 between the BEeM model’s held-out predictions and

 observed human half-lives (Fig. 4b). The top-30 ranked features of the model (i.e., retrained on

 the full dataset) consisted primarily of the ORF exon junction density and dozens of RBPs (Fig.

 4c). A number of RBPs consistently emerged between our genetic (Fig. 3c,d and Additional file

 1: Fig. S4c,d) and biochemical models, including BUD13, BCCIP, HNRNPM, FMR1, PUM1

 (i.e., a Pumilio-element binding protein), ELAVL1 (i.e., an ARE binding protein), TAF15,

 IGF2BP3, FXR2, and RBM15. Novel components that were not previously captured by the

 genetic model include LIN28A/B, SND1, PRPF8, FUS, RC3H1, U2AF2, RBFOX2, LARP4,

 YTHDF1 and its ligand m6A, DDX3X, UPF1, YBX3, CNBP, HNRNPA1, and SUB1 (Fig. 4c).

 Collectively, these factors were strongly correlated to others which serve as candidate regulators

 of mRNA stability (Fig. 4d).

 Finally, we tested the possibility that a joint genetic and biochemical model might outperform

 either individually. A lasso regression model jointly trained upon BC3MS (i.e., genetic) and

 BEeM (i.e., biochemical) features modestly outperformed our BEeM model alone (Additional

 file 1: Fig. S5a), achieving a Pearson correlation of 0.78 (Additional file 1: Fig. S5b). The

 biochemical features were dominantly used in this model, although several codons were selected,

 along with the ARE 7-mer, which minimized the effect size of the coefficient attributable to

 ELAVL1 (Additional file 1: Fig. S5c,d).

 A deep-learning based genetic model of mRNA half-life

 Having compared the performance of genetic and biochemical models, we sought to evaluate

 whether an alternative learning paradigm might be able to automatically decipher

 20
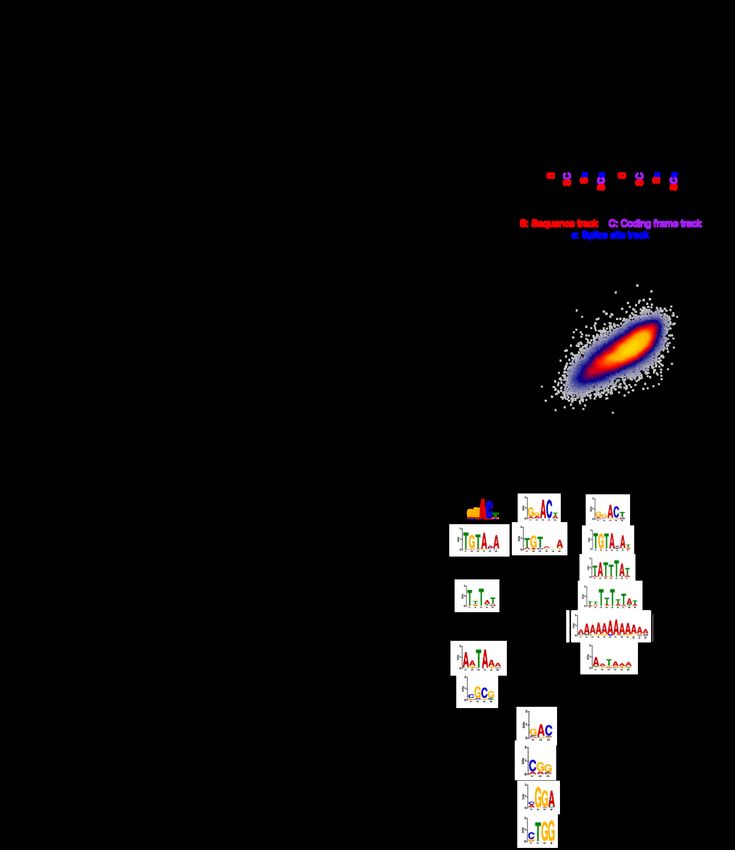
bioRxiv preprint doi: https://doi.org/10.1101/2022.03.18.484474; this version posted March 19, 2022. The copyright holder for this preprint
(which was not certified by peer review) is the author/funder, who has granted bioRxiv a license to display the preprint in perpetuity. It is made
 available under aCC-BY-NC-ND 4.0 International license.

 sequence-based rules that are more predictive of mRNA half-life. Towards this goal, we trained a

 hybrid convolutional and recurrent deep neural network architecture, called Saluki, which has the

 advantage of potentially uncovering nonlinear (e.g., cooperative) relationships among motifs and

 spatial principles with respect to motif positioning. The input to our model was a binary

 encoding of the mRNA sequence (i.e., up to a maximum of 12,288 nt), concatenated with binary

 variables for each nucleotide indicating the presence or absence of the first reading frame of a

 codon and splice site (Fig. 5a). This matrix was fed in to a neural network comprised of 64 1D

 convolutions (width 5), a max pooling layer (width 2), 6 additional blocks of these

 aforementioned layers, a recurrent layer consisting of a gated recurrent unit (GRU), and a

 densely connected layer (Methods, Fig. 5a, and Additional file 1: Fig. S6a). Given that mRNA

 sequences are variable in length, the 3′ end of each mRNA was padded with Ns after the

 transcriptional end site. To account for this property of the input, we left-justified the input

 matrix, and the GRU was oriented to pass information from the right to left such that the

 sequence was still most recently considered by the network (i.e., as opposed to the padded Ns)

 when integrating information from the full sequence to make a prediction. The parameters

 comprising this common “trunk” of the network were jointly trained on human and mouse data

 in alternating batches of species-specific data, with two “heads” to predict human and mouse

 half-lives, respectively [4,5].

 We performed an ablation analysis in which the model was evaluated after training it with only

 sequence as input; sequence and reading frame tracks; and sequence, reading frame, and splice

 site tracks. This analysis revealed that all forms of information were utilized by the network for

 Saluki to achieve optimal performance (Additional file 1: Fig. S6b). Training our Saluki model

 21
bioRxiv preprint doi: https://doi.org/10.1101/2022.03.18.484474; this version posted March 19, 2022. The copyright holder for this preprint
(which was not certified by peer review) is the author/funder, who has granted bioRxiv a license to display the preprint in perpetuity. It is made
 available under aCC-BY-NC-ND 4.0 International license.

 with the identical folds of data as our lasso regression models enabled us to directly compare

 their respective performances on each of the 10 folds of held-out data. Averaging the predictions

 using models derived from each of five independent training runs for each fold, Saluki’s

 performance exceeded that of the genetic lasso regression models for each species (i.e.,

 “BC3MS” for human and “BC3MSD” for mouse), and it performed nearly identically with the

 human biochemical regression model (i.e., “BEeM”) (Fig. 5b). The final human and mouse

 models displayed correlations of 0.77 and 0.73, respectively (Fig. 5c and Additional file 1: Fig.

 S6c), suggesting that Saluki potentially learned novel principles of post-transcriptional gene

 regulation which our simpler linear models were unable to capture.

 22
bioRxiv preprint doi: https://doi.org/10.1101/2022.03.18.484474; this version posted March 19, 2022. The copyright holder for this preprint
(which was not certified by peer review) is the author/funder, who has granted bioRxiv a license to display the preprint in perpetuity. It is made
 available under aCC-BY-NC-ND 4.0 International license.

 Figure 5. State-of-the-art prediction of half-lives and genetic variant functional effects using a
 sequence-based deep learning model.
 a) A hybrid convolutional/recurrent neural network architecture to predict half-life from an input of the
 RNA sequence, an encoding of the first frame of each codon, and 5′ splice site junction(s). The deep
 learning model, called Saluki, was jointly trained on mouse and human half-life data to predict
 species-specific half-lives. b) Performance of the trained Saluki models on each of 10 held-out folds of
 data, relative to the corresponding performances from our best genetic (i.e., “BC3MS” for human and
 “BC3MSD” for mouse, respectively) and biochemical (i.e., “BEeM”) lasso regression models. An
 improvement relative to another model was evaluated with a two-sided, paired t-test. c) Shown are the
 final predictions after concatenating the observations for all 10 folds of held-out data. Also indicated are
 the Pearson (r) and Spearman (rho) correlation values. d) Metagene plot of ISM scores across all mRNAs
 for percentiles along the 5′ UTR, ORF, and 3′ UTR. mRNAs were grouped into one of 4 bins according to
 their predicted half-lives. For the set of mRNAs within each bin, we plotted the average of the absolute
 value of the mean predicted effect size (i.e., of the three possible alternative mutations). e) ISM results of
 two 3′-UTR segments from TUBGCP3 and PI4K2B. Partial matches to the AU-rich element (ARE, or
 “UAUUUAU”) and Pumilio/FBF (PUF, or “UGUAHAUA”) binding element consensus sequences are

 23
bioRxiv preprint doi: https://doi.org/10.1101/2022.03.18.484474; this version posted March 19, 2022. The copyright holder for this preprint
(which was not certified by peer review) is the author/funder, who has granted bioRxiv a license to display the preprint in perpetuity. It is made
 available under aCC-BY-NC-ND 4.0 International license.

 boxed. For each motif, single point mutations resulting in particularly severe or opposite phenotypes are
 shown alongside annotations reflecting the corresponding ARE and PUF consensus gain or loss events. f)
 Insertional analysis of motifs discovered by TF-MoDISco [83]. Each motif was inserted into one of 50
 positional bins along the 5′ UTR, ORF, and 3′ UTR of each mRNA. Indicated is the average predicted
 change in half-life for each bin plotted along a metagene. g) This panel is the same as panel f), except it
 performs analysis of 61 codons (excluding the 3 stop codons) inserted into the first reading frame along
 the length of the ORF. Selected codons are colored, with the rest shown in gray. h) Scatter plot showing
 the relationship between the mean influence of each codon along the length of the ORF, as predicted by
 Saluki in panel g), and the mean codon stability coefficient over a set of cell types as observed previously
 [26]. Also indicated are the Pearson (r) and Spearman (rho) correlation values.

 In the hopes of revealing such principles, we tested the predictive behavior of Saluki in different

 contexts. First, we performed an in silico mutagenesis (ISM) for every human mRNA in our

 dataset, mutating each reference nucleotide of an mRNA into every alternative allele to evaluate

 the predicted change in half-life [1,4,5,84]. We generated a metagene plot using these scores,

 evaluating the absolute value of the mean effect size (i.e., of the three possible alternative

 mutations) in percentiles along the length of each functional region (Fig. 5d). This analysis

 revealed that the model predicts a relatively modest influence for the 5′ UTR relative to the ORF

 and 3′ UTR. Moreover, the termini of functional regions, such as the 3′ terminus of the 5′ UTR as

 well as the 5′ and 3′ termini of the ORF and 3′ UTR, were revealed to harbor the most

 informative positions along an mRNA that contribute to half-life (Fig. 5d).

 We further interrogated our ISM scores to identify the most pertinent motifs associated with

 changes in half-life using TF-MoDISco [83]. The poly-A binding element (“AAAAAAA”), ARE

 (“UAUUUAU”), PUF element (“UGUAHAUA”), putative ELAVL1/2 element (“UUUAU”),

 polyadenylation element (“AAUAAA”), and m6A motif (“GGACU”) were enriched as

 significant motifs in the 3′ UTR. Of these, the m6A motif and PUF element were also enriched in

 the ORF and 5′ UTR, and the putative ELAVL1/2 and polyadenylation elements were enriched in

 24
bioRxiv preprint doi: https://doi.org/10.1101/2022.03.18.484474; this version posted March 19, 2022. The copyright holder for this preprint
(which was not certified by peer review) is the author/funder, who has granted bioRxiv a license to display the preprint in perpetuity. It is made
 available under aCC-BY-NC-ND 4.0 International license.

 the 5′ UTR (Additional file 1: Fig. S6d). Visualizing ISM scores for two random examples, the

 3′-UTR segments from TUBGCP3 and PI4K2B, illustrates several learned properties involving

 these motifs (Fig. 5e). Broadly speaking, a mutation ablating a core ARE or PUF element led to

 a predicted increase in mRNA half-life. Conversely, several point mutations led to a gain of a

 motif, leading to a predicted decrease in half-life. While a subset of these mutations generated

 novel motifs, others changed an existing motif closer to its consensus sequence. In some cases, a

 mutation caused a dual loss of overlapping PUF/ARE motifs, leading to a more severe predicted

 change in half-life relative to the loss of each individual motif (Fig. 5e).

 Next, we evaluated how the model would behave if we inserted either a splice site or one of our

 five enriched motifs along the full length of each mRNA. We performed this insertional analysis

 for most human mRNAs in our dataset, and then averaged the result according to the spatial bin

 of the insertion along each functional region. Consistent with their known roles, we observed that

 insertion of an m6A site, ARE, or PUF element reduced mRNA stability, with the greatest effect

 size arising from a 3′-UTR insertion (Fig. 5f). In contrast, insertion of a splice site,

 polyadenylation element, or C-rich element led to enhanced mRNA stability. Consistent with the

 lasso regression model, the presence of a splice site led to at least a four-fold enhancement in

 half-life relative to alternative motifs. The most novel property captured in the deep learning

 model—yet absent from our lasso model—is the strong dependence between the spatial

 coordinate of the motif along the mRNA and its predicted impact on mRNA half-life, both across

 and within functional regions (Fig. 5f). For instance, ARE and PUF sites are predicted to most

 strongly repress mRNA stability if they occur at the 5′ or 3′ terminus of the 3′ UTR, reminiscent

 of a well-known property of microRNA-mediated repression [24,85]. In contrast, the m6A

 25
bioRxiv preprint doi: https://doi.org/10.1101/2022.03.18.484474; this version posted March 19, 2022. The copyright holder for this preprint
(which was not certified by peer review) is the author/funder, who has granted bioRxiv a license to display the preprint in perpetuity. It is made
 available under aCC-BY-NC-ND 4.0 International license.

 element is predicted to most destabilize mRNA immediately after the stop codon, mirroring the

 known relationship between m6A deposition and mRNA stability [58].

 Given the mechanistic link between codon usage and mRNA half-life [8,26–30], we sought to

 ascertain whether Saluki has also learned this property. We therefore reiterated our insertional

 analysis, this time using 61 codons (excluding the 3 stop codons) inserted into the first reading

 frame along the length of each ORF. As before, the model attributed substantially different effect

 sizes to codons depending upon their position along an ORF, with the greatest predicted effects

 occurring close to the start and stop codons (Fig. 5g). Although most codons had the greatest

 predicted effect when inserted closer to the stop codon, several codons such as “CUG”, “UUC”,

 “GAA”, and “GAC” were predicted to have a modest effect when inserted into most regions

 except near the start codon (Fig. 5g). We sought to compare our predicted codon effects to

 existing measures of codon influence, such as the aforementioned CSCs [26–30]. We therefore

 investigated the relationship between the mean codon influence across an ORF, as predicted by

 Saluki, relative to the mean CSC across numerous cell types as quantified previously [26].

 Reassuringly, there was a strong relationship between the two metrics (Pearson correlation =

 0.68, Fig. 5g), suggesting that Saluki successfully captures the influence of codon usage.

 Prediction of 3′-UTR regulatory function and genetic variant effects

 Given Saluki’s strong performance in predicting endogenous half-lives, we sought to evaluate its

 ability to predict the effect of mRNA sequence and genetic variants therein on mRNA stability in

 a more controlled context. Massively parallel reporter assays (MPRAs) provide an ideal setting

 to test causal relationships, because they can directly assess how specific sequences influence

 26
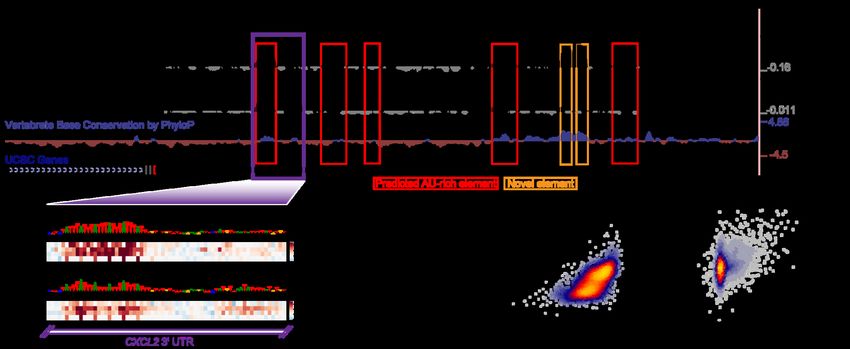
bioRxiv preprint doi: https://doi.org/10.1101/2022.03.18.484474; this version posted March 19, 2022. The copyright holder for this preprint
(which was not certified by peer review) is the author/funder, who has granted bioRxiv a license to display the preprint in perpetuity. It is made
 available under aCC-BY-NC-ND 4.0 International license.

 reporter expression. Several studies have deployed MPRAs to test the functional impact of

 thousands of 3′-UTR fragments and genetic variants therein on mRNA stability [86–88]. We

 performed in silico versions of these MPRA experiments to evaluate their consistency with in

 vivo experiments.

 The first study performed three types of MPRA experiments: i) evaluating the impact of

 mutation on 8-nt intervals tiling the CXCL2 3′ UTR, ii) performing a saturation mutagenesis of a

 specific region within the same 3′ UTR to measure variant effects, and iii) testing the effect of

 3,000 highly conserved 3′-UTR segments on RNA stability [86]. To compare our predictions to

 the first of the three MPRA experiments, we compared our pre-computed ISM scores for the

 CXCL2 3′ UTR to those observed in the experiment (Fig. 6a). We observed a general qualitative

 agreement between model predictions and experiment in the 3′-UTR regions showing high

 activity, which typically overlapped conserved and ARE-containing regions (Fig. 6a). However,

 there were several novel elements detected by the assay which were conserved but not predicted

 by the model, indicating several false negatives among the predictions. Next, we evaluated how

 well our predictions agree with saturation mutagenesis data from the tested CXCL2 3′-UTR

 region. To more closely simulate this experiment in silico, we integrated each of the measured

 oligonucleotide fragments into the 3′ UTR of eGFP within the corresponding BTV vector tested

 in the experiment [86]. Then, for each mutation, we calculated the predicted variant effect as the

 divergence of predicted half-lives between the reference and alternative sequence. We observed a

 strong agreement between the observed and predicted variant effects, in which both methods

 highlighted a strong effect for a set of upstream AREs and a weaker effect for a downstream

 ARE (Fig. 6b). Collectively, the variant effect predictions agreed with those observed with a

 27
bioRxiv preprint doi: https://doi.org/10.1101/2022.03.18.484474; this version posted March 19, 2022. The copyright holder for this preprint
(which was not certified by peer review) is the author/funder, who has granted bioRxiv a license to display the preprint in perpetuity. It is made
 available under aCC-BY-NC-ND 4.0 International license.

 Spearman correlation of 0.69 (Fig. 6c). Finally, we assessed how well we could predict the

 observations of an MPRA testing the effect of 3,000 highly conserved 3′-UTR segments on RNA

 stability. We achieved a Spearman correlation of 0.63 between our model predictions and

 experiment (Fig. 6d), suggesting that our model is able to integrate the causal relationship

 between RNA sequence and RNA stability.

 Figure 6. Concordance of Saluki predictions and functional data from massively parallel reporter
 assays.
 a) Effect of mutation on RNA stability, as measured by an MPRA [86], for tiles along the CXCL2 3′ UTR
 separated by 8-nt intervals. Also shown are variant effect predictions from Saluki (smoothed along a local
 8-nt window) for the same region, and vertebrate base conservation as measured by PhyloP [89].
 Predicted AREs are boxed in red, and novel elements detected by the MPRA are boxed in orange. b)
 Saturation mutagenesis of a segment of the CXCL2 3′ UTR, boxed in purple in part (a). Shown are the
 observed variant effects (top) and Saluki’s predicted variant effects (bottom). The reference sequence is
 shown for each, in which the nucleotide height is scaled according to the mean observed or predicted
 effect for that position. c) Scatter plot of the observed and predicted variant effects shown in panel (b). d)
 Scatter plot of the observed and predicted 3′-UTR effects for each of 3,000 conserved 3′ UTRs profiled by
 fastUTR [86]. e) Scatter plot of the observed and predicted variant effects, as measured in Beas2B cells
 [87]. Also indicated are the Pearson (r) and Spearman (rho) correlation values for panels (c-e).

 28
bioRxiv preprint doi: https://doi.org/10.1101/2022.03.18.484474; this version posted March 19, 2022. The copyright holder for this preprint
(which was not certified by peer review) is the author/funder, who has granted bioRxiv a license to display the preprint in perpetuity. It is made
 available under aCC-BY-NC-ND 4.0 International license.

 To further evaluate the generality of our model, we turned to other MPRAs testing both 3′-UTR

 and variant effects in Jurkat and Beas2B cells; the elements tested were heavily enriched in

 ARE-containing regions [87]. We observed Spearman correlations of 0.42 and 0.49 between our

 model predictions and observed 3′-UTR effects in Jurkat and Beas2B cells, respectively

 (Additional file 1: Fig. S7a,b). These predictions were similar to the observed 3′-UTR effects

 between both cell types (Spearman correlation = 0.52, Additional file 1: Fig. S7c), suggesting

 that the model was about as predictive as the same MPRA experiment performed in different cell

 types. Similarly, when evaluating variant effects in both cell types, we achieved Spearman

 correlations of 0.31 and 0.36 between our model predictions and observed variant effects in

 Jurkat and Beas2B cells, respectively (Fig. 6e and Additional file 1: Fig. S7d,e). Yet again, this

 predictive performance was on par with the agreement of observed variant effects between the

 two cell types (Spearman correlation = 0.26, Additional file 1: Fig. S7f).

 As a final test for the model, we evaluated its agreement with MPRAs that measured the

 functional effect of 12,173 3′ UTRs in six cell types [88]. While the observed values agreed well

 between any pair of cell types (Spearman correlations from 0.60 to 0.83), our predictions agreed

 a bit more modestly (Spearman correlations from 0.26 to 0.50, Additional file 1: Fig. S7f),

 suggesting that they partially captured the causal factors linking RNA sequence to stability in

 this dataset.

 DISCUSSION

 Since the emergence of the first transcriptome-wide measurements, there have been numerous

 efforts to understand the sequence-encoded determinants of mRNA half-life [6–8,38–40,90,91].

 29
You can also read