Temporal changes in DNA methylation and RNA expression in a small song bird: within- and between-tissue comparisons
←
→
Page content transcription
If your browser does not render page correctly, please read the page content below
Lindner et al. BMC Genomics      (2021) 22:36
https://doi.org/10.1186/s12864-020-07329-9

 RESEARCH ARTICLE                                                                                                                                   Open Access

Temporal changes in DNA methylation and
RNA expression in a small song bird:
within- and between-tissue comparisons
Melanie Lindner1,2*† , Irene Verhagen1,3†, Heidi M. Viitaniemi4,5,6, Veronika N. Laine1,7, Marcel E. Visser1,2,
Arild Husby4,8,9 and Kees van Oers1*

  Abstract
  Background: DNA methylation is likely a key mechanism regulating changes in gene transcription in traits that
  show temporal fluctuations in response to environmental conditions. To understand the transcriptional role of DNA
  methylation we need simultaneous within-individual assessment of methylation changes and gene expression
  changes over time. Within-individual repeated sampling of tissues, which are essential for trait expression is,
  however, unfeasible (e.g. specific brain regions, liver and ovary for reproductive timing). Here, we explore to what
  extend between-individual changes in DNA methylation in a tissue accessible for repeated sampling (red blood
  cells (RBCs)) reflect such patterns in a tissue unavailable for repeated sampling (liver) and how these DNA
  methylation patterns are associated with gene expression in such inaccessible tissues (hypothalamus, ovary and
  liver). For this, 18 great tit (Parus major) females were sacrificed at three time points (n = 6 per time point)
  throughout the pre-laying and egg-laying period and their blood, hypothalamus, ovary and liver were sampled.
  Results: We simultaneously assessed DNA methylation changes (via reduced representation bisulfite sequencing)
  and changes in gene expression (via RNA-seq and qPCR) over time. In general, we found a positive correlation
  between changes in CpG site methylation in RBCs and liver across timepoints. For CpG sites in close proximity to
  the transcription start site, an increase in RBC methylation over time was associated with a decrease in the
  expression of the associated gene in the ovary. In contrast, no such association with gene expression was found for
  CpG site methylation within the gene body or the 10 kb up- and downstream regions adjacent to the gene body.
  Conclusion: Temporal changes in DNA methylation are largely tissue-general, indicating that changes in RBC
  methylation can reflect changes in DNA methylation in other, often less accessible, tissues such as the liver in our
  case. However, associations between temporal changes in DNA methylation with changes in gene expression are
  mostly tissue- and genomic location-dependent. The observation that temporal changes in DNA methylation within
  RBCs can relate to changes in gene expression in less accessible tissues is important for a better understanding of
  how environmental conditions shape traits that temporally change in expression in wild populations.
  Keywords: DNA methylation, RNA expression, Tissue-specific and tissue-general temporal changes, Accessible and
  inaccessible tissues, Great tit

* Correspondence: m.lindner@nioo.knaw.nl; k.vanoers@nioo.knaw.nl
†
 Melanie Lindner and Irene Verhagen contributed equally to this work.
1
 Department of Animal Ecology, Netherlands Institute of Ecology
(NIOO-KNAW), P.O. Box 50, Wageningen 6700, AB, The Netherlands
Full list of author information is available at the end of the article

                                        © The Author(s). 2021 Open Access This article is licensed under a Creative Commons Attribution 4.0 International License,
                                        which permits use, sharing, adaptation, distribution and reproduction in any medium or format, as long as you give
                                        appropriate credit to the original author(s) and the source, provide a link to the Creative Commons licence, and indicate if
                                        changes were made. The images or other third party material in this article are included in the article's Creative Commons
                                        licence, unless indicated otherwise in a credit line to the material. If material is not included in the article's Creative Commons
                                        licence and your intended use is not permitted by statutory regulation or exceeds the permitted use, you will need to obtain
                                        permission directly from the copyright holder. To view a copy of this licence, visit http://creativecommons.org/licenses/by/4.0/.
                                        The Creative Commons Public Domain Dedication waiver (http://creativecommons.org/publicdomain/zero/1.0/) applies to the
                                        data made available in this article, unless otherwise stated in a credit line to the data.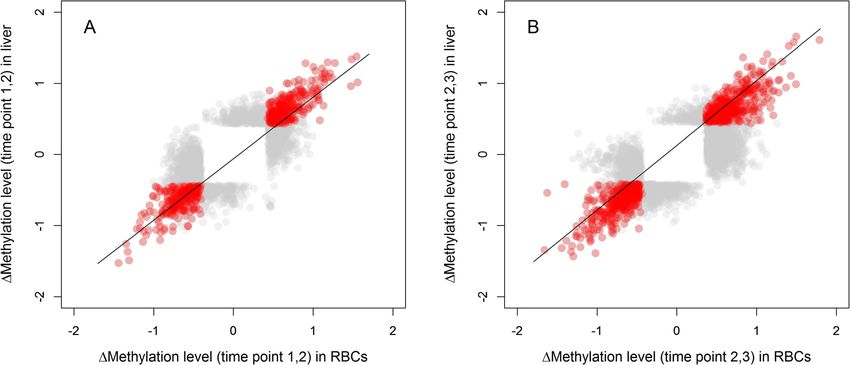
Lindner et al. BMC Genomics   (2021) 22:36                                                                      Page 2 of 16

Background                                                     amount of avian blood (< 10 μl) is required to isolate suf-
Many traits are phenotypically plastic and change with         ficient genomic DNA (~ 1 μg) to determine genome-
alterations in the environment. This includes circannual       wide DNA methylation profiles via reduced representa-
traits such as seasonal reproduction in birds: every           tion bisulfite sequencing (RRBS) [16, 17]. The availability
spring a seasonally breeding female responds to increas-       of such a tissue for repeated sampling opens up the pos-
ing photoperiod and temperature to gradually switch            sibility to examine within-individual short-term changes
from an inactive state to an active reproductive state         in DNA methylation. Indeed, repeated blood sampling of
such that the specific timing of this response depends on      great tit (Parus major) females revealed within-
the environmental conditions of the respective year (i.e.      individual changes in RBC methylation levels throughout
the trait is phenotypically plastic) [1]. However, it re-      the breeding season that correlated with a female’s re-
mains poorly understood how the translation of environ-        productive timing [6, 18]. It is, however, unclear to what
mental conditions to a within-individual temporal              extent RBC methylation is representative for methylation
response in trait value is mediated on the molecular           in (inaccessible) organs. For many phenotypically plastic
level, i.e. how phenotypic plasticity works.                   traits, relevant genes are not expressed in blood, but in
   Epigenetic modifications, like DNA methylation, are         more specific tissues. For example, avian timing of
known to be able to modulate the expression of pheno-          breeding requires crucial physiological processes like
types via an interaction with transcription factors that       oviduct development, follicle growth, vitellogenesis and
are required for the initiation of gene transcription [2].     yolk deposition [19]. These processes are regulated by a
DNA methylation can be highly dynamic in response to           neuroendocrine cascade, the hypothalamic-pituitary-
environmental signals [3–6] and hence is a candidate for       gonadal-liver axis, which is triggered by environmental
the regulation of transcriptional mechanisms that shape        information that is received, translated and transduced
temporally expressed traits [7]. Indeed, changes in DNA        from the brain [19]. Understanding how transcriptional
methylation were found as a common factor for aging in         mechanisms in tissues such as hypothalamus, ovary, and
mammals with a striking tissue-specificity for age related     liver that underlie the hypothalamic-pituitary-gonadal-
DNA methylation changes [8, 9]. In line with this, DNA         liver axis are regulated throughout the breeding season
methylation regulator genes responded tissue-specifically      would give new insights on how females time their
to acute and chronic stress in chicken (Gallus gallus)         breeding. However, repeated sampling in such inaccess-
and hepatic glucocorticoid receptors (GRs) were found          ible tissues in order to assess within-individual changes
to potentially play a critical role in regulating the early-   in DNA methylation is impossible as it requires sacri-
life nutritional stress response of birds [10]. Further-       ficing each individual. Moreover, it would prevent meas-
more, DNA methylation was found to regulate season-            uring the final trait value, which is the case for timing of
ally expressed traits like hibernation of 13-lined ground      breeding where the period of interest starts well ahead
squirrels (Ictidomys tridecemlineatus) [11], photoperi-        of the initiation of egg laying.
odic diapause timing in a parasitoid insect (Nasonia              Previously, strong correlations have been found be-
vitripennis) [12], flowering time in plants [13, 14], and      tween absolute RBC methylation levels and absolute
timing of reproduction in Siberian hamsters (Phodopus          methylation levels in liver, kidney and brain [20, 21].
sungorus) [5]. The latter study demonstrated that short        Therefore, DNA methylation in blood is proposed to be
day length induced a temporal decrease in DNA methy-           a biomarker for DNA methylation in other tissues. How-
lation levels within the promoter region of type III deio-     ever, it is unknown to what extend changes in RBC
dinase (DIO3), a gene involved in the photoperiodic            methylation over time reflect changes in DNA methyla-
regulation of reproduction, and furthermore established        tion over the same time period in other tissues (i.e.
a causal link between reduced DIO3 promoter methyla-           tissue-general temporal changes). Here, we explore to
tion and gonadal regression via increased transcription        what extend temporal changes in DNA methylation are
of DIO3 [5].                                                   tissue-general or tissue-specific and how tissue-general
   Most studies on associations between temporal               temporal changes relate to changes in gene expression
changes in DNA methylation and trait changes are based         in the inaccessible tissues of interest. For this, we used
on between-individual samples, since it is often not feas-     18 captive great tit females that were housed under two
ible to repeatedly sample tissues of biological relevance      controlled temperature environments (three groups of
within the same individual. A more accessible tissue that      six individuals) that were sacrificed and sampled for
does allow for repeated within-individual sampling is          RBCs, liver, hypothalamus, and ovary at three time
blood. Avian blood, in contrast to mammalian blood,            points (six individuals per time point) throughout the
contains nucleated red blood cells (RBCs), hence more          pre-laying and egg-laying period. We sequenced the col-
than 90% of the DNA isolated from avian blood origi-           lected tissues to assess DNA methylation levels (RBCs,
nates from erythrocytes [15]. Therefore, only a small          liver) together with candidate gene (liver, using
Lindner et al. BMC Genomics (2021) 22:36 Page 3 of 16
individual qPCR data) and genome-wide (hypothalamus, for a PCA excluding the outlier). An exploratory analysis
ovary and liver, using RNA-seq data of pooled individ- of the RNAseq expression data is presented in [22].
uals) expression profiles. Our aim was to explore to what
extent (i) changes in DNA methylation in RBCs and liver Tissue-general and tissue-specific changes in DNA
are tissue-general or tissue specific, (ii) changes in liver methylation between red blood cells and liver
DNA methylation correlate with changes in the expres- Of the 302,647 CpG sites that were covered by both the
sion of candidate genes within liver, and (iii) changes in RBC and liver data (Additional file 8; Table S1), 2377
RBC and liver methylation reflect changes in genome- CpG sites showed a significant change in methylation
wide gene expression in a tissue-general or tissue- between time point 1 and 2 (Δ1,2) and 3934 CpG sites
specific manner in the hypothalamus, ovary and liver. changed significantly between time point 2 and 3 (Δ2,3)
Potentially, the presence of tissue-general temporal (Additional files 9 and 10; Tables S2 and S3). Methyla-
changes in DNA methylation that cause a predictable tion changes over time in RBCs showed an overall
change in gene expression in inaccessible tissues, will strong correlation with methylation changes over time
open up the possibility to monitor how environmental in liver for both Δ1,2 (r = 0.77, df = 2375, p < 0.0001,
conditions affect temporally expressed traits via repeated Fig. 1a) and for Δ2,3 (r = 0.75, df = 3932, p < 0.0001, Fig.
blood sampling, even in wild populations. 1b), when including both the differentially methylated
sites (DMS) changing in a tissue-specific way (i.e. only in
RBCs or in liver) and DMS changing in a tissue-general
Results way (i.e. in both RBCs and in liver).
Exploration of Reduced Representation Bisulfite Out of the 302,647 CpG sites covered by both the
Sequencing (RRBS) and RNAseq data sets RBC and liver data, 108,298 were situated within pro-
Using hierarchical clustering and principal component moter regions (2000 bp upstream – 200 bp downstream
analysis (PCA) on methylation information from both of the annotated gene start). Of these, 221 CpGs were
RBC and liver, samples clustered strongly by tissue differentially methylated in at least one of these tissues
(Additional files 1 and 2; Figs. S1 and S2). Within the re- for Δ1,2 and 457 CpG sites for Δ2,3. The temporal change
spective tissue, samples did not cluster by temperature in methylation of these CpGs in RBCs, was strongly cor-
environment or by sampling time point, but some sam- related with the temporal change in methylation in liver
ples clustered by family (Additional files 3, 4, 5 and 6; for both Δ1,2 (r = 0.74, n = 219, p < 0.0001, Fig. 2a) and
Figs. S3-S6). We detected one outlier within the RBC Δ2,3 (r = 0.70, df = 455, p < 0.0001, Fig. 2b), when includ-
samples that remained in the analysis (Additional files 3 ing DMS that changed in a tissue-specific manner with
and 5; Figs. S3 and S5 but see Additional file 7; Fig. S7 DMS that changed in a tissue-general manner.
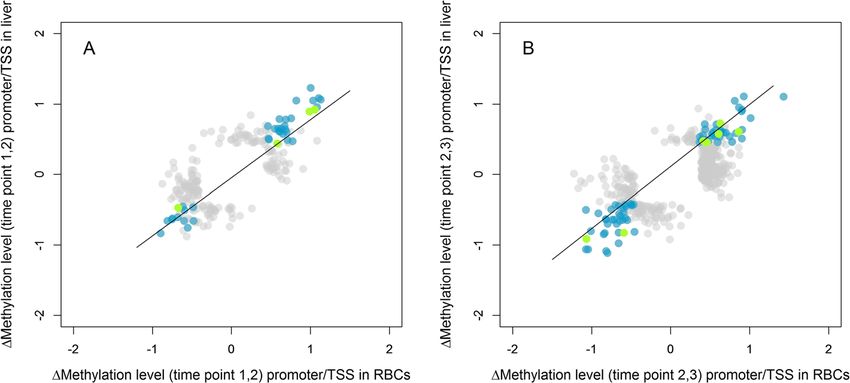
Fig. 1 Correlation between CpG sites in RBCs and liver data that show a significant change in methylation for Δ1,2 (a) and Δ2,3 (b). Methylation
change is visualized as the normalized change (z-scores). We depict sites that significantly change in methylation in both tissues (tissue-general
change) in red (n = 537 for Δ1,2 and 853 for Δ2,3) or in one of the tissues (tissue-specific change) in grey (n = 1840 for Δ1,2 and 3081 for Δ2,3). We
applied transparency because of the high number of overlapping data points. Line is the regression lineLindner et al. BMC Genomics (2021) 22:36 Page 4 of 16
Fig. 2 Correlation between the change in methylation of CpG sites in promoter and TSS regions in RBC data with the change in methylation
of those in liver data that showed a significant change in methylation for Δ1,2 (a) and Δ2,3 (b). Methylation changes are visualized as normalized
changes (z-scores). Sites that change significantly in methylation in both tissues (tissue-general change) in promoter and TSS regions are shown
in blue (n = 38 for Δ1,2 and 77 for Δ2,3) and green (n = 4 for Δ1,2 and 7 for Δ2,3), respectively. Sites that change significantly in methylation in one
of the tissues (tissue-specific change), independent of gene region, are shown in grey (n = 287 for Δ1,2 and 606 for Δ2,3). We applied transparency
because of the high number of overlapping data points. Line is the regression line
When focusing on the 41,591 CpG sites that were situ- specific manner, respectively (Additional file 13; Table
ated near the transcription start site (TSS region, 300 bp S6). These include four significant GO terms; ‘JAK-
upstream – 50 bp downstream of the annotated gene STAT signaling pathway’, ‘synaptic vesicle cycle’, ‘carbo-
start site) of a gene and covered by both the RBC and hydrate digestion and absorption’ and ‘spinocerebellar
liver data, 24 CpG sites showed a significant change over ataxia’ (Additional file 13; Table S6). Although some of
time for Δ1,2 and 65 sites for Δ2,3 in at least one tissue. the identified GO terms such as ‘positive regulation of
Also, when focusing on DMS in the TSS region, the hormone secretion’ and ‘positive regulation of peptide
change in methylation in RBCs showed a strong correl- hormone secretion’ potentially have a role in timing of
ation with the change in methylation of these same sites breeding, overall the GO and KEGG terms related to a
in liver for both Δ1,2 (r = 0.71, df = 22 p = 0.0001, Fig. 2a) wide range of functions (Additional file 13; Table S6).
and Δ2,3 (r = 0.62, n = 63, p < 0.0001, Fig. 2b), when com- Performing GO analyses on sets of genes where DMS
bining DMS that changed in a tissue-specific manner were located in the TSS region did not result in any sig-
with DMS that changed in a tissue-general manner. nificantly enriched GO or KEGG terms.
Overall, the number of DMS detected in RBCs was
higher compared to the number detected in liver. Also, Correlation between change in methylation and
the number of DMS detected between time points two candidate gene expression in liver
and three (Δ2,3) was higher compared to Δ1,2 (Add- For the candidate genes, the number of CpG sites with
itional file 11; Table S4). ≥10x coverage ranged between 3 and 15 in the TSS re-
gion (n = 5) and 6–54 per gene in promoter regions (n =
Gene ontology analyses In total 3350 unique great tit 7, Additional file 14; Table S7). No significant correla-
genes (Additional file 12; Table S5) were covered when tions were found between the change in DNA methyla-
including all DMS (those that changed in a tissue- tion over time in CpG sites within a candidate gene and
specific and a tissue-general manner) that were situated the change in RNA gene expression over time (for both
in the gene body, 10 kb up- and the 10 kb downstream Δ1,2 and Δ2,3). This was true, when taking into account
region (Fig. 1), promoter region or the TSS region (Fig. those CpG sites that were situated within regions known
2). When including only DMS that changed in a tissue- to associate with gene expression in the great tit: in TSS
general manner (in both RBC and in liver), 1153 unique regions or within promoter regions (Additional file 15;
great tit genes were covered (Additional file 12; Table Table S8, Additional files 16, 17, 18 and 19; Figs. S8-
S5), whereas DMS that changed in only one tissue, cov- S11).
ered 2352 unique great tit genes for RBCs and 1408 for
liver (Additional file 12; Table S5). Using the human Genome-wide associations between changes in
gene ontology (GO) database, we found 16 and 28 sig- methylation and gene expression
nificant GO terms associated with the genes related to To assess the association between changes in methyla-
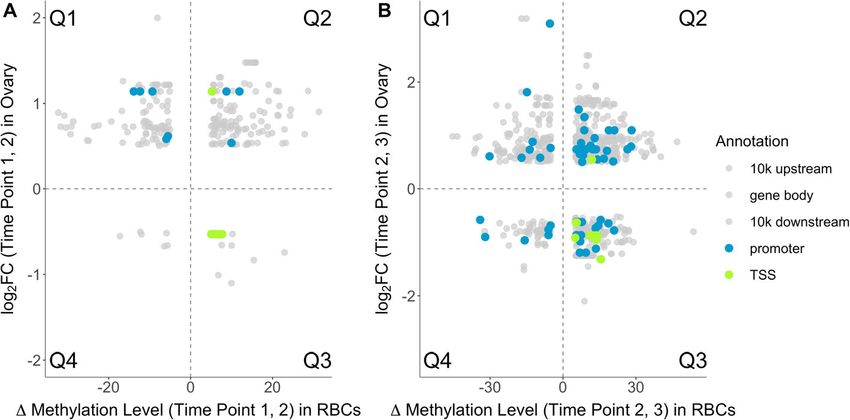
DMS that change in a tissue-general manner and tissue tion and changes in gene expression, we analyzed 297,Lindner et al. BMC Genomics (2021) 22:36 Page 5 of 16 916 CpG sites that were covered by the RBC data and expected quadrants (Q1 and Q3) when comparing (a) 529,717 CpG sites that were covered by the liver data. the change in liver methylation to the change in liver We identified 2256 CpG sites present in the RBC data gene expression, (b) the change in RBC methylation re- (Additional file 21; Table S10) and 243 CpG sites in the lated to the change in liver gene expression and (d) the liver data (Additional file 20; Table S9) that significantly change in RBC methylation related to the change in varied in their methylation levels across all time points hypothalamus gene expression (Additional files 25, 26, (i.e. not any particular comparison between time-points). 27, 28, 29, 30, 31 and 32; Figs. S12-S19), although the Based on the differential gene expression analysis re- number of associations for the change in gene expres- ported in [22], the expression of 63 genes in hypothal- sion and change in CpG site methylation was limited amus (Additional file 22; Table S11), 1073 genes in (max. four associations per tissue comparison). When ovary (Additional file 23; Table S12) and 143 genes in comparing (c) the change in RBC methylation in the liver (Additional file 24; Table S13) changed significantly TSS region with changes in gene expression in ovary, as- (see ‘Methods’ for details) across the time points (n = 2 sociations in Q1 or Q3 were overrepresented between pools per time point with n = 3 females per pool). We time point 2 and 3 when compared to associations then analyzed how changes in methylation were associ- within the 10 kb downstream region, where we did not ated to changes in gene expression for different tissue expect this effect a priori (Fisher’s Exact Test: p = 0.001, comparisons, namely (a) how changes in liver methyla- Fig. 3b). We found a non-significant trend in the same tion related to the change in liver gene expression, and direction for the change between time point 1 and 2 how changes in RBC methylation related to gene expres- (Fisher’s Exact Test: p = 0.11, Fig. 3a). The genes, the sion change in (b) liver, (c) ovary, and (d) hypothalamus number of associated CpG sites, and the number of as- (Additional files 25, 26, 27, 28, 29, 30, 31 and 32; Figs. sociations within quadrants Q1 or Q3 and within quad- S12-S19 for all tissue comparisons). Associations be- rants Q2 or Q4 are listed for each combination of tween a change in gene expression and a change in CpG comparison (a-d), time contrast (Δ1,2 and Δ2,3) and gen- site methylation within the gene body, 10 kb up-or omic location in Additional files 33, 34, 35, 36, 37, 38, downstream region, and promoter region were randomly 39 and 40; Tables S14-S21. distributed across all four quadrants (Q1-Q4, see ‘Methods’ for details) without an enrichment for the Discussion quadrants with the expected negative relationship be- Evidence that blood-derived measurements of DNA tween methylation change and gene expression change methylation can function as a proxy for DNA methyla- (i.e. Q1 and Q3, Fig. 3 and Additional files 25, 26, 27, 28, tion values in other tissues is growing [20, 21]. It is un- 29, 30, 31 and 32; Figs. S12-S19) irrespective of the tis- clear though, whether this can be generalized to the sue comparison (a-d). In contrast, associations within context of temporal changes in methylation [23]. Espe- the TSS region were exclusively located within the cially in an ecological context, it is currently unknown to Fig. 3 Log2 foldchange (log2 FC) for the expression of genes in ovary in relation to change in methylation level of a CpG site in RBCs within the TSS region (green), promoter region (blue) or 10 kb up- and downstream region and gene body (all grey) of that gene for Δ1,2 (a) and Δ2,3 (b). See Additional files 37 and 38; Tables S18 and S19 for the number of sites and genes for Δ1,2 (a) and Δ2,3 (b), respectively. The four quadrants (see ‘Methods’) are separated by dotted lines and labeled as ‘Q1-Q4’. Transparency is applied to the grey data points such that the area of overlap between plots appears darker
Lindner et al. BMC Genomics   (2021) 22:36                                                                     Page 6 of 16

what extent temporal changes in DNA methylation are           tissues-specific changes in methylation, remains to be
established in a tissue-general or tissue-specific manner     established.
and to what extent possible tissue-general changes in            The other two groups are DMS showing a tissue-
DNA methylation are associated with changes in gene           general change (Figs. 1 and 2) that correlates with a
expression in various tissues. Here, we explored whether      change in gene expression in (3) a tissue-specific or (4) a
DNA methylation changes over time were tissue-specific        tissue-general manner. Both groups can potentially be
or tissue-general (based on change in methylation in          used as biomarkers for temporally expressed traits, be-
RBCs and liver) and how changes in DNA methylation            cause they change in a similar way across tissues (or at
were associated with changes in gene expression of some       least here, in RBCs and liver) and extrapolation from
target tissues unavailable for repeated sampling (hypo-       one tissue to other tissues may be possible. Both groups
thalamus, ovary and liver). We found that methylation         open up the potential for RBC methylation to be pre-
changes in DMS covered by RBC and liver data acted in         dictive of gene expression changes in other tissues to
parallel. This was true for sites that were situated          some extent. However, the universality of this link re-
throughout the whole genome and for sites within re-          mains to be established. DMS within group 4 could be
gions of the genome where we expect an association be-        mediated by a general increase in body-wide DNA meth-
tween methylation changes and changes in gene                 yltransferase activity, catalysing DNA methylation and
expression, i.e. within the promoter or TSS region of an-     preserving methylation after cell division in a tissue-
notated genes [24]. For a set of seven candidate genes        general manner. DMS within group 3 could, for ex-
related to timing of reproduction, we found no correl-        ample, be mediated by an environmentally caused re-
ation between the change in DNA methylation in liver          lease of hormones with system-wide effects, which may
data and the change in gene expression in liver tissue        have common effects on DNA methylation across tis-
over time. Genome-wide, we found an expected TSS              sues, but that differ in magnitude [31]. An example of
region-specific correlation between an increase in CpG        such a common effect is the activation of the gluco-
site methylation and a decrease in expression of the as-      corticoid receptor (GR) gene. When stress activates the
sociated gene in the ovary. As expected, we found no          hypothalamic-pituitary-adrenal axis, cortisol is globally
such association between changes in DNA methylation           increased. Although GR binding sites show tissue-
and expression changes of the respective gene when the        specificity, their activation is shown across tissues [32].
site was situated in the gene body or in the 10 kb up- or     As such, activation of GR may lead to epigenetic changes
10 kb downstream regions, irrespective of which tissues       across tissues, as shown in both humans and rodents
were compared.                                                [33, 34]. In line with our findings, we hypothesize that
   Here, we suggest and discuss four possible groups of       DMS within the TSS region that are hypomethylated in
DMS that categorize how DNA methylation changes               RBCs could be hypomethylated in a tissue-general man-
over time can differ across tissues and how these             ner, but are likely only functional (causing gene expres-
changes are associated to differences in changes in gene      sion changes) in the ovary, where the tissue-specific
expression across tissues. The first two groups contain       process is performed and inactivated by regulatory
DMS showing a tissue-specific change in DNA methyla-          mechanisms other than DNA methylation in RBCs
tion that correlates with a change in gene expression in      where the process is not expressed [35–37]. Here, we
(1) a tissue-specific or (2) tissue-general manner. These     hypothesize about a link between tissue-general changes
groups cannot be used as biomarkers for temporally            in DNA methylation and tissue-specific changes in gene
expressed traits, because of their tissue-specific change     expression, but our experimental set-up does not allow
in methylation and/or gene expression. Although there         for strong conclusions and more targeted experiments
is a growing body of studies investigating tissue-specific    are needed to follow up on this hypothesis.
methylation, these studies are mostly in relation to aging       Further, it is important to realize that certain tissues,
and diseases [25–28]. Further, these studies often do not     like the brain, liver and ovary, play key roles in traits
elucidate the mechanism(s) by which methylation               such as timing of breeding and stress responsiveness,
changes and variation in methylation changes across tis-      and could have very specific signalling pathways,
sues are induced or the functional consequence. It is         whereas others are common across tissues [31]. Add-
likely that the (de)methylation mechanism underlying          itionally, in complex tissues, epigenetic mechanisms also
these tissue-specific changes are also tissue-specific.       differ according to tissue regions, sub-tissue regions, and
There is some evidence that methylation patterns in tis-      cell types, as shown previously in human brain [29, 38].
sues are more similar when these tissues are derived          Thus, even though methylation changes in RBCs could
from, for example, the same germ layer [29] and that the      potentially predict a part of the methylation change in
rate of cell division contributes to tissue-specific methy-   other tissues, results from epigenetic studies in periph-
lation profiles [30]. However, whether this relates to        eral blood have to be interpreted with great care with
Lindner et al. BMC Genomics   (2021) 22:36                                                                     Page 7 of 16

regard to their reflection of epigenetic patterns in highly   poses the question about how to define the region
heterogeneous tissues.                                        where gene transcription is initiated and where DNA
   Exploring whether genes carrying DMS that show ei-         methylation changes indeed affect gene expression.
ther a tissue-specific or tissue-general change in the dif-      We emphasize that the time points and tissues in this
ferent genomic locations are associated with certain          study were chosen in relation to timing of breeding, and
functional groups or GO terms (related to timing of           to explore its underlying molecular mechanisms else-
breeding), resulted in several GO terms related to a wide     where [6, 22, 39]. RBCs are likely to have a limited bio-
range of biological processes. However, for most of the       logical function with regard to complex traits like timing
sites that changed in methylation level in both RBC and       of breeding, since the genes directly responsible for bio-
liver and most of the sites in the TSS region, no GO          logical functions in this context are expressed in tissues
terms and pathways were found. Although a small gene          within the hypothalamic-pituitary-gonadal-liver axis,
set could result into significantly enriched GO terms         which regulates gonadal function and ultimately egg-
when they are associated to the same GO terms, the lim-       laying. Recent studies in great tits, found temporal vari-
ited number of genes with DMS in the TSS region in            ation in genome-wide DNA methylation in RBCs col-
this study did not. Also, we found no GO term clearly         lected throughout the breeding season [6] and a
pointing towards timing of breeding. However, as              correlation between changes in DNA methylation levels
humans do not reproduce seasonally these human-based          and a female’s reproductive timing [18]. The CpG sites
ontologies might not include GO terms of functional           in these studies that show a time, treatment or repro-
relevance for species that have a seasonally regulated        ductive timing-specific response in DNA methylation
reproduction.                                                 are of interest for understanding to what extent DNA
   We also investigated whether changes in RBC                methylation acts as a mechanism that translates environ-
methylation correlate with individual gene or genome-         mental signals into a phenotypic response, e.g. timing of
wide gene expression changes in other tissues. We             breeding. However, whether changes in RBC methyla-
found no correlations between the change in CpG site          tion reflect changes in other tissues and how these
methylation and the change in RNA expression be-              changes are reflected in gene expression changes in vari-
tween time points for a set of candidate genes. The           ous tissues is not clear. Regardless of the overall strong
genes we analysed, irrespective of whether they were          correlation between methylation change in RBCs and
used as a reference gene (PRCKA, RPL19, SDHA) or              liver needs to be interpreted carefully as this does not
gene of interest (HSPB1, GR, MR) were expressed               imply that RBC derived methylation can always be used
very stably over time [39]. As such, it might not be          as a proxy for methylation patterns in other tissues. This
surprising to not find a correlation between the              is, because DMS underlying this association include both
change in methylation and expression for these spe-           DMS that change in a tissue-specific and DMS that
cific genes. Previous studies in great tits have shown        change in a tissue-general manner (Fig. 1), indicating
a negative association between TSS region methyla-            that both common and unique epigenetic alterations
tion in RBCs and associated gene expression in the            within tissues likely reflect differential functions. Despite
brain [21, 24] and found that hypomethylation of              the fact that many DMS are tissue-specific and cannot
CpG sites in the TSS region, which is associated with         be used as biomarkers for methylation change in other
increased expression, is enriched in genes with func-         tissues, there is a potential for methylation patterns in
tional classes that relate directly to processes specific     RBCs to be informative for a proportion of the temporal
to the tissue type [21]. Genome-wide, we find a simi-         changes in methylation patterns in liver.
lar trend, in which CpG site hypermethylation within             Although we sampled tissues from individuals at three
the TSS region in RBCs was predominantly associated           different time points, these are not within-individual re-
with a decrease in the expression of the respective           peated measures as opposed to another study in the
gene, most pronouncedly for the ovary. As expected,           same birds using repeated RBC sampling [6]. It is impos-
no specific trend was found in the 10 kb up- and              sible to repeatedly sample tissues like the brain or ovary,
10bk downstream region and the gene body, which               and it is highly challenging or even impossible for liver.
confirms the lack of association between DNA methy-           Here, we thus used a between-individual approach as a
lation and gene expression for these regions [24]. In         proxy of within-individual sampling and acknowledge
contrast to other studies [21, 24, 40], we did not find       that we cannot separate between- and within-individual
a negative correlation between absolute levels of pro-        effects. In great tits, however, CpG site methylation in
moter DNA methylation and gene expression, but we             RBCs changes throughout the breeding season within in-
have to emphasize here that these studies did not in-         dividuals [6] and here we find that DNA methylation
vestigate the relationship between the change in DNA          changes throughout this period in RBCs and liver based
methylation and the change in gene expression. This           on between-individual samples in a similar way. As such,
Lindner et al. BMC Genomics   (2021) 22:36                                                                     Page 8 of 16

the time effect on DNA methylation throughout this            tissues only, but may be general throughout the body for
period seems strong enough to be detected albeit pos-         a large proportion of sites and likely have a genetic basis
sible between-individual effects resulting from using         [41]. However, the vast majority of changes in DNA
samples of different individuals at each sampling time.       methylation were not associated with gene expression
   Unfortunately, we were not able to look at the associa-    changes in target tissues in a predictable way. Predict-
tions between gene expression and methylation changes         able changes were only present for sites in the TSS re-
in other candidate genes [36] that have been shown to         gion, albeit supported by a few data points only. This
be key in reproductive functioning, as CpG sites within       shows that general patterns of DNA methylation in any
those genes did not have ≥10x coverage for all samples        tissue cannot be taken as predictive values for gene ex-
in the RRBS data. Similarly, a limited number of sites        pression changes in other tissues and the effects of
was available for the correlation analyses between CpG        methylation changes are likely very targeted. Neverthe-
site methylation and gene expression in a genome-wide         less, this study provides insights into temporal changes
approach, especially for CpG site within the TSS regions,     in methylation across tissues and how these changes re-
as these only span 350pb. Further, the RRBS data was          late to changes in gene expression. This highlights the
based on individuals, whereas the RNA-seq data origi-         importance for distinguishing between tissue-specific
nated from pooled samples [22]. The number of pools           and tissue-general changes in DNA methylation, as the
for the early selection line used in the current study was    latter can be informative for changes in DNA methyla-
limited (n = 6), and hence, we used genes identified as       tion in inaccessible tissues and possibly changes in gene
differently expressed over time (i.e. genes with a time ef-   expression. As such, a better understanding of these
fect and no line effect) in hypothalamus, ovary and liver     tissue-general patterns opens up the possibility to moni-
from the study that used individuals from both selection      tor the effect of environmental conditions on temporally
lines [22]. We calculated the change in methylation level     plastic traits via repeated blood sampling, even in wild
based on samples of individuals and the log2Fold-change       populations.
in gene expression level based on pooled samples. As de-
scribed in [22], most differentially expressed genes over     Methods
time were found in the ovary, while numbers of differen-      Sample origin
tially expressed genes were lower in hypothalamus and         The 18 females used in this study were part of a larger
liver. As such, we only had enough data points to test        study. For a detailed description of the experimental
for an association between the change in RBC methyla-         setup and sampling of that larger study see [39]. In
tion and change in gene expression in the ovary. For the      short, 36 great tit pairs (18 early selection line pairs and
other tissue comparisons (especially liver-liver, RBCs-       18 late selection line pairs in their second calendar year)
liver, and RBCs-hypothalamus) there were too few data         that constitute the F2-generation of lines artificially se-
points (0–4 CpG sites) in the TSS region in comparison        lected for early and late timing of breeding [42, 43], were
to the other genomic locations (gene body, 10 kb up-          housed in 36 climate-controlled aviaries (2 m × 2 m ×
stream and downstream region) to draw any conclu-             2.25 m) at the Netherlands Institute of Ecology (NIOO-
sions. Furthermore, CpG sites in the TSS region show a        KNAW). Every climate-controlled aviary contained three
lower methylation level in general than sites within other    nest boxes, a perch, fake tree, a food and water tray and
genomic locations and even low methylation levels             bedding of wood chips. All great tits in this study decent
(about 20%) within the TSS region were associated to          from a wild long-term study population at the Hoge
downregulation of the associated gene which was not           Veluwe National Park, The Netherlands (52°02′07″ N,
found for sites within other genomic locations [24].          5°51′32″ E). Per selection line, pairs were formed ran-
Thus, analysing sites within the TSS region for differen-     domly, but avoiding sibling pairings. Birds were sub-
tial methylation, together with sites in the other genomic    jected to a photoperiod mimicking the natural
locations might cause a biological relevant change in         photoperiod and two contrasting temperature environ-
methylation within the TSS region to appear statistically     ments mimicking a cold spring (2013) and a warm
insignificant based on the high number of tests per-          spring (2014) in the Netherlands. Temperatures changed
formed with sites in genomic locations that show              every hour to follow as closely as possible the observed
changes in higher magnitudes.                                 hourly temperatures in these years. The combination of
                                                              selection line and temperature environment resulted in
Conclusions                                                   four groups of n = 9 pairs within each group: ‘early-
In general, we found that temporal changes in DNA             warm’, ‘early-cold’, ‘late-warm’ and ‘late-cold’. Within se-
methylation correlate well between tissues. This indi-        lection line, birds were randomly assigned to an aviary,
cates that the mechanisms underlying these DNA                but temperature environment (warm or cold) would al-
methylation changes over time do not act in the target        ternate every aviary and selection line (early or late)
Lindner et al. BMC Genomics (2021) 22:36 Page 9 of 16
every two aviaries, resulting in the order ‘early-warm’, The samples that we used in this study are from the
‘early-cold’, ‘late-warm’, and ‘late-cold’ throughout the early selection line females in the second (autumn)
36 climate-controlled aviaries. Birds were fed ad libitum breeding season (n = 18, with 6 females per sampling
with food sources reported elsewhere [44] and had water time point) because during this sampling event blood,
available for drinking and bathing. hypothalamus, ovary and liver where collected as op-
Although great tits normally only have one reproduct- posed to the first breeding event where only blood was
ive season per year, the pairs included in this larger sampled.
study were induced to undergo two reproductive seasons
[for details see 32]. In short, in the first breeding event Reduced Representation Bisulfite Sequencing (RRBS)
from January until July, individuals were blood sampled We extracted DNA from RBCs stored in 250 μl Queens
bi-weekly [6, 16], and laying dates were obtained. Then, buffer (with approximately 10–20 μl of RBCs per 1 ml)
birds went through a period of short-day length (L:D 10: using the DNeasy kit (Qiagen) and from 25 mg liver with
14) and low temperatures (10 °C) to induce gonadal re- the MagAttract kit (Qiagen) according to manufacturer’s
gression and to make them photoreceptive and protocol. To produce Reduced Representation Bisulfite
temperature sensitive again. Subsequently, birds received Sequencing libraries, the preparation protocol according
the same temperatures and photoperiods as in the first to manufacturer’s protocol (Illumina) was used with
breeding event to induce a second breeding event that some changes [46]. Briefly, samples were digested using
was initiated in autumn (September until November). the restriction enzyme MspI and the resulting DNA
The 36 pairs were divided into three groups taking into fragments of various size were subsequently bisulfite
account the females’ laying dates in the first breeding treated, which converts un-methylated cytosine bases
season [39], and sacrificed at three time points through- into uracil bases, whereas methylated cytosine bases are
out this second breeding event (see below). resistant to the treatment. Fragmented and bi-sulfite
treated DNA was then end-repaired with DNA polymer-
Tissue collection and preparation ase I and A-overhangs were added to the 3′ ends of each
Based on the reproductive behavior during the first fragment for adapter ligation. Individual sample libraries
breeding event, three sampling time points throughout were barcoded using standard Illumina adapters. Librar-
the second breeding season were chosen: (1) October 7 ies were purified, size selected with Ampure XP beads
(resembling March 7) when photoperiod exceeded 11 h, (Beckman Coulter) and concentrations were determined
which is necessary to initiate gonadal maturation [45], by quantitative polymerase chain reaction (qPCR). This
(2) October 28 (resembling March 30) when nest build- selection yielded a fragment size range of approximately
ing occurred in the first breeding season, but prior to 30–180 base pairs, with a mean of 85. Six libraries were
laying and (3) November 18 (resembling April 20) when pooled into the same sequencing lane (Additional file 41;
25% of the females had initiated egg laying in the first Table S22). Each pool was sequenced 100 bp single end
breeding event. Per time point both sexes of one group (Additional file 41; Table S22) on a HiSeq2500 sequen-
(n = 12 pairs) were sacrificed, although we focus on fe- cer with a HiSeq SBS sequencing kit version 4 (Illu-
males only in the current study [39]. To sample birds, mina). Sequencing was conducted in two separate HiSeq
they were caught per pair from their aviary between 9: runs to yield enough coverage per sample. An internal
00 AM and 13:15 PM, taken to the dissection room and positive control (PhiX) was used to obtain reliable se-
weighed (body mass (g) ± s.e.m. (range), males: 18.3 ± 0.2 quence generation in the sequencing processing and the
(16.3–20.5) and females: 17.03 ± 0.17 (15.0–20.0)). Sub- PhiX reads and adapters were removed before data ana-
sequently, taking into account the least amount of stress lysis. Library preparation and sequencing were per-
and highest sample quality, birds were anaesthetized formed at the SciLife Lab, Uppsala University, Sweden.
deeply through inhalation of Isoflurane (vaporizer setting
2.5–3.0%), during which a blood sample (300 μl) was Sequence read quality and alignment
taken. RBCs were separated from plasma by centrifuging Sequencing read quality was investigated with the
(10 min at 14,000 rpm) and stored in Queens buffer at FastQC 0.11.7 quality control tool [47]. Low quality
room temperature before further analysis (see ‘Reduced bases as well as Illumina adapter contamination resulting
representation bisulfite sequencing (RRBS)’ below). Fol- from read-through of short fragments were trimmed
lowing decapitation, tissues, including brain, ovary and using Trim Galore! v0.4.4 [48] with default parameters
liver were dissected and stored in − 80 °C until further under the –rrbs mode. This mode disregards the first
processing. At a later stage, the hypothalamus, being the five base pairs in the 5′ to reduce calling of false positive
center for integration, transduction and translation of methylation as a result of bisulfite treatment. Each sam-
environmental cues, was isolated from the rest of the ple’s reads from both of the sequencing runs were com-
brain and, until further processing, stored in − 80 °C. bined together for alignment. Trimmed sequencingLindner et al. BMC Genomics (2021) 22:36 Page 10 of 16
reads were aligned against a bisulfite converted version associate with RNA expression [21, 24]. Hence, only
of the Parus major reference genome v1.1 (https://www. CpG sites in the TSS or promoter region of annotated
ncbi.nlm.nih.gov/assembly/GCF_001522545.2) using Bis- genes were used for exploring (i) tissue-general and
mark 0.19.1 (Bioinformatics Group. Babraham Institute) tissue-specific changes in DNA methylation between
aligner in rrbs mode. The reference genome contains all RBCs and liver and (ii) the correlation between change
assembled chromosomes as well as all scaffolds. After in methylation and candidate gene expression in liver
alignment and CpG site calling we selected the sites with (qPCR, see below) correlation. CpG sites within the TSS
a minimum coverage of 10x across all samples within a regions, promoter regions, gene body, and 10 kb up
tissue (RBCs and liver) for further analyses. We calcu- −/downstream regions were used for exploring (iii)
lated the methylation proportion for a site in the re- genome-wide associations between changes in methyla-
spective sample as the proportion of methylated counts tion and changes in gene expression in liver, hypothal-
relative to the total read counts. As we were interested amus, or ovary (Fig. 4).
in sites that change over time, we excluded all sites that
showed a methylation proportion of either zero or one RNA extraction, real-time quantitative polymerase chain
across all samples from downstream analyses. reaction and sequencing
From the same females, for which we acquired DNA
Gene annotation methylation patterns, we used already available qPCR
CpG sites were annotated, using R packages ‘Genomic- and RNA-seq data generated by two other studies [22,
Features’ [49] and ‘rtracklayer’ [50], to different genomic 39]. In short, RNA was isolated from hypothalamus,
locations: TSS region (300 bp upstream - 50 bp down- ovary and liver by Trizol extraction and reverse tran-
stream of the annotated transcription start site), pro- scribed into cDNA [39].
moter region (2000 bp upstream - 200 bp downstream of
the annotated transcription start site), gene body (exons qPCR
and introns), and 10 kb up- and downstream regions (10 In a previous study [39] primer pairs were built based
kb regions adjacent to the gene body, respectively). Each on the Parus major reference genome v1.1. and Parus
identified CpG site was assigned to one of the above spe- major annotation release 101 (https://www.ncbi.nlm.nih.
cified genomic regions (and the gene annotated to that gov/genome/annotation_euk/Parus_major/101/) for a list
region) with BEDtools v.2.26.0 [51]. See Additional file 42; of candidate genes with known and unknown functions
Table S23 for an overview on how many CpG sites were in avian reproduction and checked for specificity using a
covered per genomic location in the RBCs and liver data BLAST search. Efficiency of each primer pair was deter-
and how many genes were associated to the CpG sites mined by a 5-point standard curve of cDNA samples.
within a respective genomic region and tissue. Earlier Relative transcript levels were measured within hypo-
studies in great tits have shown that methylation levels thalamus, ovary and liver by real-time qPCR using the
surrounding the TSS and within promoter regions best SYBR Green method followed by fluorescence
Fig. 4 Overview of the data used in this study and how they were linked. Solid lines refer to associations in which only data from individual
female great tits was used, while dashed lines refer to associations in which both individual (RRBS) and pooled (RNA-seq) data was used.
Number-character combinations indicate the aims (see ‘Introduction’) of the study and the methods used (see ‘Methods’ for details)Lindner et al. BMC Genomics (2021) 22:36 Page 11 of 16
measurements and analyses to obtain cycle thresholds. calculated the change in CpG site methylation between
Expression levels of the candidate genes were normal- time points within liver and RBCs.
ized against reference genes. The combination and num- We conducted a differential methylation analysis,
ber of reference genes differ per organ and can be found using the ‘methylKit’ package [52], on the raw count data
elsewhere [39]. of 302,647 CpG sites that were common for both the
blood and liver data, in order to find DMS between time
RNA sequencing point 1 and 2 (Δ1,2), and time point 2 and 3 (Δ2,3) in ei-
In a previous study, genome-wide expression patterns ther blood or liver (tissue-specific change) or in both tis-
were measured in pools (n = 12) of three female great sues (tissue-general change) (Additional file 9; Table S2,
tits from both the early and late selection line [22]. This Additional file 10; Table S3). We considered a site sig-
resulted in four pools per time point, of which every nificantly differentially methylated when the difference
pool represented a selection line × treatment combin- in methylation between time points ≥ 15% and a q-value
ation. Since the 18 females from the current study ori- ≤0.01.
ginate from the early selection line, we used the RNA- We used the Pearson’s correlations coefficient (r) to
seq data from the pools with early selection line birds evaluate the relationship between DNA methylation in
(n = 2 pools per time point with n = 3 females per pool). blood and liver, as it measures linear trends. We re-
Briefly, libraries were prepared using the Illumina Tru- peated this for sites that were situated in the promoter
Seq strand-specific mRNA method (Illumina, San Diego, and TSS regions of genes in both RBCs and liver.
CA, USA) and one lane of Illumina HiSeq 2500 (single- Additionally, a gene ontology (GO) analysis was per-
end 50 bp) for 12 pools. Reads were filtered for low qual- formed using the genes that carried the tissue-specific
ity. Subsequently, trimmed reads were mapped to the and tissue-general changing DMS to explore which func-
Parus major reference genome v1.1, after which tran- tional groups (GO terms) are over-represented [53, 54]
scripts were assembled based on the Parus major anno- and possibly linked to timing of breeding. We divided
tation release 101. Unique reads that mapped to the gene sets from the two time point comparisons into
transcripts were counted. three groups for DMS located in the gene body, TSS re-
gion and/or promoter region. GO analysis was per-
formed using Cytoscape plugin ClueGo 2.5.7 [55]. Using
Statistical analysis kappa statistics, ClueGo constructs and compares net-
All statistics and plotting were performed using R ver- works of GO terms. A two-sided hypergeometric test
sion 3.5.2 [52]. An overview of how the different data [56] was applied, Kappa score and network specificity
sets and tissues are linked is provided in Fig. 4. were kept at default values. The GO term/pathway selec-
tion was at 5% and false discovery correction was per-
Tissue-general and tissue-specific changes in DNA formed using the Benjamini-Hochberg step-down
methylation between red blood cells and liver method [57]. We used human (11.05.2020) gene ontol-
Prior to correlating the change in methylation over time ogies and the Kyoto Encyclopedia of Genes and Ge-
between tissues, we tested whether methylation levels re- nomes (KEGG) pathway [58] with three background
quired standardization in order to meet the require- gene set lists, which were all the genes covered by fil-
ments to conduct such a correlation. For each sample tered CpG sites (15,103 genes), TSS regions covered by
we calculated the mean and variance in methylation pro- CpG sites (5731 genes) and promoter regions covered by
portion across all CpG sites within a sample and tested CpG sites (9816 genes).
for a difference in mean and variance between samples
with a Kruskal-Wallis test (p < 0.05, n = 18 for liver and Correlation between change in methylation and candidate
RBCs, respectively) and Fligner Killeen test (p < 0.05, n = gene expression in liver
18 for liver and RBCs, respectively), respectively (Add- We selected those sites both in the TSS and promoter
itional file 43; Table S24). Because samples significantly regions within genes in liver that were either key to re-
differed in mean methylation and the variance of methy- productive functioning (i.e. in relation timing of breed-
lation proportion, we corrected the methylation propor- ing) or within the reference genes (i.e. to normalize
tion of individual CpG site for both differences. This was qPCR expression data) (Additional files 44 and 45; Ta-
done by calculating z-scores; i.e. subtract the mean bles S25 and S26), and for which there was also qPCR
methylation proportion over all samples within the re- gene expression data available [33, Additional file 46;
spective tissue from the methylation proportion of each Table S27]. In order to evaluate the association between
individual CpG-site and divide this by the standard devi- DNA methylation changes and RNA expression changes
ation of the methylation proportion over all samples in the TSS region, we found CpG sites with 10x cover-
within the respective tissue. We used the z-scores to age across all samples for five from the total candidateLindner et al. BMC Genomics (2021) 22:36 Page 12 of 16
gene set analysed in liver [39]: beta-2-microglobulin including time point and temperature environment as
(B2M), glucocorticoid receptor (GR), heat shock protein fixed factors, explained the methylation profile of a site
family B (small) member 1 (HSPB1), mineralocorticoid better than the null model only including the
receptor (MR) and protein 2 kinase C alpha (PRKCA). In temperature environment as fixed effect. We considered
addition to these genes, two more genes, ribosomal pro- a time effect to be significant for sites with q-value ≤0.01
tein 19 (RPL19) and succinate dehydrogenase complex for both tissues. This likely leads to a more stringent
flavoprotein subunit A (SDHA), could be evaluated for correction for multiple testing in liver as the number of
promoter regions. Per gene, we calculated Δ1,2 and Δ2,3 sites tested was much higher than for RBCs. Differential
for both expression and methylation levels. For example, expression analysis is described in detail in [22]. In short,
from the methylation level of an individual female in main effect models for time point and selection line
time point 2, methylation levels of all females in time were tested using the standard DeSeq2 protocol [59] and
point 1 (n = 6) were subtracted. Subsequently, these six a likelihood ratio test such that the main effect models
values were used to calculate the average change in were compared to a model excluding the main effect.
methylation per female in time point 1 across all females Models were performed separately for each tissue. Genes
from time point 2, and vice versa (see Additional file 47; present in the trimmed RNA-seq data sets for liver,
Fig. S20 for a visualization). The same process was re- hypothalamus, and ovary with adjusted p < 0.05 when
peated for the expression levels. Pearson’s correlations testing the main effect model for a time point effect and
were used to evaluate relations between the average with adjusted p > 0.05 when testing the main effect
change in expression and average change in methylation model for a selection line effect (as data from both selec-
levels. P-values were adjusted for multiple comparisons tion lines were included when testing the main effect
using the Benjamini-Hochberg procedure [57]. models) based on [22], were classified as genes that sig-
nificantly changed in expression over time. Thereafter,
Genome-wide associations between change in methylation to examine the association between DNA methylation
and gene expression change and change in gene expression in tissue compari-
Here, we used RRBS data of individual females (n = 6 fe- sons a-d, we quantified the change between time point 1
males per time point) and RNA-seq data of pools of the and 2 (Δ1,2) and time point 2 and 3 (Δ2,3) for both the
same females (n = 2 pools per time point with n = 3 fe- methylation level of CpG sites and gene expression
males per pool) to relate changes in CpG site methyla- levels. We quantified the change in methylation level, by
tion to changes in expression of the associated gene. We first calculating the average methylation levels (i.e.
examined how (a) the change in liver methylation related methylation proportion × 100) per CpG site across fe-
to the change in liver gene expression and how the males for all three time points and then calculated the
change in RBC methylation related to gene expression difference between the respective time points per CpG
change in (b) liver, (c) ovary, and (d) hypothalamus (Fig. site. We quantified the change in gene expression be-
4). Four this, we used (a) 529,717 CpG sites in the liver tween time point 1 and 2 (Δ1,2), and between time point
that were located within 14,982 genes in the liver, (b) 2 and 3 (Δ2,3) separately, by calculating the log2Fold-
297,916 CpG sites in RBCs that were located within 13, change contrast using DeSeq2 [59]. We furthermore
893 genes in liver, (c) 14,708 genes in the ovary, and/or trimmed the data sets by excluding CpG sites with a
(d) 14,570 genes in the hypothalamus. To associate change in methylation level < 5% methylation (since ab-
DNA methylation changes with gene-expression solute methylation levels are lower in TSS regions) and
changes, CpG sites that showed a time-point effect were genes with a change in expression (as log2Foldchange) <
identified using a differential methylation analysis with 0.5 for any of the two time-point contrasts. To better
time-point (levels 1,2 and 3) as a fixed factor, and genes understand the effect of the genomic location on the re-
with a significant time effect were identified using a dif- lationship between changes in DNA methylation and
ferential gene expression analysis performed in [22]. gene expression, we differentiated between genomic lo-
This in contrast to the analysis of i), where we assessed cations (i.e. TSS region, promoter region, gene body and
changes for both time point 1 and 2 (Δ1,2), and time 10 kb up−/downstream region, see section ‘Gene annota-
point 2 and 3 (Δ2,3) separately. We therefore end up tion’, above). For each combination of comparison (a-d),
with different numbers of significant sites for these two time contrast (first and second) and genomic location,
analyses. we plotted the gene expression as log2Foldchange
Differential methylation analyses were performed for against the change in methylation level. There are four
529,717 CpG sites in liver and 297,916 CpG sites in possible quadrants of association between change in
RBCs using the ‘methylKit’ package [52]. To test the sig- gene expression and change in methylation level: hypo-
nificance of a time-point effect, we used a model com- methylation and increased gene expression (Q1), hyper-
parison approach to test whether the full model, methylation and increased gene expression (Q2), hyper-You can also read