Life Cycle Assessment of Waste Management in Suzhou, PR China
←
→
Page content transcription
If your browser does not render page correctly, please read the page content below
Life Cycle Assessment of Waste Management
in Suzhou, PR China

December 2020

Implemented by
Imprint

Published by:                                                           Authors:
Deutsche Gesellschaft für                                               This report has been prepared by Beijing Normal University, Beijing, PR
Internationale Zusammenarbeit (GIZ) GmbH                                China and Technical University of Denmark, Kongens Lyngby, Denmark
                                                                        in collaboration with the City of Suzhou and GIZ (Deutsche Gesellschaft
Registered offices                                                      für Internationale Zusammenarbeit), Beijing under the contract number
Bonn and Eschborn                                                       81247604.
Address (China Representative Office)
Sunflower Tower 1100, 37 Maizidian Street, Chaoyang District
100125 Beijing, PR China

Project:
China Integrated Waste Management (IWM) NAMA, this project is
supported by the NAMA Facility on behalf of the German Federal
Ministry for the Environment, Nature Conservation and Nuclear Safety
(BMU), the UK Department for Business, Energy and Industrial Strategy
(BEIS) (formerly DECC), the Danish Ministry of Energy, Utilities and    The report should be cited as:
Climate (EFKM) and the European Commission                              Zhao, Y., Chang, H.M., Damgaard, A., Bisinella, V., Christensen, T.H. (2021):
                                                                        Life cycle assessment of waste management in Suzhou, PR China. GIZ
Report management                                                       (Deutsche Gesellschaft für Internationale Zusammenarbeit), Beijing.
Dr. Liu Xiao
                                                                        Photo credits/sources:
                                                                        Cover page: https://699pic.com

                                                                        On behalf of
                                                                        NAMA Facility
                                                                        GIZ is responsible for the content of this publication.

                                                                        Beijing, PR China
                                                                        2021

        Implemented by
List of Content

Preface................................................................................................................................................................................................................1

Summary............................................................................................................................................................................................................2

中文摘要.......................................................................................................................................................................................................10

1 Introduction...........................................................................................................................................................................................17

2 LCA methodology...............................................................................................................................................................................18

       2.1 LCA goal..................................................................................................................................................................................................................................... 18

       2.2 Scope .......................................................................................................................................................................................................................................... 18

       2.3 System boundaries ............................................................................................................................................................................................................ 19

       2.4 Technological scope .......................................................................................................................................................................................................... 20

       2.5 Modelling approach............................................................................................................................................................................................................ 20

       2.6 Impact assessment (LCIA) ........................................................................................................................................................................................... 21

       2.7 Data ............................................................................................................................................................................................................................................. 23

3 Data on waste management in Suzhou..............................................................................................................................24

       3.1 Suzhou......................................................................................................................................................................................................................................... 24

       3.2 Suzhou’s waste management system...................................................................................................................................................................... 25

       3.3 Waste generation ................................................................................................................................................................................................................ 27

       3.4 Collection, transfer and transportation ................................................................................................................................................................ 29

       3.5 Bio treatment ........................................................................................................................................................................................................................ 33

       3.6 Incineration with energy recovery............................................................................................................................................................................. 38

       3.7 Landfill ...................................................................................................................................................................................................................................... 44

4. LCA modelling of the solid waste management system in Suzhou.................................................................47

       4.1 Defining the system............................................................................................................................................................................................................ 47

       4.2 Waste ......................................................................................................................................................................................................................................... 49

       4.3 Waste technologies............................................................................................................................................................................................................. 50

       4.4 Energy system ...................................................................................................................................................................................................................... 53
4.5 Scenarios ................................................................................................................................................................................................................................. 54

     4.6 Robustness assessment ................................................................................................................................................................................................. 55

     4.7 Quality controls ................................................................................................................................................................................................................... 60

5 Results of the LCA modelling of the waste management system in Suzhou............................................61

     5.1 Mixed other waste............................................................................................................................................................................................................... 61

     5.2 Food waste ............................................................................................................................................................................................................................. 63

     5.3 Results for actual amount of waste........................................................................................................................................................................ 65

     5.4 Parameter sensitivity analysis.................................................................................................................................................................................... 66

     5.5 Scenario sensitivity analysis........................................................................................................................................................................................ 68

6. Conclusions on LCA modelling of the Suzhou waste management system..................................................70

A. Appendix - LCA documentation.................................................................................................................................................72

This report has been prepared by Beijing Normal University, Beijing, PR China and Technical University of Denmark, Kongens Lyngby,
Denmark in collaboration with the City of Suzhou and GIZ (Deutsche Gesellschaft für Internationale Zusammenarbeit), Beijing under
the contract number 81247604.

The report should be cited as:
Zhao, Y., Chang, H.M., Damgaard, A., Bisinella, V., Christensen, T.H. (2021): Life cycle assessment of waste management in Suzhou,
PR China. GIZ (Deutsche Gesellschaft für Internationale Zusammenarbeit), Beijing.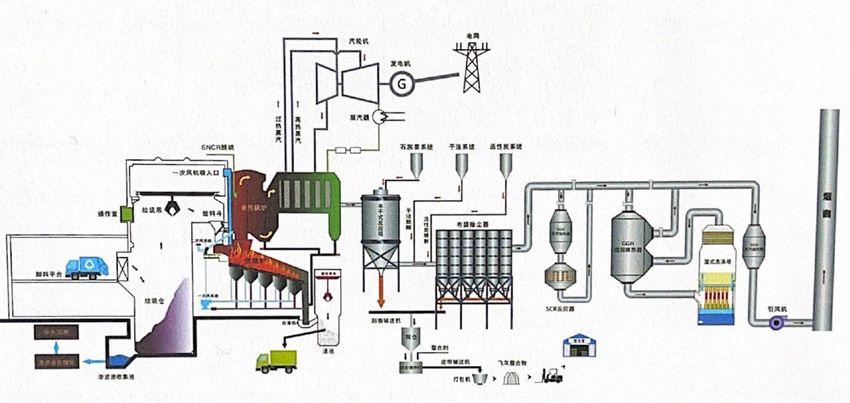
Life Cycle Assessment of Waste Management
                                                                                                                              in Suzhou, PR China

  Preface

This report summaries the life cycle assessment (LCA) of the waste management system in Suzhou, PR China. The appendix contains the
detailed documentation of the LCA-modelling.

The work was conducted between December 2019 and January 2021. The work was affected and delayed by the Coivd-19 pandemic.
However, the outcome meets high international standards for LCA-modelling of waste management systems.

The work is part of the National Appropriate Mitigation Actions (NAMA) project involving collaboration between several Chinese
authorities and GIZ.

We appreciate the hospitality and cooperation of the City of Suzhou, in particular Mr. He Sheng and Mr. Chen Weihai.

We thank the scientific staff of GIZ, Beijing for the collaboration; in particular Dr. Liu Xiao, and Mr. Qian Mingyu.

                                                                                                                                               1
Life Cycle Assessment of Waste Management
in Suzhou, PR China
Summary
This report has been prepared by Beijing Normal University, Beijing, PR China and Technical University of Denmark, Kongens Lyngby, Denmark
in collaboration with the City of Suzhou and GIZ (Deutsche Gesellschaft für Internationale Zusammenarbeit), Beijing under the GIZ contract
number 81247604. The report should be cited as: Zhao, Y., Chang, H.M., Damgaard, A., Bisinella, V., Christensen, T.H. (2021): Life cycle
assessment of waste management in Suzhou, PR China. GIZ (Deutsche Gesellschaft für Internationale Zusammenarbeit), Beijing. The report
contains 62 pages and an appendix with 60 pages.
Introduction
Solid waste management is changing rapidly these years in China, moving away from landfills and increasing treatment and recycling
of waste. Environmental considerations play a significant role in this change, but also aspects about resources, space and economy are
important. Life cycle assessment (LCA) is an established method being able to quantify the potential environmental impacts of waste
management. LCA has been used in waste management in addressing many aspects and in many countries during the last two decades.
LCA quantifies a range of impacts and identifies where environmental loads and savings take place within the waste management
system. Thus, LCA is a helpful tool in quantifying environmental progress within waste management and in assessing potential further
improvements to be considered in the future.
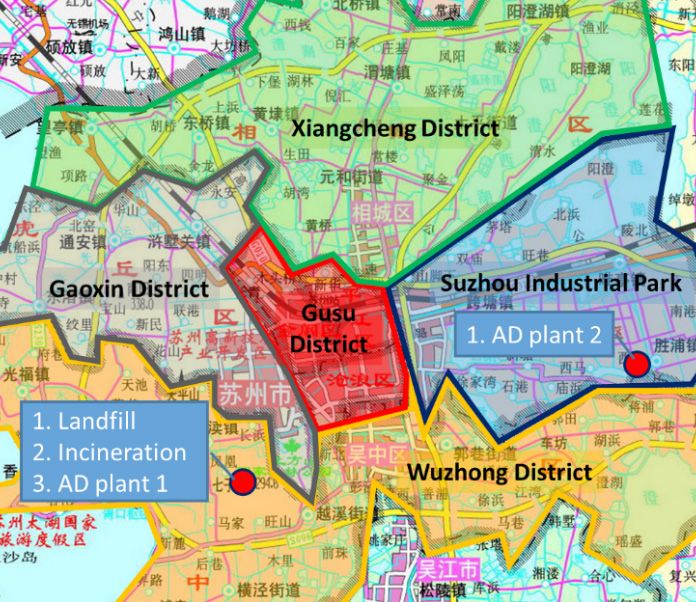
This report quantifies by stringent methods the environmental impacts of waste management in the City of Suzhou, PR China. The City
of Suzhou is located in the middle of the Yangtze River Delta in the southeast part of Jiangsu Province (longitude of 119°55′-121°20′E;
latitude of 30°47′-32°02′N). The study covers waste generated in the five districts of Suzhou City: Gusu, Gaoxin, Wuzhong, Xiangcheng
and Suzhou Industrial Park covering 4050 square kilometres and 4 230 000 people in total.
The LCA covers the period 2015-2035, divided into four time periods representing the actual development in the waste management for
the city: 2015-2017 representing the “BASELINE” (prior to the start of the China IWM NSP), 2018-2019 representing the “CURRENT”
municipal solid waste (MSW) system, 2020-2025 representing the “PLANNED” MSW system as expected within the 5-year plan.
“FUTURE” is a hypothetical future MSW system with focus on further improvement in the environmental profile of the Suzhou MSW
system, with a period of 2025-2035. These potential improvements considered in the FUTURE time period do not necessarily reflect the
views of Suzhou City nor GIZ: they have been introduced to illustrate how ideas about waste management can be assessed in a quantitative
way as part of a planning process and to illustrate how much room for improvement could be available from an environmental point of
view.
Data on the Suzhou waste management system has been collected on location to the extent possible. Existing plans have been included.
The three first time periods considered – BASELINE, CURRENT and PLANNED – thus have been modelled as closely to the actual
situation as possible, while in the FUTURE time period we have quantified the environmental impacts of further developments that
potentially could be considered without paying attention to actual capacities of existing facilities.
The LCA-modelling quantifies the flows of waste, materials and substances through the waste management system, while simultaneously
keeping an account of exchanges of materials and energy needed to operate the waste management system and of materials and energy
recovered from the waste management system. The waste management system is credited for the materials and energy exported to the
surrounding society as we assume that these exports avoid similar production in society. All flows to the environment from the waste
management system as well as from upstream and downstream activities are characterized into potential environmental impacts following
international standard methods.
2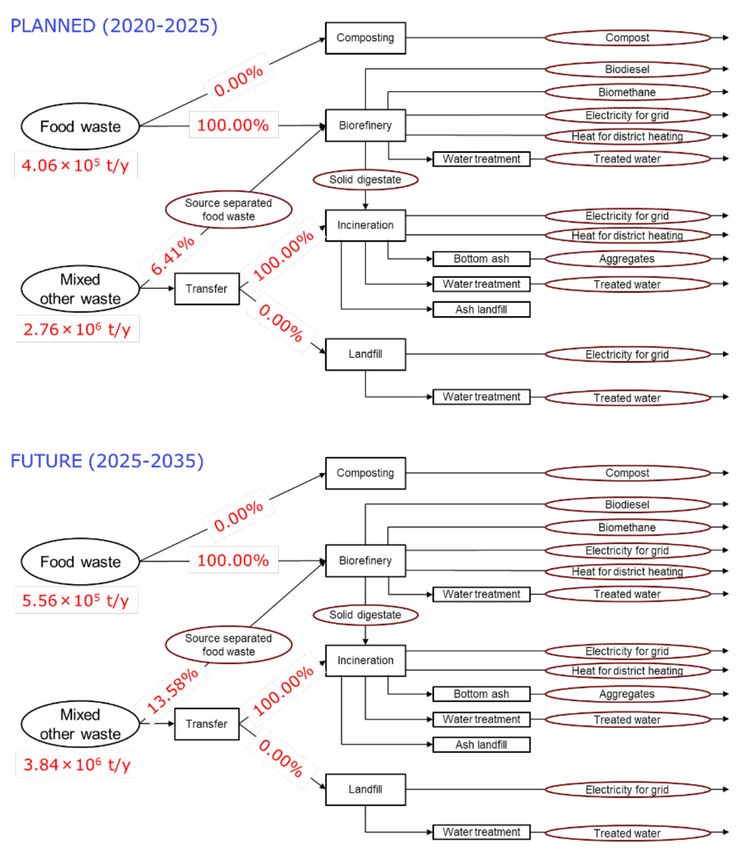
Life Cycle Assessment of Waste Management
                                                                                                                                 in Suzhou, PR China

It should be emphasized that LCA methods quantify potential environmental impacts of a general nature. This means that the conversion
from environmental flows to environmental impacts does not reflect where the emission takes places nor the presence of other sources or of
a background level. LCA methods do not address whether a threshold value is exceeded or if further emission can be accommodated before
threshold values are exceeded. These aspects are inherent in all LCA models.

The waste considered is the solid waste managed by the authorities and is addressed as “mixed other waste” from households and small
commerce and as “food waste” from restaurants, markets and cantinas, as these two waste types are collected separately. Waste treatment
facilities may treat both waste types. Most solid recyclables from households and commerce are handled by specific private contractors or in
an informal system of collectors and traders driven by economic interests. The recyclables handled by private contractors and the informal
sector are not part of the current study. This also means that in our modelling of potential future development of the waste management
system in Suzhou we do not consider introducing further source separation and recycling system, except for household food waste.

LCA modelling
The LCA-modelling is done with the EASETECH model using local data to the extent possible and supplemented with external data.
The LCA was carried out according to the requirements outlined in the International Standards 14040 and 14044, except that no
critical external review has been made. Careful internal review was conducted. The impact categories considered were selected among
those recommended by the European Commission: climate change, ozone depletion, human toxicity cancer and non-cancer effects,
photochemical ozone formation, ionizing radiation, particulate matter, terrestrial acidification, terrestrial eutrophication, freshwater
eutrophication, ecosystem toxicity, resource depletion fossil and abiotic.

In the assessment we emphasize climate change as this is believed to have priority politically. Impacts as photochemical ozone formation,
particulate matter, terrestrial acidification, and eutrophication are also consistently assessed, while the toxicity impacts are included in
the assessment only when extreme results are observed; this is due to the much higher uncertainty associated with the quantification and
characterization of the toxic flows and impacts.

The results are in some cases expressed in “person-equivalents”, which represent the amount in each impact category that is associated with
all activities (food, housing, transport, travelling etc.) of one average person within one year. The normalization references for the world are
used since consistent data relevant for China is not available.

The data used in the LCA-modelling was to the extent possible obtained from the Suzhou authorities. Composition of the MSW was
based on local data and assessed against other Chinese data available. The chemical composition of the individual material fractions were
obtained from the EASETECH database supplemented with available local data. The data on waste technologies were from local sources,
supplemented with data from the EASETECH database and other Chinese studies when necessary to obtain complete and consistent data.
External data representing exchanges over upstream and downstream borders were from the EASETECH database or retrieved from the
Ecoinvent database (v3.6, consequential).

The modelling and the data used are described in details in the report and the appendix.

Waste
The study deals with Mixed other waste and Food waste. The waste data used are based on actual measurements reported by the City
of Suzhou. Occasionally, large variations and some inconsistencies were observed in the data. Future waste characterization should be
designed to feed LCA models. In particular, the water content should be in focus as this determines actual mass of solids to be handled.

                                                                                                                                                  3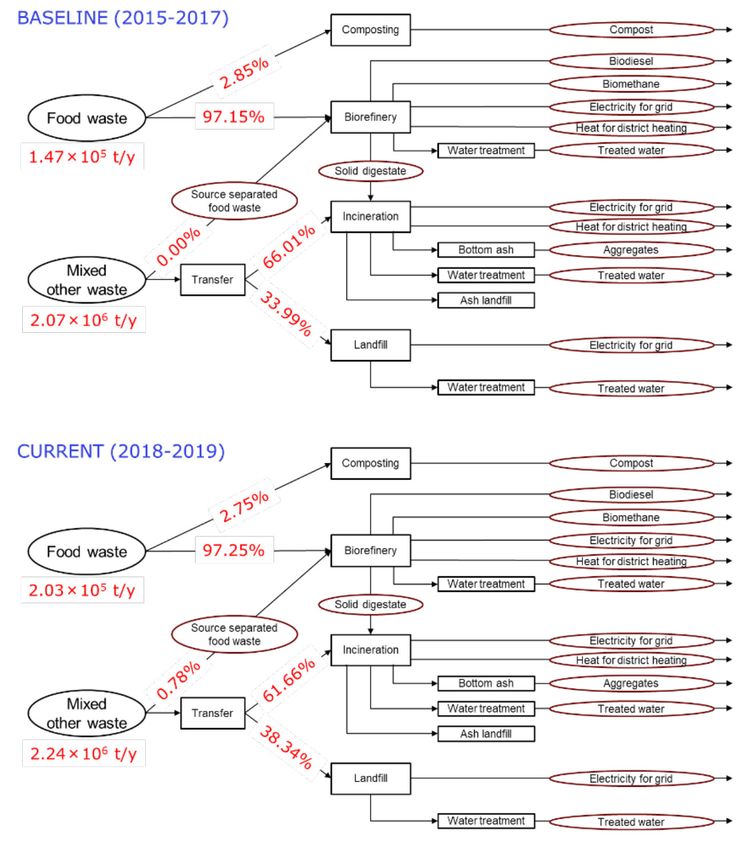
Life Cycle Assessment of Waste Management
in Suzhou, PR China

Mixed other waste: The mixed other waste collected from households was 2.01 million tons/year in 2015 and is expected to increase to 3.88
million tons/year by 2035. The population increases in the same period from 4.20 million inhabitants to 6.45 million inhabitants. This
corresponds to 480 kg/inhabitant/year in 2015 and 600 kg/inhabitant/year in 2035. The waste originates from the five districts according
to records from 2015-2019.

The water content of the waste is high: 58-64%. On a wet weight basis the waste contains approximately 50-60% food waste, 15-25%
plastic,10-15% paper, 3-6% textile, 1-3% fruit waste and 1-2% metal. Other fractions amount to 1-3%. The lower heating value is 4.4-5.7
MJ/kg wet waste. The ash content is 10-14% on a wet weight basis.

Food waste: The food waste collected from restaurants, cantinas and markets was 0.14 million tons in 2015 and is expected to increase to
0.32 million tons in 2035. The water content is high: 76-78%. The ash content is around 2% of the wet weight. Of the dry solids proteins
are 12-20% and lipids are 18-23%. The commercial Food waste amounts to 50 kg/inhabitant/year, indicating that this waste type is much
less than the mixed other waste.

Collection, transfer and transportation
The Mixed other waste is collected from local bins, small compression stations, and 88 transfer stations. The transfer stations apply
compression without any sorting of the waste. Separate collection of food waste from households are considered in some time periods and
is expressed as a percentage of the food waste at the source. The Mixed other waste contains the food waste that is not separately collected.
The collection of the waste to the transfer stations involves in the downtown area of the Gusu district and Gaoxin district small electrical
vehicles (0.5-2t), while the other districts primarily use diesel driven vehicles (3-5 t). The collection uses about 1.5 L diesel /ton of waste;
this is assumed for all collection vehicles since no data on the electrical vehicles was available. The transportation from the transfer stations
is by diesel driven trucks with a load of 8 t and the diesel use is about 4 L diesel/ton of waste. In the modelling the diesel consumption in
collection is constant, while the diesel consumption for transport is proportional to distance travelled to the treatment facility.

Food waste is collected at the primary source by diesel driven trucks and delivered at the treatment facility. The diesel consumption is 3.51
L/t for collection and transportation of food waste according to local data.

The diesel consumption is converted to emissions based on assumed exhaust emission standards by matching Chinese standards with
European standards as the latter are used in the model.

Treatment
Several treatment and disposal technologies are available or are being built in the Suzhou MSW system:

Anaerobic digestion. After a brief pre-treatment removing large unwanted items from the organic waste stream, the waste is centrifuged to
recover a lipid fraction for production of biodiesel. The remaining part is digested anaerobically for about 2 weeks and the gas is collected.
The gas generation is defined as a percentage conversion of the biodegradable carbon: 65-77%. Some of the gas is upgraded to public gas
grid quality by removing carbon dioxide. The digestate is separated; solids go to incineration and liquid to wastewater treatment. Some gas
is used for electricity production, including export to the public grid. The LCA modelling does not include the removal of foreign items
due to lack of data, but all other flows are accounted for. Actual routing of waste to facilities (2 different facilities) and their respective
capacities are respected, except in the FUTURE period.

Composting. Market waste, which constitute around 5500 tons/year, is dried by the use of an electricity driven system (6-8 hours)
removing about 80-85% of the water. The dried waste is transported to a composting plant. The annual amount of compost is small and
used locally. No environmental credits are obtained by the compost use.

4
Life Cycle Assessment of Waste Management
                                                                                                                                    in Suzhou, PR China

Incineration: A large incinerator treats 3500-4500 tons per day. After fermenting 3-5 days in the bunker, the waste is incinerated. The
bunker leachate is treated and the bottom ash is used as aggregates in construction work. The steam is sent to a turbine to generate
electricity, which is then exported to the grid. The electricity recovery is 22.5-25.8% of the lower heating value: 360-390 kWh/ton of
which about 15% is used by the incinerator. Small amount of heat is also exported (50 MJ/t). The flue gas is treated by the air pollution
control system and released into the atmosphere. The air pollution control system includes semi-dry and dry acid gas removal, activated
carbon injection, baghouse filter and selective non-catalytic NOx-removal. Diesel and material consumption is accounted for.

Landfilling: In the early time periods, a significant amount of waste is landfilled. The PLANNED and FUTURE periods do not include
landfilling of fresh MSW. The landfill operation includes unloading, spreading, compacting and covering of the waste. The landfill is
equipped with bottom liners of HDPE membrane and leachate collection system. HDPE membranes are used for interim cover. Surface
water runoff is controlled and kept separate from the leachate. Landfill gas is collected and part of the gas is routed to the incineration
plant where it contributes to the electricity production. Part of the landfill gas is flared to avoid potential safety risk. The leachate is treated
in a specialized treatment plant using membrane biological reactors and reverse osmosis technology. The treated water is partly used at
the landfill for cleaning of vehicles, and partly discharged to surface water. The LCA modelling considers emissions for 100 years after the
waste is landfilled. During the 100 years period, the fate of the carbon is estimated to: 28% as landfill gas collected and used for electricity
production, 3% flared into to carbon dioxide, 22% escaped as methane, and 47 % still remaining as stored carbon in the landfill.

Energy system
The Chinese energy system is undergoing dramatic changes as China moves towards a greener and more renewable energy system. In the
report “China 2050 High Renewable Energy Penetration Scenario and Roadmap” published by Energy Research Institute of National
Development and Reform Commission, a scenario with ideal development of society, policy, economy and technology was introduced
to predict the energy structure up to 2050: the total energy consumption will peak around 2025 and renewable energy will increase its
contribution significantly. However, by 2050 fossil based energy still constitutes about 25-30% of all primary energy consumed.

The specific development of the Chinese energy system will be decided as part of the 5-year plans and the role of the waste-based energy
will be determined as part of the development plans. Thus, currently there is no approach to predict what the waste-based energy will
substitute in the future except what can be argued by the Chinese ambition of reducing the contribution of fossil-based energy. Thus we
assume in the modelling reaching as far as 2035 that the waste-based energy will substitute for fossil-based energy: Electricity based on coal
with a Global Warming Potential (GWP) of 1.0 kg CO2-eqv./kWh and heating based on natural gas showing a GWP of 12.4 kg CO2-
eqv./1000MJ (0.49 kg CO2-eqv./m3). Biodiesel and biomethane are also credited according to their energy content.

                                                                                                                                                     5
Life Cycle Assessment of Waste Management
in Suzhou, PR China

Time period overview
The characteristics of the four time period are summarized below

    Time periods                       BASELINE                    CURRENT              PLANNED                           FUTURE

    Year                              2015-2017                 2018-2019               2020-2025                        2025-2035

                                                                              Waste

                                                                                       Forecasted                        Forecasted
    Mixed other waste                       Actual                  Actual
                                                                                      7550t/d (2025)                  10620t/d (2035)
    • Amounts
    • Fraction                                                      As observed                             Plastic increased, food decreased
    • Food waste separation
                                        No: 0%                     Yes: 1.5%            Yes: 12%                          Yes: 28%

                                                                                       Forecasted                       Forecasted 1
    Food waste                              Actual                  Actual
    • Amounts                                                                         1112t/d (2025)                    522t/d (2035)
    • Composition
                                                                                      As observed

                                                                         Technology

    Collection and transport                            EURO IV                          EURO V                           EURO VI

    Landfill technology                                 Standard                                  Landfill only for inert residues

    Landfill capacity                                 As reported                                   No limit for inert residues

    Composting                                          Standard                                          No composting

    Composting capacity                               As reported                                         No composting

    Biorefinery AD1                                     Standard                            Improved gas production and collection

    AD1 capacity                                      As reported                                            Maximum

                                          Not                                           Improved gas production, electricity consumption
    Biorefinery AD2                                                Standard
                                      established                                                         decreased

    AD2 capacity                            Zero               As reported                                   Maximum

    Biorefinery AD3&4                                Not established                         Same as AD2 with electricity recovery

    AD3&4 capacity                                   Not established                  440t/d (2025)                     840t/d (2035)

    Incinerator                                         Standard                             Improved electricity recovery (25.8%)

    Incinerator capacity                              As reported                                            No limit

Results and conclusion
The overall climate change impact of waste management in Suzhou, Figure S1, was in the BASELINE a load of the order of 89 000 tons of
CO2-equivalents per year primarily due to collection and transport and the use of landfilling. In the CURRENT time period the climate
change impact increased to 169 000 tons of CO2-equivalents per year. This increase is due to increasing amounts of waste and increased
amounts of waste incinerated with a low electricity recovery. However, in the PLANNED time period, landfilling is ceased, incineration is

6
Life Cycle Assessment of Waste Management
in Suzhou, PR China
efficient in energy recovery, and anaerobic digestion of Food waste and source-separated household food waste is in operation. In this case,
the overall impact on climate change becomes a net saving of the order of 35 000 tons of CO2-equivalents per year. The FUTURE period
suggests that there is further possibilities for improving the waste management system potentially reaching an overall saving in Climate
change about 73 000 tons of CO2-equivalents per year. This improvement is partly due to an increase in the amounts of waste handled
(around 40%) and improvements in source separation of kitchen waste and in energy recovery from anaerobic digestion and incineration
(around 60%). The Climate change impact from collection and transport increases due to the increasing amount of waste suggesting that
it may be worth searching for possibilities for reducing the fuel use in collection. In the PLANNED time period collection and transport is
the single largest net load to climate change.
20
Sum
CO2-eq (× 104 t CO2-eq / y)
10
MW-Anearobic digestion
MW-Landfill
MW-Incineration
0
MW-Collection and transport
FW-Small composting
FW-AD in progress
-10
FW-Existing AD
-20
BASELINE CURRENT PLANNED FUTURE
Figure S1: Climate change impacts as CO2-eqv. of total amount of Mixed other waste and Food waste in four periods
(MW: mixed other waste, FW: food waste, AD: anaerobic digestion)
Figure S2 shows the climate change impacts separately for 1000 t of Mixed other waste and for 1000 t of Food waste.
The management of Mixed other waste is a net load to climate change in all time periods. The landfill is a significant load in the
BASELINE (total 47 tons/1000 tons) and in the CURRENT (total 79 tons/1000 tons) time periods. The load from the landfill is mainly
from methane escaping from the landfill, while the savings are from energy produced and from storage of biogenic carbon longer than
100 years as is the time horizon considered. In the CURRENT time period, the high amount of waste incinerated with low energy
efficiency contributes also to the load in climate change. In contrast, in the last two periods where no Mixed other waste goes to landfill,
the waste management constitutes only a marginal load in climate change (PLANNED: 8 tons/1000 tons, FUTURE: 5 tons/1000 tons)
as incineration as well as biorefinery of the source-separated household food waste each constitute savings in climate change and partly
compensate for the load from collection and transport.
The management of Food waste with biorefinery based on anaerobic digestion (AD) is a net saving to climate change in all the time periods
(BASELINE: -60 ton/1000 tons, CURRENT: -34 ton/1000 tons, PLANNED: -139 ton/1000 tons, and FUTURE: -168 ton/1000 tons).
This is mainly due to the energy recovery from biogas generated in AD, as well as the incineration of the solid residues separated from AD.
AD1 is an existing AD facility, and AD2, 3 and 4 are considered the facilities in progress since AD2 just started in 2019 and AD3 and 4
are planned coming to service in the PLANNED time period.
Transportation of Food waste is also a net load to climate change in all scenarios due to the use of fossil transport fuels and it does not
change per 1000 tons of waste over time. In AD1, energy recovery from biogas (mainly as electricity and heat for own use, very little as
methane gas) avoids significant impacts to climate change. At the same time incineration of the solid residues from AD1 also contributes
significant savings due to energy recovery. Crude oil separated in AD1 is sold to external process for production of biodiesel, which also
contributes to savings on climate change. It should be noted that AD2 comes into service in the CURRENT time period and treats 60%
7Life Cycle Assessment of Waste Management
in Suzhou, PR China
of the amount of food waste treated by AD1, but the savings from AD2 are only 18% of those from AD1. This is mainly due to the
fact that AD2 still is its trial period. We assume a much better performance in the PLANNED and FUTURE time periods. Drying and
composting of market waste had high environmental impacts considering the small amount of waste handled and in the PLANNED and
FUTURE time periods market waste was subject to anaerobic digestion.
All other environmental impacts showed low loads (except composting in the two first time periods) and the impacts in the PLANNED
time period were all improved compared to the BASELINE time period.
1000 tons of MW 1000 tons of FW
8 5
CO2-eq (×104 kg CO2-eq/1000t MSW)
CO2-eq (×104 kg CO2-eq/1000t MSW)
6 0
4 -5
2 -10
0 -15
-2
BASELINE CURRENT PLANNED FUTURE -20
BASELINE CURRENT PLANNED FUTURE
Collection and transportation Incineration
Landfill Anearobic digestion Anearobic digestion 1 Anearobic digestion 2
Sum Small composting Sum
Figure S2: Climate change impacts as kg CO2-eqv. per 1000 tons of wet Mixed other
Waste (left) and of Food waste (right) in four time periods
The energy background is extremely important in the climate change impact assessment. In the LCA modelling we have used a fossil-
based energy system, which we believe will be the energy technologies affected by the waste system for the years to come. This provides
large savings obtained by exporting electricity, gas and fuels to external uses. However, when the background energy becomes greener, the
advantages of energy recovery from waste will gradually be reduced and eventually, when electricity is fully renewable, the impact from
the waste management system will turn in to a net load (Figure S3). If all electricity was supplied by hydro and wind power and all heat
(which is a very low contributor in the Suzhou case) was based on biomass the net potential impact on climate change will shift from a
saving of 73000 tons CO2-equivalents per year to a load of 1780000 tons CO2-equivalents per year. It is beyond the scope of this study to
estimate when the waste management system will exchange with a fully renewable energy system, but it shows that, when considering new
investments maybe expected to have a 30-year lifetime, changes in the background energy system must be addressed.
8Life Cycle Assessment of Waste Management
in Suzhou, PR China
Background energy
200
CO2-eq ( 104 t CO2-eq / y) 150
100
50
0
-10
Elec: natural gas
Heat: heavy oil
Heat: natural gas
Elec: hydro
Elec: wind
Elec: coal based
Heat: biomass
Heat: industrial steam
Figure S3: Climate change impacts of the whole waste system
in the FUTURE time period with different energy backgrounds.
The sensitivity analyses conducted showed – in addition to the attention to the background energy system - that in terms of optimizing
technology parameters focus should be on:
• Increase electricity recovery at incinerator
• Consider heat recovery at the incinerator if an external user can be identified
• Improve source separation of food waste in households
• Decrease electricity use in incinerator
• Decrease electricity use in treatment of bunker leachate
• Reduce fuel consumption in collection and transport of waste
• Increase gas production in anaerobic digestion
• Decrease electricity use in treating wastewater from anaerobic digestion
• Prevent biogas loss in AD plants
We suggest that LCA-modelling becomes integrated into the waste management of Suzhou as part of the reporting of the environmental
aspects of the implementation of current plans (by updating the LCA modelling for example every three years to document progress) and
as a quantitative tool in assessing new initiative as part of the planning process so new investments can provide significant environmental
improvements.
9Life Cycle Assessment of Waste Management
in Suzhou, PR China
中文摘要
本报告是由北京师范大学(中国北京)和丹麦技术大学(丹麦 Kongens Lyngby)以及苏州市和 GIZ(德国国际合作
机构)共同编写,GIZ 北京分部联系电话为:81247064。该报告应引用为:Zhao, Y., Chang, H.M., Damgaard, A., Bisinella,
V., Christensen, T.H. (2021): Life cycle assessment of waste management in Suzhou, PR China. GIZ (Deutsche Gesellschaft für Internationale
Zusammenarbeit), Beijing. 该报告包括 62 页的正文和 60 页的附件。
引言
近年来,中国固体废物管理体系正在迅速发生变化,垃圾填埋量逐渐减少,而其他处理方式和回收再利用途径逐渐增加。
在这一变化中,除了资源、空间和经济因素外,环境影响因素起着十分重要的作用。生命周期评估(LCA)是一个能够量
化固废管理过程潜在环境影响的全球公认方法。在过去的二十年中,LCA 已经被很多国家用于评估固废管理的各个方面。
LCA 可以量化评估一系列环境影响指标,并明确固废管理系统中产生环境负担和效益的环节。因此,LCA 是一个量化固废
管理过程中的环境影响、评估未来的优化潜力的有效工具。
本研究报告通过严格的 LCA 方法评估了苏州市生活垃圾管理系统对环境的影响。苏州市位于江苏省东南部的长江三角
洲中部(地理坐标:东经 119°55′ -121°20′ E,北纬 30°47′ -32°02′ N)。本研究涵盖了苏州市五个行政区产生的生活垃圾,
分别为:姑苏区、高新区、吴中区、相城区和苏州工业园,涉及面积 4050 平方公里,常住人口 423 万人。
本报告 LCA 研究的时间范围为 2015-2035 年,分为四个时段,分别代表城市固体废物管理的发展情况:“基线”为
2015-2017 年,在中国 IWM NSP 项目开始之前;“现状”为 2018-2019 年,代表当前城市固体废物管理系统;“计划”为
2020-2025 年,代表了中国五年计划中预期的固废管理系统。“未来”是一个假设的城市固体废物管理系统情景,其目的是
反映 2025-2035 年期间进一步改善苏州市固废系统环境影响的可能。在“未来”时期考虑的潜在改进措施不一定完全符合
苏州市或德国国际合作机构的观点,引入对这些措施的评估是为了说明如何在规划过程中以定量方式评估废物管理系统的
理念与方法,并说明苏州市固废系统在环境影响方面有哪些优化潜力。
研究工作中尽最大可能收集并使用了苏州市废物管理系统的真实数据,包括已有的固废系统相关规划。因此,所涉及
的三个时间段(基线、现状和计划)的 LCA 建模已尽可能接近实际情况,而在“未来”时期,我们在不考虑固废设施实际
处理能力限制的情况下,评估了固废系统进一步发展所造成的潜在环境影响。
LCA 模型量化了固废管理系统中废物、组分和物质流,同时核算了固废管理系统消耗或回收的资源和能源。我们认为
回收的资源和能源得以利用,能够避免社会上同类资源或能源的生产,因此固废管理系统能够通过回收相应的资源和能源
取得环境效益。按照国际标准方法,固废管理系统及其上游和下游工艺向环境释放的所有物质都会计入其环境影响潜能。
需要强调的是,
生命周期评估方法对潜在环境影响进行的是一般性评估。
这意味着从环境物质流向环境影响的转换评估,
不能反映污染排放所发生的位置,也不能反映已存在的其他污染源或背景水平。LCA 方法不涉及污染排放阈值或标准,从
而也不涉及在超过阈值或标准之前的环境容量。上述设定是所有 LCA 研究的通用方法。
本研究中的固体废物是指由市政收集的生活垃圾。由于不同垃圾类型的分类收集,研究中将固体废物分为两类,“其
他混合垃圾”指来自居民生活和商业、办公的混合生活垃圾,“餐厨垃圾”主要指来自饭店、农贸市场或食堂的餐厨垃圾。
研究所涉及的固废处理设施包括处理这两种垃圾的相应设施。来自家庭和和商业、办公的大多数可回收废物是由私人或经
济利益驱动的正式、非正式收集单位收集处理的,因此可回收垃圾不作为本研究的对象。这也意味着在我们对苏州市固废
管理系统未来发展的建模研究中,除家庭厨余垃圾外未涉及其他源头分类或回收系统。
10Life Cycle Assessment of Waste Management
in Suzhou, PR China
生命周期评估模型
本研究中利用 EASETECH 模型软件建立相应的 LCA 模型,其中涉及到的数据主要来自于当地实际数据,并适当补充
部分外部数据。LCA 的评估工作根据国际标准 ISO 14040 和 ISO 14044 的要求进行,由于条件所限未严格进行外部审查,
但进行了严格的内部审查。本报告中涉及的环境影响类别根据欧盟委员会推荐的环境影响类别选择,具体包括:气候变化(温
室效应)、臭氧消耗、人体毒性(致癌和非致癌)、光化学烟雾、电离辐射、颗粒物、陆地酸化、陆地富营养化、淡水富
营养化、生态毒性、资源消耗(化石类和非生物类)。
考虑到气候变化(温室效应)在国际和中国均十分重视,并符合 GIZ 的项目主旨,因此在本研究与评估中我们重点阐
述了固废管理系统对气候变化的影响。本研究还同时评估了对光化学烟雾、颗粒物、陆地酸化和富营养化等环境类别的影响;
而由于对毒性相关环境影响的定量与表征不确定性较高,对毒性相关的影响仅在存在突出结果时才纳入评估。
在某些情况下,结果以“人均当量”表示,代表相应类别的环境影响与一个普通人在一年内的所有活动(食品、住房、
交通、旅行等)平均影响的相对数量。在计算环境影响的人均当量时,因为没有与中国相关的归一化参数,所以我们使用
了世界平均的归一化参数。
LCA 模型中使用的数据主要来自苏州市。城市生活垃圾的组成基于当地实际监测数据,并根据其他可用的中国数据进
行了对比核验。每项垃圾组分的化学成分主要从 EASETECH 数据库获得,并利用可获得的当地实测数据进行补充。固废处
理技术的数据主要来自当地实际运行数据,必要时补充了 EASETECH 数据库和其他中国相关研究的数据,以获得完整而统
一的固废系统 LCA 数据。固废系统上游和下游工艺以及系统交换的外部数据,主要来自于 EASETECH 数据库或 Ecoinvent
数据库(v3.6)中最相关的数据。
为确保研究的透明性、可靠性和可重复性,本报告和附录中详细描述了研究过程中所使用的全部建模数据。
固体废物
本研究中的对象固体废物包括其他混合垃圾和餐厨垃圾。研究中所使用的垃圾组分数据基于苏州市的实际监测结果,
但在实际监测数据中存在个别差异较大或与实际情况不符之处。建议将来对垃圾组分和成分的分析内容符合 LCA 研究的相
关要求。其中,含水率对垃圾的实际质量有决定性影响,因此在分析中应特别关注对垃圾含水率的准确测定。
其他混合垃圾:2015 年来自于居民生活和商业办公等的其他混合垃圾清运与处理量为 201 万吨,并预计在 2035 年增
长至 388 万吨,人口数量也相应从 420 万增长至 645 万。这相当于 2015 年每个居民的年垃圾产生量为 480 kg,到 2035 年
增长至 600 kg/ 人 / 年。根据 2015-2019 年的数据记录,上述垃圾主要来自于苏州市的五个辖区。 其他混合垃圾的含水率较
高,达 58-64%。以湿基为基准,其他混合垃圾中含有 50-60% 的家庭厨余垃圾,15-25% 的塑料垃圾,10-15% 的纸类废物,
3-6% 的织物,1-3% 的果蔬垃圾,1-2% 的金属废物和 1-3% 的其他灰渣等,低位热值为 4.4-5.7 MJ/kg 湿基,基于湿基的灰
分含量为 10-14%。
餐厨垃圾:来自于饭店、农贸市场和食堂等的餐厨垃圾在 2015 年的清运与处理量为 14 万吨,并预计在 2035 年增长至
32 万吨。餐厨垃圾的含水率高达 76-78%,基于湿基的灰分含量约为 2%。在干固体中,蛋白质含量为 12-20%,脂肪含量
为 18-23%。餐厨垃圾的产生量为 50 kg/ 人 / 年,在处理量上餐厨垃圾比其他混合垃圾少得多。
收集、运输和转运站
苏州市的其他混合垃圾经由垃圾箱(亭)、小型压缩站和 88 个转运站进行收集转运。转运站普遍采用压缩工艺,并未
进行垃圾的筛分或分选。在部分情景下纳入了家庭厨余垃圾的分类收集,这通过厨余垃圾的源头分类比例进行表征,其他
11Life Cycle Assessment of Waste Management
in Suzhou, PR China
混合垃圾中包括了未被源头分类的厨余垃圾。在姑苏区和高新区的中心城区,从居民区到转运站的收集车辆使用了小型电
动车(载重 0.5-2 吨),其他地区的收集车主要为小型柴油车(载重 3-5 吨)。收集车收集每吨垃圾的平均油耗约 1.5 升。
由于缺少电动车的耗电数据,因此研究中对所有收集车辆均以柴油消耗进行计算。从转运站到垃圾处理设施的转运车辆主
要为载重 8 吨的柴油运输车,转运每吨垃圾的柴油消耗量约为 4 升。在 LCA 建模研究中,垃圾收集过程的柴油消耗设为定
值,而转运过程的柴油消耗与转运站到处理设施的距离成正比。
餐厨垃圾主要由柴油收运车收集,
然后运至处理设施。 用于餐厨垃圾收集和转运的柴油消耗量为 3.51 L/t。
根据实际运行数据,
在 LCA 研究中,车辆柴油消耗造成的尾气排放是基于汽车尾气排放标准进行转化与核算的,在模型中使用了中国尾气
排放标准所对应的欧洲排放标准。
处理和处置设施
苏州城市固体废物管理系统中已有或在建如下几种处理技术:
厌氧消化:餐厨垃圾经过简单的预处理,去除了大量不需要的杂质后,通过离心分离以回收油脂部分,出售后用于生
产生物柴油。其余部分进行厌氧消化,停留时间约 2 周,并进行沼气收集。沼气产率以可生物降解的碳的转化率计,核算
为 65-77%。部分沼气经过脱除二氧化碳和净化,达到天然气品质输送至天然气管网。沼渣通过固液分离,固态残渣送去焚烧,
废液则进入废水处理系统。另有部分沼气用于燃烧发电,除厂区自用外,部分并入电网。由于数据缺失 LCA 模型中未包括
餐厨垃圾中应去除的杂质部分,但完整表征了所有其他的物质流。除“未来”时间段外,LCA 模拟均以餐厨垃圾的实际处
理情况(2 个不同设施)及其各自处理能力为依据。
堆肥:农贸市场的有机垃圾(每年约 5500 吨)通过使用电力干燥 6-8 小时,去除约 80-85% 的水,干燥后的垃圾被运
送到外部堆肥厂。每年的堆肥量很小且仅在当地使用,因此并没有获得有效的环境效益。
垃圾焚烧:一座大型垃圾焚烧厂,总处理能力为 3000-4500 吨 / 日,收集的垃圾在焚烧厂贮存坑中发酵 3-5 天后再焚烧,
渗滤液在内部污水处理厂处理,底渣用作建材底料。焚烧蒸汽通过涡轮发电机发电,然后输出到电网。电能回收效率为低
位热值的 22.5-25.8%,约为 360-390 kWh/t 湿基,其中约 15% 由焚烧厂自用,同时有极少量热能输出利用(50 MJ/t)。焚
烧烟气经烟气处理系统处理后释放到大气中,烟气处理系统工艺主要包括选择性非催化脱氮、半干式和干式脱酸、活性炭
吸附和布袋除尘器等。焚烧厂所投入使用的柴油和各类物质、原料消耗均计算在内。
垃圾填埋:早期苏州市大量垃圾都采用填埋处置。在“计划”和“未来”时间段中垃圾全量焚烧,从而不再包括原生
垃圾的直接填埋处置。垃圾填埋场的作业主要包括卸载、分铺、压实和覆膜等。该垃圾填埋场设有 HDPE 膜的防渗衬层和
渗滤液收集系统。HDPE 膜也用于临时覆盖,以控制地表水径流实现雨污分流。垃圾填埋气被收集后,一部分输送到焚烧
厂用于发电,其余气体在填埋场火炬燃烧,以避免潜在的安全风险。渗滤液在专门的渗滤液处理厂中通过膜生物反应器和
反渗透技术进行处理。处理后的水部分用于垃圾填埋场车辆清洁,部分排放至地表水中。LCA 模型考虑了垃圾填埋后 100
年内的排放情况。在 100 年的时间里,所产生的填埋气中碳的流向估算为:28% 作为填埋气被收集并且用于产电,3% 被
火炬点燃以二氧化碳释放, 22% 以甲烷形式释放到大气中。填埋垃圾中 47% 的碳在 100 年内仍不会被降解,而是作为贮
存碳被保留在堆体中。
能源系统
随着中国向更绿色、更可再生的能源体系发展,中国的能源体系正在发生巨大变化。国家发展和改革委员会能源研究
所发布的《中国 2050 年高可再生能源普及率情景和路线图》报告中,介绍了一种社会、政策、经济和技术发展的理想情景,
以预测到 2050 年的能源结构,预估总能源消耗将在 2025 年左右达到峰值,而可再生能源的占比将大大增加。但到 2050 年,
基于化石的能源仍将占所有一次能源消耗的 25-30%。
12Life Cycle Assessment of Waste Management
in Suzhou, PR China
中国能源系统的具体发展将作为五年计划的重要组成,而固废能源也将作为发展计划的一部分。除了中国减少化石
能源使用比例的努力目标,目前尚难以准确预测未来由废物回收的能源将替代除化石能源外的其他能源类型。因此,在
到 2035 年的所有时间段模型中,我们假设基于废物回收的能源均替代基于化石的能源,包括基于化石的电能所产生的气
候变化潜能为 1.0 kg CO2-eqv./kWh 和基于天然气的热能产生的气候变化潜能为 12.4 kg CO2-eqv /1000 MJ(0.49 kg CO2-eqv./
m3)。生物柴油和生物甲烷也根据其能量在需要时纳入计算。
时间段(情景)概述
研究中涉及的四个时间段(情景)的特征如下表所示。
时间段(情景) 基线 现状 计划 未来
年份 2015-2017 2018-2019 2020-2025 2025-2035
废物
预测值 预测值
其他混合垃圾 真实值 真实值
7550 t/d (2025) 10620 t/d (2035)
• 产生量
• 成分 根据实测数据 塑料增加,厨余垃圾减少
• 厨余垃圾分类
无:0% 分出率:1.5% 分出率:12% 分出率:28%
餐厨垃圾 预测值 预测值
真实值 真实值
1112 t/d (2025) 522 t/d (2035)
• 产生量
• 组分 根据实测数据
技术
收集和转运 欧 IV 标准排放 欧 V 标准排放 欧 VI 标准排放
填埋技术 标准技术 仅填埋惰性残渣
填埋能力 详情见报告正文 对惰性残渣填埋无限制
堆肥技术 标准技术 无堆肥设施
堆肥能力 详情见报告正文 无堆肥设施
厌氧消化(AD)设施 1 标准技术 提高沼气产率和收集率
AD1 处理能力 详情见报告正文 最大值
厌氧消化(AD)设施 2 未建 标准技术 提高产气量,降低耗电量
AD2 处理能力 0 详情见报告正文 最大值
厌 氧 消 化(AD) 设 施
未建 同 AD2 相同技术并提高电能回收率
3&4
AD3&4 处理能力 未建 440t/d (2025) 840t/d (2035)
焚烧技术 标准技术 提高电能回收率 (25.8%)
焚烧能力 详情见报告正文 无限制
13Life Cycle Assessment of Waste Management
in Suzhou, PR China
结果和结论
图 S1 显示了苏州市固体废物管理系统对气候变化(温室效应)的总体影响,在“基线”中,每年的影响负荷约为 8.9
万吨二氧化碳当量,这主要来自于收集、运输和垃圾填埋环节。在“现状”时间段内,气候变化影响提高至每年 16.9 万吨
二氧化碳当量,这主要是由于处理的废物量增加,特别是在较低电能回收率下焚烧的废物量增加。然而,在“计划”时间段中,
填埋场已停止填埋新鲜垃圾,焚烧厂的电能回收率有所提高,餐厨垃圾和分类回收的家庭厨余垃圾开始采用厌氧消化处理。
在这种情况下,整个固废管理系统对气候变化的总体影响表现为每年可减排约 3.5 万吨二氧化碳当量。在“未来”时间段中,
通过进一步优化废物管理系统,能够显著提高温室气体的减排效果,每年约减少排放 7.3 万吨二氧化碳当量。这种改善一
定程度是由于处理的垃圾量增加(约增加了 40%)、厨余垃圾源头分类,以及对厌氧消化和焚烧能量回收率的进一步优化
(约 60%)。此外,由于垃圾处理量的增加,收集和运输环节对气候变化的影响略有增加,这说明采用更加环保的收集和
运输方式是值得考虑的。在“计划”时间段,仅有收集和运输环节对气候变化造成了不利影响。
图 S1: 四个时期中其他混合垃圾(MW)和餐厨垃圾(FW)
处理过程对气候变化的影响(以二氧化碳当量表示)
图 S2 分别展示了 1000 吨其他混合垃圾和 1000 吨餐厨垃圾处理对气候变化的影响。
在所有时间段内,其他混合垃圾的处理对气候变化都产生不利影响,在“基线”时间段(总计 47 吨二氧化碳当量 / 1000 吨)
和“现状”时间段(总计 79 吨二氧化碳当量 / 1000 吨)中,填埋场都是造成影响负荷的重要环节。垃圾填埋场对气候变化
的影响负荷主要来自于垃圾填埋场各种形式逸出的甲烷,而碳减排则主要来自填埋气的能源回收以及时间跨度 100 年以上
的生物碳贮存。在“现状”时间段内,由于较低的能源回收率,垃圾焚烧也给气候变化造成了负担。相比之下,在后两个
时间段内没有新鲜垃圾进入填埋场,垃圾处理系统对气候变化仅产生了较小的影响负荷(“计划”时间段:8 吨二氧化碳
当量 /1000 吨,“未来”时间段:5 吨二氧化碳当量 /1000 吨),这是由于家庭厨余垃圾源头分类、焚烧和生物炼制都可以
一定程度实现碳减排,并一定程度弥补了收集和运输造成的碳排放。
在所有时间段内,餐厨垃圾的厌氧消化处理对气候变化均产生了积极的减排效益(“基线”:-60 吨二氧化碳当量
/1000 吨,“现状”:-34 吨二氧化碳当量 /1000 吨,“计划”:-139 吨二氧化碳当量 /1000 吨,“未来”:-168 吨二氧化
碳当量 /1000 吨)。这主要是由于厌氧消化过程中产生的沼气可以回收部分能量,同时对沼渣的焚烧也可以回收部分能量。
图中 AD1 是现有的厌氧消化设施,而 AD2、3 和 4 表示正在或计划建设的厌氧消化设施,其中 AD2 于 2019 年开始试运行,
而 AD3 和 4 则规划在“计划”时间段内建设并投入使用。在所有情景下,由于使用化石燃料驱动收集运输车辆,餐厨垃圾
的运输也对气候变化产生了不利影响,并且不随时间发生变化。在 AD1 中,从沼气中回收能量(主要是电和自用热,极少
是天然气)可以避免较大的气候变化影响。同时,AD1 产生的沼渣进行焚烧并回收剩余能源,以及分离出的粗油出售用于
14Life Cycle Assessment of Waste Management
in Suzhou, PR China
生产生物柴油,均可以有效减少温室气体的排放。应当指出的是,AD2 在“现状”时间段内投入使用,其处理量约为 AD1
处理量的 60%,但 AD2 带来的碳减排效益仅为 AD1 的 18%。这主要是由于 AD2 仍处于试用期,在“计划”和“未来”时
间段中,AD2 预期可以达到更好的性能。来自农贸市场的有机垃圾虽然处理量较小,但其干燥和堆肥处理对环境产生了显
著的不利影响,因此在“计划”和“未来”时间段,农贸市场有机垃圾也纳入厌氧消化体系进行处理。
所有其他环境影响类别均仅有较低的影响负荷(除了在“基线”和“现状”两个时间段的堆肥处理),并且与“基准”
时间段相比,“计划”时间段内的对各类别的环境影响均得到了一定程度的改善。
图 S2: 四个时间段中每 1000 吨其他混合湿垃圾(左)和餐厨垃圾(右)
处理对气候变化的影响(以二氧化碳当量表示)
固废系统所处的能源背景在气候变化影响评估中极为重要。在 LCA 研究中,我们使用了基于化石能源的背景能源系统,
这也是当前和短期内与固废系统有直接关系的的能源背景。通过将固废处理系统中回收的电能、天然气和其他燃料输出到
系统之外并利用,可以节省大量原生资源或能源。但是,当背景能源变得更加绿色时,从废物中回收能源的优势将逐渐减小。
而当背景能源系统中的电能完全来自于可再生能源时,固废处理系统将表现出更大的环境影响符合,这主要来自于废物中
存在的化石碳释放(图 S3)。如果所有电能均由水力或风能提供,并且所有热能都来自于生物质能源(热能在苏州案例中
所占比例很小),那么固废系统对气候变化的潜在影响将从每年减排 7.3 万吨二氧化碳当量转变为每年排放 178 万吨二氧
化碳当量。固废系统在什么时间内将完全实现与可再生能源系统进行交互,不在本研究的范围之内,但是现有结果表明,
在考虑投资建设新设施或新技术、并预期服务于未来 30 年时,必须考虑背景能源系统的变化所带来的环境影响变化。
15Life Cycle Assessment of Waste Management
in Suzhou, PR China
图 S3:“未来”时间段不同能源背景下整个固废系统对气候变化的影响
敏感性分析表明,除了对背景能源的关注外,在优化技术参数方面应重点关注以下方面:
提高焚烧厂的电能回收效率
如果能够确定热能的外部使用形式,应考虑焚烧厂的热量回收利用
提高居民家庭厨余垃圾的源头分类比例
减少焚烧厂的电能消耗
减少垃圾渗滤液处理环节的电能消耗
减少垃圾收集和转运过程中的化石能源消耗
提高厌氧消化环节的沼气产率
降低厌氧消化后废液处理的电能消耗
避免厌氧消化罐沼气的泄露
我们建议将 LCA 模型研究整合到苏州市的固体废物管理体系中,可以作为规划实施在环境保护或碳减排方面成果报告
的部分内容(如每三年更新一次 LCA 模型研究以记录固废系统发展情况),并将其作为定量分析工具,在规划过程中评估
新投资或建设方案,以确定新方案对改善环境有显著效益。
16Life Cycle Assessment of Waste Management
in Suzhou, PR China
1 Introduction
Solid waste management is changing rapidly these years in China, moving away from landfills and increasing treatment and recycling of
waste. Environmental considerations play a significant role in this change, but also aspects about resources, space and economy are important.
Life cycle assessment (LCA) is able to quantify the potential environmental impacts of waste management and has been used in addressing
many aspects and in many countries during the last two decades. LCA quantifies a range of impacts and identifies where environmental
loads and savings take place within the waste management system. Thus, LCA is a helpful tool in quantifying environmental progress
within waste management and in assessing potential further improvements to be considered in the future.
This report quantifies by stringent methods the environmental impacts of waste management in the City of Suzhou, PR China covering
the period 2015-2035, divided into four time periods representing the actual development in the waste management for the city: 2015-
2017 representing the “baseline” (prior to the start of the China IWM NSP), 2018-2019 representing the “current MSW system”, 2020-
2025 representing the “planned MSW system” as expected within the 5-year plan, and 2025-2035 representing the “future MSW system”.
Data on the Suzhou waste management system has been collected on location to the extent possible. Existing plans have been included.
The three first time periods considered – BASELINE, CURRENT and PLANNED – thus have been modelled as closely to the actual
situation as possible, while in the FUTURE time period we have quantified the environmental impacts of further developments that
potentially could be considered. These potential improvements do not necessarily reflect the views of Suzhou City nor GIZ: they have
been introduced to illustrate how ideas about waste management can be assessed in a quantitative way as part of a planning process and to
illustrate how much room for improvement could be available from an environmental point of view.
The LCA-modelling quantifies the flows of waste, materials and substances through the waste management system, while simultaneously
keeping an account of exchanges of materials and energy needed to operate the waste management system and of materials and energy
recovered from the waste management system. The waste management system is credited for the materials and energy exported to the
surrounding society as we assume that these exports avoid similar production in society. All flows to the environment from the waste
management system as well as from upstream and downstream activities are characterized into potential environmental impacts following
international standard methods.
It should be emphasized that LCA methods quantify potential environmental impacts of a general nature. This means that the conversion
from environmental flows to environmental impacts does not reflect where the emission takes places nor the presence of other sources or of
a background level. LCA methods do not address whether a threshold value is exceeded or if further emission can be accommodated before
threshold values are exceeded. These aspects are inherent in all LCA models.
The waste considered is the solid waste managed by the authorities and is addressed as “Mixed other waste” form households and small
commerce and as “Food waste” from restaurants, markets and cantinas, as these two waste types are collected separately. Waste treatment
facilities may treat both waste types. Most solid recyclables from households and commerce are handled by specific private contractors or in
an informal system of collectors and traders driven by economic interests. The recyclables handled by private contractors and the informal
sector are not part of the current study. This also means that in our modelling of potential future development of the waste management
system in Suzhou we do not consider introducing further source separation and recycling system, except for household food waste.
The report contains after this short introduction (chapter 1), a chapter describing the specific LCA-modelling approach for Suzhou (chapter
2), followed by a chapter summarizing the data that has been collected about the Suzhou waste management system (chapter 3). The main
features of modelling of the Suzhou waste management system for the four time periods are summarized (chapter 4) and the results are
summarized in a following chapter (chapter 5). Details can be found in the Appendix. Finally, conclusions are presented (chapter 6).
17Life Cycle Assessment of Waste Management
in Suzhou, PR China
2 LCA Methodology
This section describes the goal and scope of the LCA conducted: The specific goals, the scope (functional unit, geographical scope, time
horizons, system boundaries, technological scope, modelling approach), and the LCA modelling approach (tool, impact assessment, data).
The final receiver of the study is GIZ, Deutsche Gesellschaft für Internationale Zusammenarbeit, who has financed the study. The
experiences from the project and the results of the work as presented in this report will support GIZ in determining how they address
environmental aspects of waste management in their future work with Chinese cities and Chinese national government bodies.
The specific results for Suzhou may also be used by the local government in managing and improving its own waste management system.
It is also part of the aim to make technical data about Chinese waste management technologies available for future waste LCA studies in China.
2.1 LCA goal
The goal of this study was to quantify for Suzhou the potential life cycle environmental impacts of their current waste management system
and of potential future developments of the system. The aim of the study was to:
• Map the flows of waste, material fractions and key elements in the waste
• Quantify potential environmental impacts of how waste management in Suzhou has developed in the period 2015-2020
• Identify where crucial information is lacking
• Learn where environmental loads and savings are obtained
• Quantify potential environmental impacts of the planned waste management systems (2020-2025) in order to show how LCA can be
used to identify the environmental aspects as part of a planning process
• Identify the technological and management issues within a future waste management system that are crucial for good environmental
performance
2.2 Scope
The scope defines the technical framing of the conducted LCA.
Functional unit
The role of the functional unit definition in LCA is to ensure that the environmental assessment of the systems is based on a fair basis for
comparison, in this case the fulfilment of the same functionality.
The functional unit is: Managing the municipal solid waste in Suzhou from the point where the waste is generated over
collection, treatment, recycling and final disposal with a view to potential improvements in the waste management system.
18Life Cycle Assessment of Waste Management
in Suzhou, PR China
The reference flow is 1000 ton (1000 t) of wet waste for each of the two types as they appear in the city; this implies that two waste flows
differ in composition. The total impact of the waste management in Suzhou is estimated by multiplying with the actual amounts of each
waste type within the specific period.
Geographical scope
The geographical scope is Suzhou City, Jiangsu province including its immediate surroundings as defined by the current waste management
administration. The waste composition as well as the current waste management system may differ significantly between Chinese cities
and learnings and conclusions should only be extrapolated to other cities with great care. The waste management system may interact
significantly with the energy system and differences in regional energy system may thus affect the result and limit the generality of the
results as well.
Time horizons
The time horizon for the waste management systems considered are 2015 to 2035. This time horizon is partly defined by the overall time
frame considered in in the China Integrated Waste Management NAMA Support Project (China IWM NSP). The time horizon has 4
periods: 2015-2017 representing the BASELINE (prior to the start of the China IWM NSP), 2018-2019 representing the CURRENT
MSW system, 2020-2025 representing the PLANNED MSW system as expected within the 5-year plan, and 2025-2035 representing
the FUTURE MSW system. The modelling addresses the four time periods separately and does not provide detailed modelling of the
transitions between the time periods.
The time horizon for environmental emissions considered is set at 100 years. This is relevant for emissions linked to landfills and to use
of organic residues on land. In particular, emissions related to leaching from landfills may persist longer than 100 years. The 100-year
period is often used in waste LCA modelling as it is considered a reasonable compromise between the data series available from relevant
technologies and our trust in extrapolating these data.
The time horizon of the environmental impacts is 100 years. This is a common choice in waste LCA, but crucial regarding the climate
change impacts, since a long time horizon averages the impact and yields lower characterization factors, meaning that an emission of a
greenhouse gas is a smaller load to the climate change when a long time period is considered.
2.3 System boundaries
The waste management system is defined from the point where the waste is generated until its final routing into recycling or utilization.
The waste is considered without any upstream burden (zero boundary), which means that waste prevention as such cannot be included in
the current study.
The upstream system boundaries include all materials and energy imported into the system to fulfil its functionality: goods, materials and
energy. However, any capital goods in terms of construction of buildings, vehicles, equipment and infrastructure are excluded.
The downstream boundary includes exchanges with the surrounding society in terms of materials for recycling, organic waste used on land
and energy exported to the public grid or external users.
19You can also read