Taking Stock With Teens - 21 Years Of Researching U.S. Teens GenZ Insights - Piper Sandler
←
→
Page content transcription
If your browser does not render page correctly, please read the page content below

FALL 2021

           Taking Stock
           With Teens                                                                          ®

           21 Years Of Researching U.S. Teens
           GenZ Insights

Piper Sandler does and seeks to do business with companies covered in its research reports. As a result, investors should be aware that the firm may have a conflict of interest
that could affect the objectivity of this report. Investors should consider this report as only a single factor in making their investment decisions. This report should be read in
conjunction with important disclosure information, including an attestation under Regulation Analyst Certification, found on pages 88 - 90 of this report or at the following site:
http://www.pipersandler.com/researchdisclosures.
Investment Risks

Risks to achievement of investment objectives include, but are not limited to, the following:
   •   Reliance on key top management
   •   Changing consumer preferences
   •   Changes in input costs and raw materials
   •   Markdown risks
   •   Product flow and inventory disruptions
   •   Competition
   •   Lack of pricing power
   •   Deleveraging of fixed expenses
   •   Foreign exchange rate risk
   •   General macroeconomic uncertainty

                                                                               Taking Stock With Teens Survey - Fall 2021 Results   | 2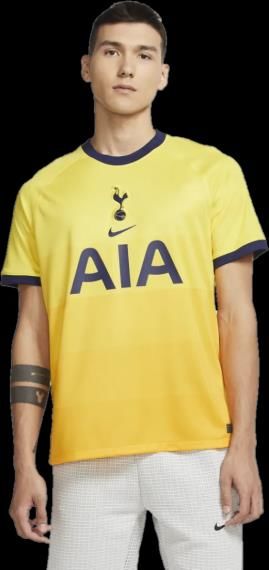
Table Of Contents

01                    02                      03                                 04
Executive             Teen Behavior &         Teen Brand                         Demographics &
Summary               Habits                  Preferences                        Appendices

• Demographics        • Gen Z Insights        • Historic No. 1 Ranks              • Survey Demographics
• Key Takeaways       • Top Social Media      • Apparel & Footwear                • Spending Breakdown
• COVID-19 Insights   • Spending Trends       • Top Fashion Trends                  & Channel Trends

• Stock Highlights    • Channel Preferences   • Up- & Downtrending                • Top Brand Time Series

                      • Secondhand & Rental   • Accessories                       • Top Athletic Brands

                      • Athletic Preference   • Beauty                            • Social Media History

                      • Content Consumption   • Websites                          • Content Consumption
                                                                                    History
                      • Video Games           • Restaurants
                                                                                  • Meet Our Senior
                      • Payment Preferences   • Snacks                              Analyst Team
                      • Crypto & NFTs         • Plant-Based Meat                  • Stock Callouts & Price
                      • Smartphone Trends                                           Targets

                                                         Taking Stock With Teens Survey - Fall 2021 Results   | 3
42nd Semi-Annual Proprietary GenZ Research Project

   10,000 15.8
      TEENS SURVEYED                                                                             AVERAGE AGE         51%                                           47%

    44                              U.S.
                                    STATES
                                                                                                                                 MALE   FEMALE      NON-BINARY
                                                                                                                                                                   2%

    $67,755
      AVERAGE HOUSEHOLD INCOME                                                                                       47%
                                                                                                                                                                       18%

                                                                                                                                                                       25%

    38%
                                                                                                                                                                       10%
                                                        TEENS CURRENTLY
                                                        PART-TIME EMPLOYED
                                                                                                                         SOUTH      WEST      MIDWEST       NORTHEAST
Survey is executed in partnership with DECA
The source for all charts/tables within this report is Piper Sandler.

                  Executive Summary                                     Teen Behavior & Habits          Teen Brand Preferences             Demographics & Appendices

                                                                                                                  Taking Stock With Teens Survey - Fall 2021 Results   | 4
Key Takeaways – Demographics & Spending
This Fall, we captured >2.4 million new data points on this all-important GenZ; we now have >52M data points around teen
preferences and spending in the 21 years of researching teens:
•   Our 42nd semi-annual Taking Stock With Teens survey was conducted between August 17 and September 16
•   Regional responses were 47% in the South (vs. 48% Spring); NE at 10% (same as Spring)
•   38% of teens hold a part-time job – up from 33% in both Spring 2021 and Fall 2020
•   91% of teens this Fall went back to school in-person; 75% of teen households have been vaccinated
•   Over the next six months, 67% of teens plan on attending a sporting event in the next 6 months vs. 55% in Spring
•   Teen “self-reported” spending improved to $2,274 – up 5% sequentially & 6% Y/Y; parent contribution was 61%
•   +MSD growth Y/Y in apparel & footwear spend (led by females); female spending on accessories +10% Y/Y
•   Clothing (22% of wallet share) is the No. 1 priority for the first time since Fall 2014; unseating Food at No. 2 (21% share)
•   Teens allocate 8% of their shopping time to secondhand; 51% of teens have purchased & 62% have sold secondhand
•   Areas of slight wallet share contraction Y/Y included: Video Games, Movies & Personal Care
•   Spending within beauty is evolving: haircare (+8% sequentially) and fragrance (+14%) while skin and cosmetics lag
•   “Everyday” makeup wearers are on the rise—moving from 22% in Fall 2020 to 33% in Fall 2021
•   Video games are 8% of teen wallet share vs. 10% LY; 52% expect to purchase a NextGen console
•   PYPL’s Venmo again ranked #1 with teens for payment apps, and its “Pay in 4” is teens’ top buy now pay later offering
•   SQ’s Cash App penetration improved to 34% (versus 28% in Spring 2021) and edged out PYPL Mobile Cash for #2 spot
•   Cash is (still) king for teens as top payment method followed by Apple Pay
•   9% of teens claim to have traded cryptocurrency; 78% of these teens are male

         Executive Summary              Teen Behavior & Habits          Teen Brand Preferences             Demographics & Appendices

                                                                                  Taking Stock With Teens Survey - Fall 2021 Results   | 5
Key Takeaways – Brand & Preference Rankings
•   52% of teens cite Amazon as their No. 1 favorite e-com site (-200 bps Y/Y); SHEIN No. 2 (9% share; +400 bps Y/Y)
•   Nike is the No. 1 apparel brand for teens & LULU gains 200 bps Y/Y; Nike is the No. 1 footwear brand—up 500 bps Y/Y
•   Crocs, PacSun, Hey Dude, Zara, SHEIN, GymShark are fashion brands gaining share, UAA & Vans had mixed results
•   Ulta gained 400 bps share Y/Y as No. 1 beauty destination with 46% share; Sephora No. 2 at 21% share
•   Maybelline No. 1 preferred cosmetics brand followed by e.l.f. & CeraVe No.1 skincare brand
•   Handbag spending improved to $96—up 10% Y/Y and up 3% sequentially, Michael Kors back in No. 1 spot
•   For UI Teens, Chick-Fil-A is No. 1 restaurant; Starbucks No. 2 (+100 bps Y/Y); Chipotle No. 3 (+100 bps Y/Y) to 10%
•   14% of teens consume plant-based meat with Impossible Foods as No. 1 (40% share) & Beyond Meat No. 2 (31%)
•   87% of teens own an iPhone and 88% expect an iPhone to be their next phone; Apple is No. 1 watch brand for first time
•   Teens spend 32% of their daily video consumption on Netflix followed by YouTube (30%); Hulu & Other streaming gain
•   Snapchat is the favorite social media platform (35% share) followed by TikTok (30%) & Instagram (22%, -300 bps Y/Y)
•   Significant movement in top social & political issues led by Environment, Racial Equality & Afghanistan
•   Teens’ favorite celebrity is Adam Sandler and favorite influencer is Emma Chamberlain (unseating David Dobrik)

        Executive Summary             Teen Behavior & Habits        Teen Brand Preferences             Demographics & Appendices

                                                                              Taking Stock With Teens Survey - Fall 2021 Results   | 6
COVID-19 Insights

                                                 91%
                                               Returned to School In-Class
                                                                                               75%
                                                                                               say a member of their
                                                    vs. 29% in Spring
                                                                                              household is vaccinated
                                                                                              (up from 30% in Spring)

                                                    Back to School                              COVID-19 Vaccine

                                                         "In the Next 6 Months, I Plan To..."
                                                                                                                                            85%
                               Dine-in at a Restaurant                                                                                81%
                                                         .
                                                                                                                               76%
                                    Visit a Retail Store                                                                         78%
                                                         .
                                                                                                                       67%
                              Attend a Sporting Event                                                       55%
                                                         .
                                                                                                                     64%
                          Go to a School Dance/Event                                          42%
                                                         .
                                                                                        35%
                        Go to a Concert/Music Festival                           28%
                                                         .
                                                                                       34%
                                         Fly on a Plane                                             48%

    Executive Summary           Teen Behavior & Habits             Teen Brand Preferences                 Demographics & Appendices

                                                                             Taking Stock With Teens Survey - Fall 2021 Results        | 7
Stock Highlights: Global Lifestyle Brands
Erinn Murphy, Managing Director | Sr. Research Analyst
                            NKE (+) SOLIDIFIES ITS NO. 1 RANK; CONVERSE ON THE RISE
                            Nike remains the No. 1 brand for teens in apparel—having held this spot for 11 consecutive years. In Fall, it
                            captured 27% of teen votes. As a preferred footwear brand (ranked No. 1), it widened its margin vs. No. 2 player
                            Vans, capturing 57% of the vote and gaining 500 bps Y/Y. Converse also is on the rise—the No. 4 footwear
     OW, PT $174            brand—up 300 bps Y/Y. Nike/Jordan is the No. 1 Fashion trend for males and Converse made the top-ten
                            trends for females, ranking No. 9.

                            CROX (+) HITS HIGHEST LEVEL IN TEEN SURVEY
                            Crocs was the No. 6 preferred footwear brand this Fall—up from No. 9 last year. This is particularly impressive
                            given Nike gained 500 bps Y/Y within footwear. Crocs ranked No. 7 for upper-income teens and No. 6 for
                            average-income teens (ranking No. 5 with average-income females).

      OW, PT $212

                            LULU (+) RISES AS FASHION & ATHLETIC BRAND
                            lululemon was the No. 5 preferred apparel brand for teens—ranking No 5 among average-income teens and No.
                            3 for upper-income teens. In fact, it tied as the No. 1 brand for upper-income females this year. It remains the
                            “top trend” for females. lululemon is the No. 2 athletic brand for upper-income teens (+100 bps share Y/Y) and
                            the No. 3 athletic brand for average-income teens (+100 bps Y/Y).
      OW, PT $481

                            VFC (=) VANS STILL NO. 2 FOOTWEAR CHOICE BUT SHARE SLIPS
                            Vans is the No. 2 preferred footwear brand for teens but slipped in share from 16% in Fall 2020 to 11% in Fall
                            2021, a 500 bps deceleration. Converse picked up 300 bps of share during the same time period and Nike
                            picked up 500 bps share Y/Y. We saw a bigger deceleration among females Y/Y—with the brand moving from
                            21% share to 13% share. In fact, in upper-income females, Converse outranked Vans for the first time since Fall
      OW, PT $111           2017 where it also ranked No. 2 at 15%. Vans ranked No. 10 as a preferred athletic brand down from No. 8 LY.

        Executive Summary                Teen Behavior & Habits              Teen Brand Preferences            Demographics & Appendices

                                                                                        Taking Stock With Teens Survey - Fall 2021 Results    | 8
Stock Highlights: Global Lifestyle Brands
Erinn Murphy, Managing Director | Sr. Research Analyst
ELF (+) KEEPS NO. 2 PREFERRED BRAND RANKING
e.l.f. is the No. 2 preferred makeup brand for all teens—gaining 200 bps share Y/Y. While it outranked Tarte
for the first time ever—Maybelline slid into the No. 1 spot by a thin margin. Among average-income teens, it
ranked No. 1 at 12% for the second consecutive time and vs. No. 2 last year (9% share). It ranked No. 4
among upper-income teens as a preferred makeup brand—vs. No. 5 last year.
OW, PT $34
ULTA (+) KEEPS COMPETITION IN THE DUST AS IN-STORE BEAUTY PURCHASES PICK UP
Ulta remained the No. 1 preferred beauty destination with 46% mindshare—up from 42% last year. Sephora
ranked No. 2 at 21% share—up 100 bps Y/Y but down 300 bps sequentially. We also saw teen preference for
in-store purchases pick up vs. pandemic levels. To wit, 87% of teens prefer to buy beauty in-store—vs. 83% in
Spring and 86% last year. Too, Target was the No. 3 preferred beauty destination—further giving us
OW, PT $470 confidence in the importance of the Ulta/Target partnership.
CPRI (+) MICHAEL KORS SHARE IMPROVES FOR HANDBAGS
For several years now, Michael Kors has lost share as a preferred handbag brand. This Fall, it moved back to
the No. 1 spot (vs. No. 2 last year) with 18% share—flat share with Fall 2020 but up 200 bps vs. Spring. We
are pleased to see broader traction in handbag spend with female teens averaging $96/year—up 10% Y/Y and
up 3% sequentially. Broadly, the female fashion wallet inflected, led by upper-income females with spending
OW, PT $75 +14% Y/Y.
TPR (+) COACH & KATE SPADE SHARE REMAINS SOLID; CATEGORY INFLECTS
We saw a continuing theme from Spring into Fall as it relates to brand preference for Coach and Kate Spade—
stability. To wit, Coach ranks No. 3 at 14% share (+100 bps Y/Y) and Kate Spade’s No. 4 spot was stable vs.
last year. We are pleased to see broader traction in handbag spend with female teens averaging $96/year—
up 10% Y/Y and up 3% sequentially. In fact, the whole accessible luxury segment rebounded for the first time
OW, PT $58 since Spring 2020.
Executive Summary Teen Behavior & Habits Teen Brand Preferences Demographics & Appendices
Taking Stock With Teens Survey - Fall 2021 Results | 9Stock Highlights: Packaged Foods
Michael Lavery, Director | Sr. Research Analyst
GIS (+) TEENS REPORT STRONG INTENTIONS TO CONSUME MORE NATURE VALLEY
Of those who listed Nature Valley as their favorite snack brand, net 76% of teens plan to eat more or the same
amount of it over the next six months (% planning to eat more + same – less), the second highest amount for
any brand (only behind Clif Bar). Among large brands, it had almost a third more teens (~19%) planning to eat
more of it than the average of other large brands (~15%)
OW, PT $70
CPB (+) TEENS REPORT STRONG INTENTIONS TO CONSUME MORE GOLDFISH
Campbell’s Goldfish was the most preferred snack brand by teens, with 12% of teens listing it as their favorite
(gaining 3pp share since our Spring 2021 survey). Also, net 67% of teens who listed Goldfish as their favorite
brand plan to eat more or the same amount of it over the next six months (% planning to eat more + same –
Neutral, PT $45 less), which was third highest among the large preferred snack brands. CPB’s share of brand mentions also
increased 3pp, the greatest sequential increase in our food coverage.
K (=/+) INCREASE IN SHARE OF BRAND MENTIONS IS POSITIVE
As a share of favorite snack brand, mentions for K brands increased 2.3pp since our Spring 2021 teen survey.
However, its large brands had a slightly mixed outcome when we asked about plans to eat more, less, or the
same amount of teens’ favorite brands; Pringles has the 2nd lowest net score (~41%) out of large preferred
Neutral, PT $67
snack brands, though Cheez-It fares much better at 4th (~66%).
BYND (-) SHARE OF FAVORITE BRAND MENTIONS SLIPS SINCE OUR LAST SURVEY
Beyond Meat (31%, down 2pp) came in as the second most preferred plant-based brand among teens with a
plant-based preference. Of the teens we surveyed, 47% either consume or are willing to try plant-based meat,
down from 49% in our Spring 2021 teen survey. Of the teens who do not consume plant-based meat, 38% are
UW, PT $95 willing to try it, down from 40% in our Spring 2020 survey.
Executive Summary Teen Behavior & Habits Teen Brand Preferences Demographics & Appendices
Taking Stock With Teens Survey - Fall 2021 Results | 10Stock Highlights: Restaurants & Branded Hospitality
Nicole Miller Regan, Managing Director | Sr. Research Analyst
CMG (+) STEADY BRAND SCORES
Chipotle remains third most preferred brand among Upper Income teens (mindshare increased to 11% vs. 9%
in Fall 2020 vs. 8% in Spring 2020, 6% in Fall 2019, 8% in Spring 2019, 8% in Fall 2018, 7% in Spring 2018,
and 8% in Fall 2017). Chipotle experienced steady Y/Y mind share levels among Average Income teens (#4 at
4% in Fall 2021 vs. #4 at 4% in Fall 2020 vs. #6 at 3% in Fall 2019) and within the brand’s historical range. We
believe gaining Average Income mindshare presents the largest opportunity as marketing efforts aid
awareness. Chipotle continues to be most preferred at Hispanic cuisine level across both Upper and Average
OW, PT $2,600
income teens.
SBUX (=) REMAINS MOST PREFERRED PUBLIC COMPANY BRAND AMONG TEENS
Starbucks maintained double-digit mindshare among Upper Income teens (with 11% mindshare vs. 12%
mindshare in Spring 2021, vs. 10% mindshare in Fall 2020, vs. 12% in Spring 2020, vs. 11% in Fall 2019, 10%
in Spring 2019, and 12% in Spring/Fall 2018). However, preference remains muted vs. historical peak levels
(18% Fall 2013 & Spring 2007; 16% Spring 2008; 15% Fall 2014 & Spring 2009 & Fall 2007). Among Average
Income teens, Starbucks maintained its No. 2 spot (with 10% mindshare vs. 10% in Spring 2021, 9% in Fall
2020, 8% in Spring 2020, and 10% in Fall 2019). We continue to view Starbucks’ brand equity as relevant
N, PT $108 social currency and note it is the most preferred brand at the coffee cuisine level.
MCD (=) REMAINS TOP 5 BRAND OVERALL WHILE SEQUENTIAL MINDSHARE HOLDS STEADY
McDonald’s maintained a top 5 brand ranking among both Upper and Average Income teens while mindshare
held steady sequentially at 5% among Average Income teens (as compared to 6% in all of 2020, 2019, and
Spring 2018 and vs. 7% Fall 2018) and notably the lowest mindshare ranking since Spring 2010. McDonald’s
continues to be most preferred within the Hamburger cuisine category. Looking forward, the brand’s recent
efforts around celebrity-inspired meals and driving heightened levels of digital engagement could gain
N, PT $232 incremental traction with teens.
Executive Summary Teen Behavior & Habits Teen Brand Preferences Demographics & Appendices
Taking Stock With Teens Survey - Fall 2021 Results | 11Stock Highlights: Semiconductors & Financial Technology
Harsh Kumar, Managing Director | Chris Donat, Managing Director
AAPL (+) Share Remains Near Record Levels in Early Days of 5G Cycle (covered by Harsh Kumar)
Both the 87% iPhone ownership and 88% intention to purchase an iPhone metrics are near record highs for
our survey. We view the elevated penetration and intention are important for a maturing premium smartphone
market. In addition, these trends are encouraging as the company continues to introduce new 5G iPhones,
which could provide a significant product cycle refresh. We think these positive trends can also be a catalyst
for further services growth as well, as the install base for Apple hardware continues to grow.
OW, PT $175
PYPL (+) LEADING TEEN APP FOR PAYMENTS AND BUY NOW PAY LATER (covered by Chris Donat)
We think PayPal’s leading position with teens for payments and buy now pay later sets the stage for future
growth in active users and payment volume. PYPL’s Venmo again ranked #1 with teens who have used a
payment app in the last month. Venmo’s 41% penetration rate was complemented by the 33% penetration of
OW, PT $315 PayPal Mobile Cash. For BNPL, PYPL was the leading offering with teens with 34% penetration. This is the
second time payments and BNPL questions were part of the teen survey.
SQ (+) CURRENTLY #2 IN PAYMENTS, BUT GAINING GROUND ON PYPL (covered by Chris Donat)
The penetration rate of Square’s Cash App increased to 34% from 28% with payments apps for teens in our
spring survey. While Cash App is behind PYPL’s Venmo, it has edged out PYPL’s flagship Mobile Cash for
the #2 position. We will closely watch payment app penetration rates in future surveys. For buy now pay
N, PT $290 later, Afterpay ranked #2 with 32% penetration. This is significant because SQ plans to close its $29B
acquisition of Afterpay in 1Q22.
Executive Summary Teen Behavior & Habits Teen Brand Preferences Demographics & Appendices
Taking Stock With Teens Survey - Fall 2021 Results | 12Stock Highlights: Internet
Tom Champion, Director
SNAP (+) STILL DOMINANT AMONGST TEENS
SNAP was again the #1 favorite app amongst teens and distanced its lead at #1 by 4% from the Spring ’21
survey. SNAP was again #2 for engagement behind Instagram, although only 4% behind Instagram versus 6%
in Spring ‘21. We are still confident in Snap’s popularity among teens going forward, as SNAP users check the
app 30x a day on average. It is also worth noting that 28% of Teens have purchased one item directly from a
OW, PT $85 social media site, up from 26% in Spring ’21. We view SNAP as being in a great position to capitalize on social
e-commerce going forward.
AMZN (+/-) CONTINUES TO BUILD ON MARKET LEADERSHIP
AMZN is again the most widely used retailer among teens with 52% of respondents saying AMZN is their
favorite online retailer (compared to Shein at 9%). This is down from 55% in Fall 2020. The category
dominance in the teen segment is underappreciated, in our view. Prime household adoption rate was strong,
with an incremental ~3% of U.S. households getting a prime subscription over the prior year. Prime adoption
OW, PT $3,904
and the maturation of the teen cohort should serve as a powerful tailwind for many years to come.
Executive Summary Teen Behavior & Habits Teen Brand Preferences Demographics & Appendices
Taking Stock With Teens Survey - Fall 2021 Results | 13Stock Highlights: Infrastructure & Communication Software
Jim Fish, Director
AKAM (+) WHEN “GAMERS GONNA GAME” – AKAMAI STANDS TO BENEFIT
The Akamai network is the largest, most distributed architecture in the space. Teens are increasing their
viewing of streaming services that are Akamai customers, continuing to download online games, and viewing
of websites / e-commerce is strong. All of this is generating more traffic that Akamai delivers to the end-user,
and thus more revenue given its toll-booth model. Cord cutting is continuing with 40% of respondents no longer
having cable (vs 35% LY), and video game spending elevated likely due to the adoption of new consoles and
OW, PT $132 greater gaming interest amongst teens. Importantly, gaming downloads remain >55% on a weighted average
basis. E-commerce strength for various leading brands like Nike is also a positive for Akamai.
FIVN (+) TELEPHONY REMAINS THE CHANNEL OF FOCUS FOR TEENS
Contact centers are becoming the main interaction point with end-consumers, including teens. Five9’s platform
can help contact centers (be it human or bot) service and better engage with teens that can drive a better
customer experience and a returning customer. Surprisingly, teens actually prefer a live phone call more than
the broader population, but also were more open to newer communication channels like SMS messaging & live
chat. While industry estimates call for agent declines, the low acceptance of bots today gives us confidence
TAM estimates for the space are too conservative. As one of the best pure-plays in the market, we find the
OW, PT $200
results a positive for Five9.
Executive Summary Teen Behavior & Habits Teen Brand Preferences Demographics & Appendices
Taking Stock With Teens Survey - Fall 2021 Results | 14Teen Behavior & Habits
E-Commerce
Social Media & Content
Key Themes,
Trends &
Takeaways
Food & Snacks Payment & Crypto
Fashion & Beauty Video Games
Executive Summary Teen Behavior & Habits Teen Brand Preferences Demographics & Appendices
Taking Stock With Teens Survey - Fall 2021 Results | 15GenZ Insights: They Actually Care About The World
Most Important Political & Social Issues
SPRING 2020 FALL 2020 SPRING 2021 FALL 2021
1 Environment 16% 1 Racial Equality 19% 1 Racial Equality 20% 1 Environment 15%
2 Coronavirus 11% 2 Environment 9% 2 Environment 12% 2 Racial Equality 13%
3 Abortion 8% 3 Black Lives Matter 8% 3 Black Lives Matter 6% 3 Afghanistan 6%
4 Gun Control 6% 4 2020 Election / Voting 7% 4 Coronavirus 5% 4 Coronavirus 6%
5 Racial Equality 6% 5 Coronavirus 6% 5 Equality 5% 5 Abortion 5%
6 Immigration 6% 6 Abortion 5% 6 Abortion 5% 6 Joe Biden 3%
7 2020 Election / Voting 4% 7 Equality 5% 7 Immigration 3% 7 Economy 3%
8 Equality 4% 8 Immigration 2% 8 Economy 3% 8 Women's Rights 3%
9 Health Care 3% 9 Police Brutality 2% 9 Joe Biden 2% 9 Gas Prices 3%
10 Donald Trump 2% 10 Gun Control 2% 10 Gun Control 2% 10 LGBTQ+ Rights 2%
• We started asking teens to “name a political or social issue that is important” to them for the first time in Fall 2019
• GenZ is unique in that they appear to care more about social justice & the environment versus former generations
• In the last year, teens have been advocating for the Environment (15%) at the No. 1 spot, with Racial Equality No. 2
• Additionally, specific mentions of the recent Afghanistan situation took No. 3; Joe Biden moved to No. 6 sequentially
• Coronavirus-related concerns continue to linger as the issue moved from No. 5 to No. 4 Y/Y in teens’ minds
Executive Summary Teen Behavior & Habits Teen Brand Preferences Demographics & Appendices
Taking Stock With Teens Survey - Fall 2021 Results | 16Staying On The Green Theme – Let’s Look At Carbon Footprint
Do you pay attention to your Do you consider your Carbon Footprint
Carbon Footprint? when making purchasing decisions?
Over the last several years, a mainstay in Teens’ biggest Social or Political concern has been the Environment. This year, it
took the highest mindshare at 15%. We asked Teens if they paid attention to their Carbon Footprint, with 27% indicating that
they do. Of this 27%, more than half (54%) indicated that their Carbon Footprint impacts their purchasing decisions.
Executive Summary Teen Behavior & Habits Teen Brand Preferences Demographics & Appendices
Taking Stock With Teens Survey - Fall 2021 Results | 17GenZ Insights...The Who’s Who?
Who They Like & Who They Follow
Favorite Celebrities Favorite Social Media Personalities
1. Adam Sandler 1. Emma Chamberlain
2. Ryan Reynolds 2. Dwayne “The Rock” Johnson
3. Kevin Hart 3. Danny Duncan
4. Dwayne “The Rock” Johnson 4. Kylie Jenner
5. Taylor Swift 5. David Dobrik
6. Kanye West 6. Mr. Beast
7. Zendaya 7. Kevin Hart
8. Harry Styles 8. Kanye West
9. LeBron James 9. Charli D’Amelio
10. Tom Holland 10. LeBron James
• Adam Sandler moved up from no. 4 in the Spring to the top celebrity taking the spot from Kevin Hart while Ryan
Reynolds, previously outside the Top 10, was the teens 2nd favorite celebrity. Donald fell out of the Top 10 while LeBron
James fell from No. 6 to No. 9.
• David Dobrik fell from the top Social Media Personality spot to No. 5, being replaced by Emma Chamberlain. Lebron
James fell from No. 4 last Spring to No. 10. Nelk Boys fell from the Top 10 & Charli D’Amelio made her debut.
Executive Summary Teen Behavior & Habits Teen Brand Preferences Demographics & Appendices
Taking Stock With Teens Survey - Fall 2021 Results | 18Snap Distances Lead As Favorite; Instagram Most Used
Favorite Social Media Platform 36%
34% 35%
31% 31%
29% 30% 30%
25% 24%
22%
13%
4% 3% 3% 4% 2% 2% 2% 5% 5%
2% 2% 3%
Twitter Facebook Discord Instagram TikTok Snapchat
Spring 2020 Fall 2020 Spring 2021 Fall 2021
Highest Social Media Engagement
82% 80% 78% 85% 84% 84% 81%
77%
73%
69% 71%
62%
41% 39% 41% 38%
34% 32% 34% 33%
28% 28% 27% 27%
Facebook Pinterest Twitter TikTok Snapchat Instagram
Spring 2020 Fall 2020 Spring 2021 Fall 2021
• Instagram continues to lead the pack in monthly usage at 81%, followed by Snapchat at 77% and TikTok at 73%.
• The trio of Snap #1 TikTok #2 and Instagram at #3 remained from the last survey, although Snap improved its lead at number
one.
• When asked, the average teen in our survey spends ~4.2 hours per day on social media.
Executive Summary Teen Behavior & Habits Teen Brand Preferences Demographics & Appendices
Taking Stock With Teens Survey - Fall 2021 Results | 19What’s In Your Wallet? Food, Video Games & Clothing
Upper-Income Teens
Males’ Wallet Share Females’ Wallet Share
1 Food 21% 1 Clothing 29%
2 Clothing 16% 2 Food 21%
3 Video Games/Systems 14% 3 Personal Care 10%
• Food remains the most important category for male spending and remains flat on a Y/Y basis
• Video Games fell from No. 2 in the male wallet at 17% last Fall to No. 3—losing 300 bps of share
• Clothing increased to No. 2 with 16% share for males—flat Y/Y at 16% share
• Clothing remains the top-choice within the wallet for females, up 200 bps from Fall 2020; Food stayed at No. 2
• Personal care remained the No. 3 wallet choice for females at 10%--down 100 bps from Fall 2020 of 11% share
Executive Summary Teen Behavior & Habits Teen Brand Preferences Demographics & Appendices
Taking Stock With Teens Survey - Fall 2021 Results | 20Teen Spending Up 6% Y/Y, Up 5% Vs. Spring 2021
All Teens
• Teens self-reported spending ~$2,274 per year in our survey, implying total teen spending of ~$63B, assuming 27.7M
teens ages 13-19.
Executive Summary Teen Behavior & Habits Teen Brand Preferences Demographics & Appendices
Taking Stock With Teens Survey - Fall 2021 Results | 21Female Spend Provides Support Of Fashion Cycle
Upper Income Female Spend – Apparel, Footwear and Accessories
+14% Y/Y
• We are encouraged by the growth of the Female fashion spend, which was up 14% Y/Y and grew across all three
categories - +14% for Apparel, +10% for Footwear and +25% for Accessories is approaching pre-pandemic levels.
• The growth across all three categories supports the Fashion Cycle that we have been tracking over the last 12-18
months.
Executive Summary Teen Behavior & Habits Teen Brand Preferences Demographics & Appendices
Taking Stock With Teens Survey - Fall 2021 Results | 22Clothing At Highest Level Of Female Wallet Share Since 2013
Upper-Income Females
• Among upper-income females, the wallet share for clothing has reached its highest level since 2013 at 29%. This is
up 270 bps Y/Y and a 500 bps gain after stagnating at 24% in Fall 2017.
Executive Summary Teen Behavior & Habits Teen Brand Preferences Demographics & Appendices
Taking Stock With Teens Survey - Fall 2021 Results | 23Shopping Channel Preference
Upper-Income Teens
• Specialty retail is the most prominent channel for teens—with 30% of their time spent in this channel (+900 bps Y/Y)
• Of importance, we changed the aided examples for "Specialty" in the question last Spring, from “Express,
Abercrombie, Gap” to “Pacsun, American Eagle, Hollister”, which we believe might have skewed the data
• Online dropped share to 20% from 22% last Fall—this could be tied to consumer eagerness to be in store again
• Discount stores dropped 500 bps Y/Y, Major Chain/Dept Store & Outlets each lost 200 bps Y/Y
• Off-Price gained 200 bps Y/Y; Secondhand was flat Y/Y at 8%
Executive Summary Teen Behavior & Habits Teen Brand Preferences Demographics & Appendices
Taking Stock With Teens Survey - Fall 2021 Results | 24Women Now Lead Digital Shift
Upper-Income Teens
94%
90%
93%
70%
Female Male
50%
• When asked if teens shop online, until 2020 (outside of a single instance in Spring 2013), digital shopping had higher
penetration with Men vs. Women
• In Fall 2020, digital penetration for the ladies came in neck-and-neck with the guys at 90% - last Spring, the digital
penetration rate for females accelerated substantially, outpacing the males at 96% vs. 92%
• While the gap closed this Fall, females remain above men with 94% digital penetration vs. males at 93%
Executive Summary Teen Behavior & Habits Teen Brand Preferences Demographics & Appendices
Taking Stock With Teens Survey - Fall 2021 Results | 25Secondhand Market Adoption Sold Secondhand Clothes
Upper-Income Teens 62%
66%
62%
58% 57% 58%
55% 53% 55%
% of UI Teens Who Have Tried a Secondhand eCom Platform
46%
41%
40%
37%
Secondhand Ranks
Female Male Overall
#9
Favorite Brand/Retailer 13%
18% 19% 19%
Purchased Secondhand Clothes
63% 62%
66%
46% 47%
51%
When Aggregated* 37%
34%
31%
Male Female
Female Male Overall
Spring 2020 Fall 2020 Spring 2021 Fall 2021 Fall 2020 Spring 2021 Fall 2021
• We asked teens about their activity on popular Secondhand Marketplaces, including Poshmark, The RealReal, Tradesy,
thredUp, Mercari, and Depop – above, Upper Income teen participation on these platforms is charted
• Secondhand marketplace activity has picked up moderately Y/Y, with UI Males moving from 18% to 19% and UI Females
increasing to 41% from 40% in Fall 2020.
• 51% of UI teens have PURCHASED clothes secondhand (either a marketplace or a thrift store) & 62% have SOLD on the
Secondhand with female engagement higher than male at 66% vs. 57%.
Executive Summary Teen Behavior & Habits Teen Brand Preferences Demographics & Appendices
*includes mentions for Thrift/Consignment Stores, Goodwill, Platos Closet and Park Avenue Thrift Taking Stock With Teens Survey - Fall 2021 Results | 26Rental Market Appetite
Upper-Income Teens
Would You Pay a Monthly Fee For a Rent-and-Return Retail Service?
• Appetite from UI teens for a rent-and-return service to keep wardrobes fresh reached a high-water mark since we began
asking about it. Both Male and Female sentiments accelerated 800 basis points sequentially.
Executive Summary Teen Behavior & Habits Teen Brand Preferences Demographics & Appendices
Taking Stock With Teens Survey - Fall 2021 Results | 27Athletic Apparel Trending Upward
Aggregate Athletic Mindshare As Favorite Apparel Brand - Upper-Income Teens
• 39% of preferred apparel brands are “athletic,” the highest level we have seen since Spring 2017.
Executive Summary Teen Behavior & Habits Teen Brand Preferences Demographics & Appendices
Taking Stock With Teens Survey - Fall 2021 Results | 28Athletic Footwear Still Gaining Share Among Females
Favorite Footwear Brand Mindshare - Upper-Income Female Teens
• 86% of females prefer an athletic brand of footwear (above), up 600 bps Y/Y and besting the previous survey high at
82% in Spring; 87% of males prefer an athletic brand of footwear, down 100 bps from 88% in Fall 2020
Executive Summary Teen Behavior & Habits Teen Brand Preferences Demographics & Appendices
Taking Stock With Teens Survey - Fall 2021 Results | 29Netflix Still Leads Teen Daily Video Consumption
Daily Video Consumption by Platform
38%
37%
35%
33% 34%
32% 32%
30%
16%
12%
9%
8%
7% 7%
6% 6% 7% 6% 7%
5% 5% 5%
3% 3% 3% 3% 4%
2%
Amazon Prime HBO Max Cable TV Disney+ Other streaming Hulu YouTube Netflix
Fall 2018 Fall 2019 Fall 2020 Fall 2021
• On average, teens spend 32% of their daily video consumption on Netflix, down 2% from Fall 2020.
• Netflix remained the top platform, ahead of second place YouTube at 30% (down from 32% in Fall 2020).
• Hulu (ranked #3) and Disney+ (#5) both improved from Fall 2020 on a percentage basis.
Executive Summary Teen Behavior & Habits Teen Brand Preferences Demographics & Appendices
Taking Stock With Teens Survey - Fall 2021 Results | 30Online Video Continuing To Gain Share
• Cord Nevers: 40% of teens in our survey indicated that they do not have
cable TV in their household; this is up from 37% in the Spring.
• Cord Cutters: 7% of teens said they expect their household to cancel
cable TV within the next 6 months, which has held steady the past three
surveys.
• Migration of Time/Wallet to Online Video: As a result of these trends,
we expect to see an ongoing transition toward online video / streaming
services.
Are you planning to cancel your cable subscription over the next 6 months?
(% of students)
Spring Spring Spring Spring Spring
Fall 2015 Fall 2016 Fall 2017 Fall 2018 Fall 2019 Spring 2020 Fall 2020 Fall 2021
2016 2017 2018 2019 2021
I don't have cable 17% 19% 17% 17% 20% 22% 25% 28% 32% 33% 35% 37% 40%
No 74% 70% 75% 72% 72% 69% 66% 62% 60% 58% 58% 56% 53%
Yes 9% 11% 8% 10% 8% 10% 9% 10% 9% 8% 7% 7% 7%
Executive Summary Teen Behavior & Habits Teen Brand Preferences Demographics & Appendices
Taking Stock With Teens Survey - Fall 2021 Results | 31Customer Service Channel Preferences
“When having to interact with customer service, what communication channel do you most prefer to utilize?”
• 58% of teens prefer to pick up the phone and call a customer service agent (up from 54% last survey), followed by
Text /SMS and Live Chat with a Human.
• Unsurprisingly, teens are more willing to use new communication channels like live chat and social media than the
average consumer, though surprisingly, Phone remains the channel of choice. As the population continues to shift
towards Millennials & GenZ, we will likely see continued shifts to digital channels
Executive Summary Teen Behavior & Habits Teen Brand Preferences Demographics & Appendices
Taking Stock With Teens Survey - Fall 2021 Results | 32Teen Preferences When Interacting With Bots
“When you interact with bots, do you typically have a positive or negative experience? How would you compare the
experience you receive from a bot vs. a human agent?”
• There is mixed feelings about bot experience for customer service, with only 49% of teens noted an overall positive
experience with bots and only 10% finding them as helpful as humans
• Industry estimates call for a decline in the number of human agents, while the data supports the need for more
human agents given 90% of teens prefer a human-experience.
Executive Summary Teen Behavior & Habits Teen Brand Preferences Demographics & Appendices
Taking Stock With Teens Survey - Fall 2021 Results | 33Teens’ Usage Of Video Conferencing Solutions For Education
During the pandemic, which video communication tool did your school ask you to use for class, group projects, or
any other school related activity? (select all that apply)
% of “Other” Mentions (Most Popular)
• Unsurprisingly, Zoom was mentioned by >65% of students as a
tool the school asked teens to use during hybrid learning.
• On average, 1.44 solutions were mentioned per student, notably
lower than the ~2.5 solutions per remote worker in our broader
consumer survey.
Executive Summary Teen Behavior & Habits Teen Brand Preferences Demographics & Appendices
Taking Stock With Teens Survey - Fall 2021 Results | 34Video Games: Teen Spending And Preferences
$209 - Expected Video Game Spend in 2021
$250 18%
14% - Budget Spent On Video Games in 2021
16%
$200 14%
12%
$150
10%
8%
$100
6%
$50 4%
2%
$0 0%
Video Game Spend (Male+Female) Video Game Spend Allocation (Male)
• Teens are expected to spend $209 on video games during 2021, down from $227 in the Fall 2020 survey
• We believe this could be driven by teens spending more time outside of the home compared to last year
• For upper income males, video games as a percentage of total budget declined to 14% in the Fall 2021 survey
• This is down from 17% of the budget in last Fall’s survey, again likely driven by the pandemic
• For the first time since Spring 2020, clothing is a higher budget percentage than video games for this demo
• Expected video game spending is essentially in-line with the Fall 2019 survey, the last survey before the pandemic
Executive Summary Teen Behavior & Habits Teen Brand Preferences Demographics & Appendices
*We updated the Spring 2021 survey metrics to match the same historical data set Taking Stock With Teens Survey - Fall 2021 Results | 35Video Games: Current “Gamer” Behavior
All Teens
67% Of Teens In Our Survey Say They Are Gamers
(vs. 69% in Fall 2020)
52% Of Gamers Plan to Buy New Console System in the Next 2 Years
(vs. 59% in Fall 2020)
12% Of Gamers Plan to Play More Video Games After COVID Subsides
(vs. 11% in Spring 2021)
Executive Summary Teen Behavior & Habits Teen Brand Preferences Demographics & Appendices
Taking Stock With Teens Survey - Fall 2021 Results | 36Teen Video Game Trends
• Of Gamers Play Video Games on Both
25% Console and PC
• Of PC Gamers Use a GPU
60% Board/Graphics Card
• Of PC Gamers Plan to Buy a GPU
30% Board/Graphics Card in the Next 6
Months
• Of GPU Board/Graphics Card
34% Purchasers Would Pay Over MSRP
Executive Summary Teen Behavior & Habits Teen Brand Preferences Demographics & Appendices
Taking Stock With Teens Survey - Fall 2021 Results | 37Top Payment Apps For Teens
Penetration for Payment Apps Used in Last Month For users of Venmo, Cash App & PayPal,
Venmo Leads
50% 47% Fall 2021 Spring 2021 20%
41% 7% 7%
40% 13%
34% 34%
33%
11%
30% 28%
27% 15%
23%
20% 20% 21%
20%
16%
14% 14%
12%
10%
6%
4%
0%
Venmo Cash App PayPal Bank of America Zelle Wells Fargo JPMorgan Chase Other (please list)
Other
PayPal’s Venmo has highest penetration at 41% followed by Cash App. However, despite PayPal holding the top spot
PYPL’s penetration dropped to 41% from 47% in our Spring 2021 survey. Cash App improved to 34% from 28% passing
PayPal Mobile Cash in the #2 spot. Apps from traditional banks continue to lag the fintech apps.
Executive Summary Teen Behavior & Habits Teen Brand Preferences Demographics & Appendices
Taking Stock With Teens Survey - Fall 2021 Results | 38PayPal “Pay In 4” Leads In Top Buy Now Pay Later Offerings
Penetration for Teens on Buy Now Pay Later Offerings
Fall 2021 Spring 2021
PayPal Pay in 4 34%
33%
Afterpay 32%
29%
Klarna 18%
15%
American Express Pay It Plan It 17%
21%
Affirm 9%
7%
Quadpay 7%
7%
Sezzle 5%
6%
Other (please list) 11%
Other 10%
0% 5% 10% 15% 20% 25% 30% 35% 40%
PayPal “Pay in 4” leads in penetration for teens among the top Buy Now Pay Later offerings at 34% (33% penetration in
previous survey). Afterpay and Klarna both picked penetration share in the most recent survey with Afterpay gaining 3 points
and Klarna also gaining 3 points. BNPL has been a popular topic for investors given recently announced deals and
partnerships in the space such as Square announcing its acquisition of Afterpay.
Executive Summary Teen Behavior & Habits Teen Brand Preferences Demographics & Appendices
Taking Stock With Teens Survey - Fall 2021 Results | 39Cash Is (Still) King For Teens’ Top Payment Method
Penetration of Payment Methods Used in Last Month Among Teens
35% of Teens Do Not Have a Traditional Bank Account
90% 85% Fall 2021 Spring 2021
83%
80%
35%
70%
60% 65%
50%
40% 35%
32%
30% Yes No
24%
22% 20%
20% 18% 17%16%
13%13% 12%12%
10%
4% 4% 3% 3% 3% 2%
0%
Cash (paper Apple Pay PayPal Prepaid card Check Amazon Pay Google Pay QR Code Shop Pay Other (please
currency) Other
list)
Prepaid Card
Cash is the most penetrated payment method among teens at 85% (versus 83% in our previous survey). While we are
somewhat surprised by the cash penetration among teens, we believe it is a function of 35% of teens surveyed not having a
traditional bank account. (The CARD Act of 2009 also limits access to credit cards.) We expect as teenagers get older, they
will graduate to electronic payments methods such as Apple Pay, PayPal, and others.
Executive Summary Teen Behavior & Habits Teen Brand Preferences Demographics & Appendices
Taking Stock With Teens Survey - Fall 2021 Results | 409% Of Teens Have Bought Crypto
Have you ever bought bitcoin or another cryptocurrency?
Gender Makeup of Teen Crypto Traders
Only 9% of teens claim to have traded cryptocurrency, but another 70% are aware of what cryptocurrencies are. Of the
crypto traders, a striking 78% are male. Teens who traded crypto also tended to be older and have above-average
household incomes relative to the survey average.
Executive Summary Teen Behavior & Habits Teen Brand Preferences Demographics & Appendices
Taking Stock With Teens Survey - Fall 2021 Results | 41Non-Fungible Tokens (NFTs) Hit The Scene
Have you ever heard of Non- Have you ever purchased a Non-
Fungible Tokens (NFT)? Fungible Token (NFT)?
33%
22%
10%
10% 90%
Male Female Overall
Yes No
NFTs have burst onto the scene in the last 12 months. 22% of teens had heard of NFTs when asked, with 33% of Males
having heard of the digital assets. Of those that have heard of them, 10% have purchased NFTs. We are interested to see
how this number evolves, and if the NFT craze will be sustainable in its growth.
Executive Summary Teen Behavior & Habits Teen Brand Preferences Demographics & Appendices
Taking Stock With Teens Survey - Fall 2021 Results | 42Teen iPhone Ownership And Purchase Intent Up
100%
90%
80%
70%
60%
50%
40%
30%
20%
10%
0%
Own an iPhone Expect next phone to be an iPhone
• iPhone ownership was up year-over-year to 87%. We note ownership is up from 86% in last Fall’s survey.
• 88% of teens said their next phone will be an iPhone, down 1% from Fall-20 survey.
• We note both of the metrics are slightly lower than the all-time highs we saw during the Spring-21 survey.
Executive Summary Teen Behavior & Habits Teen Brand Preferences Demographics & Appendices
Taking Stock With Teens Survey - Fall 2021 Results | 43Teen Apple Watch Ownership Up To 30%
40%
35%
30%
25%
20%
15%
10%
5%
0%
Own A Smartwatch Plan to buy Apple Watch
• Smart watch ownership was up to 35% from 30% in Fall 2020. Apple Watch ownership was up to 30% from 25% last Fall.
• Apple Watch buying intent was up with 15% planning to buy in the next 6 months vs. 13% in the Spring-21 survey.
Executive Summary Teen Behavior & Habits Teen Brand Preferences Demographics & Appendices
Taking Stock With Teens Survey - Fall 2021 Results | 44Teen Brand Preferences
Image Source: Nike
Spring 2001
Gap
Fall 2001
Spring 2002
Fall 2002
Executive Summary
Spring 2003
3.5 years
Fall 2003
Spring 2004
Abercrombie & Fitch
Fall 2004
Spring 2005
Fall 2005
Spring 2006
Fall 2006
Hollister
3.5 years
Spring 2007
Fall 2007
Spring 2008
Teen Behavior & Habits
Fall 2008
Spring 2009
Fall 2009
Brands
2.5 years
Spring 2010
Action Sports
Fall 2010
Spring 2011
Fall 2011
Spring 2012
Fall 2012
Spring 2013
Fall 2013
Teen Brand Preferences
Spring 2014
Fall 2014
Spring 2015
Fall 2015
Spring 2016
Nike
Fall 2016
11 years
Spring 2017
Fall 2017
Spring 2018
Fall 2018
Spring 2019
Fall 2019
Taking Stock With Teens Survey - Fall 2021 Results
Demographics & Appendices
Spring 2020
Fall 2020
| 45
Spring 2021
Fall 2021Favorite Apparel Brands
All Teens – See Appendix for more detail broken down by upper vs. average-income teens or male vs. female
SPRING 2020 FALL 2020 SPRING 2021 FALL 2021
1 Nike 25% 1 Nike 27% 1 Nike 27% 1 Nike 27%
2 American Eagle 10% 2 American Eagle 8% 2 American Eagle 7% 2 American Eagle 7%
3 Adidas 5% 3 Adidas 5% 3 PacSun 6% 3 PacSun 5%
4 Hollister 4% 4 Pacsun 4% 4 lululemon 4% 4 Adidas 5%
5 PacSun 3% 5 Hollister 4% 5 Adidas 4% 5 lululemon 5%
6 lululemon 3% 6 lululemon 3% 6 Hollister 3% 6 SHEIN 4%
7 Forever 21 3% 7 H&M 3% 7 Urban Outfitters 3% 7 Hollister 3%
8 Urban Outfitters 3% 8 Urban Outfitters 3% 8 SHEIN 3% 8 H&M 3%
9 H&M 2% 9 Vans 2% 9 H&M 2% 9 Urban Outfitters 2%
10 Vans 2% 10 Forever 21 2% 10 Thrift/Consignment Stores
2% 10 Vans 2%
Nike + Adidas 30% Nike + Adidas 32% Nike + Adidas 31% Nike + Adidas 32%
• Apparel spending was ~$535/year—up 5% Y/Y and sequentially
• Females outspend males by ~$186; female spending was +7% Y/Y and male +4% Y/Y
• Nike is the No. 1 brand (>10 years running) at 27% share, flat sequentially and Y/Y
• American Eagle remains its No. 2 spot but sheds 100 bps share Y/Y
• Adidas fell from No. 3 last year to No. 4, but maintained mindshare of 5%
• lululemon moved from No. 6 to No. 5, gaining 200 bps Y/Y of share
• Hollister continues to slip while Urban Outfitters fell 1 spot. PacSun gained 100 bps and
moved from No. 4 to No. 3 Y/Y
• After SHEIN’s debut in the Spring, mindshare increased sequentially from No. 8 to No. 6
Executive Summary Teen Behavior & Habits Teen Brand Preferences Demographics & Appendices
Image Source: nike.com Taking Stock With Teens Survey - Fall 2021 Results | 46Favorite Footwear Brands
All Teens – See Appendix for more detail broken down by upper vs. average-income teens or male vs. female
SPRING 2020 FALL 2020 SPRING 2021 FALL 2021
1 Nike 47% 1 Nike 52% 1 Nike 56% 1 Nike 57%
2 Vans 20% 2 Vans 16% 2 Vans 12% 2 Vans 11%
3 Adidas 11% 3 Adidas 11% 3 Adidas 9% 3 Adidas 9%
4 Converse 4% 4 Converse 4% 4 Converse 6% 4 Converse 7%
5 Foot Locker 3% 5 Foot Locker 2% 5 Foot Locker 2% 5 Foot Locker 2%
6 New Balance 1% 6 Birkenstock 1% 6 Dr. Martens 2% 6 Crocs 1%
7 Birkenstock 1% 7 Dr. Martens 1% 7 New Balance 1% 7 New Balance 1%
8 Dr. Martens 1% 8 New Balance 1% 8 Crocs 1% 8 Hey Dude 1%
Steve Madden 1% 9 Crocs 1% 9 Birkenstock 1% 9 Dr. Martens 1%
10 Finish Line 1% 10 Steve Madden 1% 10 Under Armour 1% 10 Birkenstock 1%
• Footwear spending was $290/year—up 5% Y/Y led by women’s +7% Y/Y and men’s +5%
• Despite seeing a female-led spending recover, males still outspend females on footwear by $50/year
• Nike (No. 1) gains substantial share—up 500 bps Y/Y to 57% vs. 52% last year; taking share from Vans & adidas
• adidas remains No. 3 but lost 200 bps of share and Converse gained 300 bps Y/Y solidifying its No. 4 spot
• Under Armour could not remain in the Top 10 - last Spring was the first time being inside the top since Fall 2019
• Dr. Martens falls down to No. 9 (vs. No. 7 last year) while Birkenstock fell to No. 10 from No. 6
• Crocs moved up meaningfully—now the No. 6 brand—vs. 9 last Fall—the highest ranking ever
• Vans still No. 2 position but share slipped 500 bps to 11% vs. 16% last year
• Hey Dude made its debut as a top-ten footwear brand—ranking No. 8
Image Source: Crocs.com
Executive Summary Teen Behavior & Habits Teen Brand Preferences Demographics & Appendices
Taking Stock With Teens Survey - Fall 2021 Results | 47Top Fashion Trends Right Now
Upper-Income Teens, Female
SPRING 2020 FALL 2020 SPRING 2021 FALL 2021
1 Leggings / lululemon 25% 1 Leggings / lululemon 21% 1 Leggings / lululemon 23% 1 Leggings / lululemon 17%
2 Nike / Jordans 9% 2 Jeans 10% 2 Baggy / Saggy Pants 9% 2 Crop Tops 11%
3 Crop Tops 8% 3 Nike / Jordans 9% 3 Mom Jeans 8% 3 Jeans 11%
4 Jeans 7% 4 Crop Tops 8% 4 Nike / Jordans 7% 4 Baggy / Saggy Pants 10%
5 Ripped Jeans 4% 5 Baggy / Saggy Pants 4% 5 Crop Tops 6% 5 Nike / Jordans 8%
6 Scrunchies 3% 6 Oversized Tops 3% 6 Jeans 5% 6 Mom Jeans 5%
7 Vans 3% 7 Ripped Jeans 3% 7 Athletic Wear 3% 7 Hair Trends 3%
8 Brandy Melville 3% 8 Brandy Melville 2% 8 Ripped Jeans 2% 8 Athletic Wear 2%
9 VSCO 2% 9 Vans 2% Brandy Melville 2% 9 Converse 2%
10 Hoodies 2% 10 Athletic Wear 2% 10 Hair Trends 2% 10 Ripped Jeans 2%
Comfort 2%
• This unaided question goes to all teens to opine on top fashion trends for females in school
• While Leggings/lululemon is still the No. 1 trend (at 17%), Crop Tops gained 300 bps, moving from No. 4 to No. 2
• Denim trends continue to maintain significant mindshare with Jeans increasing 100 bps Y/Y, Ripped Jeans losing
share but still in Top 10, and Mom Jeans which entered last Spring and ranks currently at No. 6.
• Denim trends increased from 13% collectively in Fall ’20, to 15% in Spring ’21 and 18% in Fall ’21, supportive
of the latest denim cycle we have been tracking over the last 12-18 months.
• We continue to see significant influence from the 1990s—with baggy/pants taking No. 4 along with crop tops No. 2
• Nike/Jordans and athletic wear remain relevant—but ceded 100 bps from No. 3 to No. 5 while athletic wear increased
from No. 10 to No. 8
• Responses, “90’s Boyfriend Jeans and Baby Tees” and “Oversized T-Shirt and Leggings sum up the current trends
best
Executive Summary Teen Behavior & Habits Teen Brand Preferences Demographics & Appendices
Taking Stock With Teens Survey - Fall 2021 Results | 48Top Fashion Trends Right Now
Upper-Income Teens, Male
SPRING 2020 FALL 2020 SPRING 2021 FALL 2021
1 Nike / Jordans 14% 1 Nike / Jordans 15% 1 Nike / Jordans 15% 1 Nike / Jordans 18%
2 Athletic Wear 11% 2 Athletic Wear 8% 2 Athletic Wear 13% 2 Athletic Wear 9%
3 Vans 6% 3 Hoodies 6% 3 Flannels 8% 3 5" Inseam Shorts 6%
4 Jogger Pants 5% 4 5" Inseam Shorts 4% 4 Hoodies 8% 4 Short Shorts 5%
5 Supreme 5% 5 Shorts 4% 5 Shoes 4% 5 Shorts 5%
6 Adidas 5% 6 Short Shorts 4% 6 Sweat Shirts 3% 6 Hoodies 4%
7 Hoodies 4% 7 Jogger Pants 3% 7 Layering 2% 7 Hair Trends 3%
8 Khakis / Chinos 3% 8 Flannels 3% Jeans 2% Hats 3%
9 Leggings / lululemon 3% 9 Sweatshirts 3% 9 Shorts 2% 9 T-Shirts 3%
10 Flannels 3% 10 Vans 2% Baggy / Saggy Pants 2% 10 Baggy / Saggy Pants 3%
• Like the former question, this question goes to all teens to opine (unaided) on top fashion trends for males
• Mentions of Nike / Jordan take the No. 1 spot again and gains 300 bps of mindshare to 18%
• Athletic wear while still No. 2 moved to 9%, up 100 bps Y/Y but down 400 bps sequentially, likely due to the reopening
• Both “Short Shorts” and “5” Inseam Shorts” increased mindshare by 100 bps and 200 bps, respectively.
• Hoodies dropped from No. 3 to No. 6 (-200 bps Y/Y) while Jogger Pants, Flannels, and Sweatshirts fell out of the top 10
• Vans also dropped out of the Top 10
• Entering was Hair Trends and Hats at No. 7, and T-Shirts at No. 9
• Some hair trends included Perms, Mullets and “Pineapple Hair”, embodying the “eBoy” look en vogue
Executive Summary Teen Behavior & Habits Teen Brand Preferences Demographics & Appendices
Taking Stock With Teens Survey - Fall 2021 Results | 49Top Brands Starting To Be Worn
Upper-Income Teens
SPRING 2020 FALL 2020 SPRING 2021 FALL 2021
1 Champion 10% 1 Adidas 11% 1 Adidas 11% 1 Nike 13%
2 Adidas 10% 2 Champion 10% 2 Champion 9% 2 Adidas 11%
3 Nike 8% 3 Nike 10% 3 Nike 9% 3 Champion 8%
4 Vans 7% 4 Vans 5% 4 Vans 4% 4 Hollister 4%
5 American Eagle 5% 5 Hollister 4% 5 Under Armour 4% 5 Vans 4%
6 lululemon 5% 6 lululemon 4% 6 Hollister 4% 6 Under Armour 4%
7 Under Armour 4% 7 American Eagle 4% 7 American Eagle 3% 7 American Eagle 4%
8 Hollister 3% 8 Under Armour 3% 8 PacSun 2% 8 lululemon 3%
9 Ralph Lauren 3% 9 PacSun 2% 8 lululemon 2% 9 H&M 3%
10 Patagonia 2% 10 H&M 2% 10 Patagonia 2% 10 New Balance 2%
SPRING 2020 FALL 2020 SPRING 2021 FALL 2021
1 Brandy Melville 10% 1 SHEIN 7% 1 SHEIN 9% 1 PacSun 8%
2 lululemon 9% 2 PacSun 7% 2 PacSun 7% 2 Zara 7%
3 Champion 6% 3 lululemon 6% 3 lululemon 5% 3 American Eagle 6%
4 Urban Outfitters 5% 4 American Eagle 6% 4 Zara 5% 4 lululemon 6%
5 American Eagle 5% 5 Brandy Melville 6% 5 Urban Outfitters 4% 5 SHEIN 6%
6 PacSun 5% 6 Nike 5% 6 Brandy Melville 4% 6 Nike 5%
7 Adidas 4% 7 Hollister 4% 7 American Eagle 4% 7 Urban Outfitters 4%
8 Vans 3% 8 Champion 3% 8 Name Withheld 4% 8 Brandy Melville 4%
9 Nike 3% 9 Urban Outfitters 3% 9 Nike 3% 9 Hollister 3%
10 Free People 2% 10 H&M 2% 10 Champion 3% 10 Garage 3%
Name Withheld 2%
SHEIN 2%
Executive Summary Teen Behavior & Habits Teen Brand Preferences Demographics & Appendices
Taking Stock With Teens Survey - Fall 2021 Results | 50Top Brands No Longer Worn
Upper-Income Teens
SPRING 2020 FALL 2020 SPRING 2021 FALL 2021
1 Under Armour 23% 1 Under Armour 22% 1 Under Armour 17% 1 Under Armour 23%
2 Adidas 12% 2 Adidas 12% 2 Adidas 12% 2 Adidas 11%
3 Nike 10% 3 Nike 12% 3 Gap 11% 3 Nike 9%
4 Gap 8% 4 Gap 7% 4 Nike 9% 4 Gap 7%
5 Reebok 4% 5 Puma 5% 5 Puma 4% 5 Skechers 6%
6 Puma 4% 6 Reebok 4% 6 Skechers 4% 6 Reebok 5%
7 Hollister 3% 7 Hollister 3% 7 Hollister 4% 7 Champion 4%
8 Skechers 3% 8 Skechers 3% 8 Reebok 4% Puma 4%
9 Champion 2% 9 Champion 3% 9 Old Navy 3% 9 Hollister 3%
10 Old Navy 2% 10 Ralph Lauren 2% 10 Champion 3% 10 Vineyard Vines 3%
SPRING 2020 FALL 2020 SPRING 2021 FALL 2021
1 Justice 30% 1 Justice 26% 1 Justice 20% 1 Justice 26%
2 Aeropostale 8% 2 Hollister 8% 2 Hollister 12% 2 Hollister 9%
3 American Eagle 6% 3 Forever 21 7% 3 American Eagle 10% 3 Gap 6%
4 Hollister 6% 4 American Eagle 6% 4 Forever 21 7% 4 American Eagle 5%
5 Victoria's Secret 5% 5 Aeropostale 6% 5 Gap 6% 5 Adidas 5%
6 Adidas 5% 6 Gap 5% 6 Old Navy 4% 6 Old Navy 4%
7 Under Armour 4% 7 Adidas 5% 7 Abercrombie & Fitch 4% Aeropostale 4%
8 Gap 4% 8 Old Navy 4% 8 Aeropostale 4% 8 Forever 21 4%
9 Old Navy 4% 9 Abercrombie & Fitch 4% 9 Brandy Melville 4% 9 Under Armour 3%
10 Abercrombie & Fitch 4% 10 Victoria's Secret 3% 10 Adidas 3% 10 Nike 3%
Executive Summary Teen Behavior & Habits Teen Brand Preferences Demographics & Appendices
Taking Stock With Teens Survey - Fall 2021 Results | 51Favorite Handbag Brands
All Female Teens
SPRING 2020 FALL 2020 SPRING 2021 FALL 2021
1 Michael Kors 25% 1 Louis Vuitton 19% 1 Louis Vuitton 18% 1 Michael Kors 18%
2 Louis Vuitton 16% 2 Michael Kors 18% 2 Michael Kors 16% 2 Louis Vuitton 16%
3 Kate Spade 12% 3 Coach 13% 3 Kate Spade 14% 3 Coach 14%
4 Coach 12% 4 Kate Spade 12% 4 Coach 13% 4 Kate Spade 12%
5 Gucci 6% 5 Gucci 6% 5 Gucci 6% 5 Gucci 6%
6 Chanel 4% 6 Chanel 5% 6 Chanel 5% 6 Chanel 5%
7 Vera Bradley 3% 7 Vera Bradley 3% 7 Prada 4% 7 Prada 3%
8 Steve Madden 2% 8 Prada 3% 8 Vera Bradley 3% 8 Vera Bradley 2%
9 Guess 2% 9 Steve Madden 1% 9 Guess 1% 9 Nike 2%
10 Prada 1% 10 Target 1% 10 SHEIN 1% 10 Dior 1%
Tommy Hilfiger 1%
• Handbag spending improved to $96—up 10% Y/Y and up 3% sequentially, reversing a multi-year low
• Michael Kors regained the No. 1 spot, maintaining 18% mindshare, from Louis Vuitton who slid to No. 2 and lost 300
bps from 19% to 16%.
• Tapestry was the most relevant portfolio company in our coverage capturing 26% of total vote vs 25% LY
• Kate Spade steadies at No. 4 with 12% share while No. 3 Coach had 14% collective mindshare—up 100 bps Y/Y
• Gucci the No. 5 brand and Chanel at No. 6 have remained stable for four consecutive surveys
• Prada has had a notable acceleration in our data—moving from No. 10 in Spring ’20 to No. 8 last Fall and now at No. 7
• SHEIN drops out of the top 10 to No. 17 after just entering and is replaced by Dior with 1% share
• Nike surprisingly entered the Top 10 as well at No. 9, likely due to the popular trend of crossbody fanny packs
Executive Summary Teen Behavior & Habits Teen Brand Preferences Demographics & Appendices
Taking Stock With Teens Survey - Fall 2021 Results | 52Accessible Luxury Makes Slight Rebound
• We are seeing a leveling off of accessible luxury brand mindshare, albeit slightly up Y/Y at 44% share
• Tapestry was the most relevant portfolio—26% of total vote
• Capri Holdings (received votes for Michael Kors & Versace) held a collective vote of 18% and the No. 1 ranking
• In Fall 2021, 22 luxury brands were listed in our survey representing 34% mindshare
• Luxury mindshare moved down 300 bps from Spring and 200 bps Y/Y; LV, Gucci, Chanel, Prada, and Dior in top-ten
• Secondary platforms are increasingly a way for brands to access luxury brands and include The RealReal, Poshmark,
Depop and StockX among others
• For the first time since Spring 2018, Accessible Luxury has gained share and Luxury brands ceded share.
Executive Summary Teen Behavior & Habits Teen Brand Preferences Demographics & Appendices
Taking Stock With Teens Survey - Fall 2021 Results | 53You can also read