Taking Stock With Teens - 21+ Years Of Researching U.S. Teens GenZ Insights SPRING 2022 - Piper Sandler
←
→
Page content transcription
If your browser does not render page correctly, please read the page content below
SPRING 2022

Taking Stock
With Teens                  ®

21+ Years Of Researching U.S. Teens
GenZ Insights

Investment Risks

Risks to achievement of investment objectives include, but are not limited to, the following:
   •   Reliance on key top management
   •   Changing consumer preferences
   •   Changes in input costs and raw materials
   •   Markdown risks
   •   Product flow and inventory disruptions
   •   Competition
   •   Lack of pricing power
   •   Deleveraging of fixed expenses
   •   Foreign exchange rate risk
   •   General macroeconomic uncertainty

Table Of Contents

01                   02                      03                       04
Executive            Teen Behavior &         Teen Brand               Demographics &
Summary              Habits                  Preferences              Appendices

• Demographics       • Gen Z Insights        • Historic No. 1 Ranks   • Survey Demographics
• Key Takeaways      • Top Social Media      • Apparel & Footwear     • Spending Breakdown
• Stock Highlights   • Spending Trends       • Top Fashion Trends       & Channel Trends

                     • Channel Preferences   • Up- & Downtrending     • Top Brand Time Series

                     • Secondhand & Rental   • Accessories            • Top Athletic Brands

                     • Athletic Preference   • Beauty                 • Social Media History

                     • Content Consumption   • Websites               • Content Consumption
                                                                        History
                     • Video Games           • Restaurants
                                                                      • Meet Our Senior
                     • Payment Preferences   • Snacks                   Analyst Team
                     • Crypto, NFTs,         • Plant-Based Meat       • Stock Callouts & Price
                       Metaverse                                        Targets
                     • Smartphone Trends
43rd Semi-Annual Proprietary GenZ Research Project
                                                                                                                                                        2%

   7,100
      TEENS SURVEYED
                                                                                         16.2    AVERAGE AGE

    44                              U.S.
                                    STATES
                                                                                                                       54%
                                                                                                                                                             44%

    $69,298
      AVERAGE HOUSEHOLD INCOME
                                                                                                                      45%                                    22%

                                                                                                                                                             21%

    39%
Survey is executed in partnership with DECA
                                                        TEENS CURRENTLY
                                                        PART-TIME EMPLOYED

The source for all charts/tables within this report is Piper Sandler.
                                                                                                                                                             12%

                  Executive Summary                                     Teen Behavior & Habits          Teen Brand Preferences   Demographics & Appendices
Key Takeaways – Demographics & Spending
This Spring, we captured >1.7 million new data points on this all-important GenZ; we now have >54M data points around teen
preferences and spending in the 21+ years of researching teens:
• Our 43rd semi-annual Taking Stock With Teens survey was conducted between February 16 and March 22
• Regional responses were 45% in the South, 22% in the West, 21% in the Midwest and 12% in the Northeast
• 39% of teens hold a part-time job – up from 38% last Fall and 33% in Spring 2021
• Teen “self-reported” spending improved to $2,367 or +4% sequentially & 9% Y/Y; parent contribution was 60% vs 61% last Fall
• Females led the increase in spending, with all female spend +9% Y/Y led by clothing +15% and footwear +16%
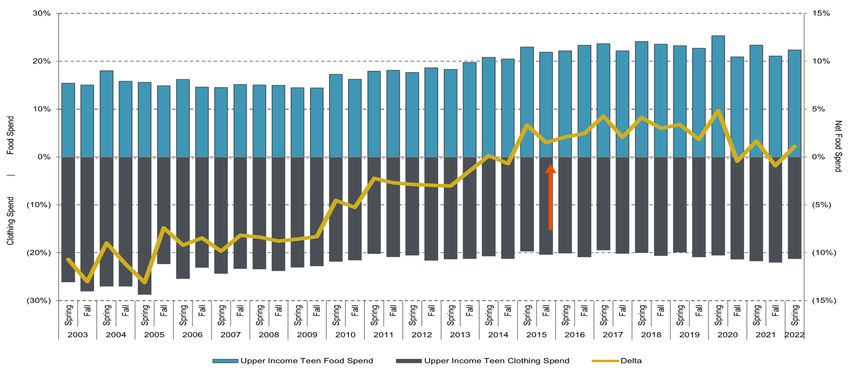
• Food returns as upper income teens’ No. 1 wallet priority at 22% share, up from 21% in Fall 2021 but down from 23% LY
• Teens allocate 7% of their shopping time to secondhand; 46% of teens have purchased & 56% have sold secondhand
• The core beauty wallet (cosmetics, skincare, fragrance) stood at $264/year, up 10% Y/Y and led by Fragrance (+33% Y/Y)
• Skincare held the highest priority of spending in the beauty wallet at $107, followed by Cosmetics at $94 and Haircare at $90
• 60% of females read ingredients in beauty products. 88% would pay more for “clean” and 58% would pay more for “science-
backed”
• For payment apps, Apple Pay ranked first, partly due to 87% of teens in the survey saying they have an iPhone
• PYPL’s Venmo ranked #2 (with the PayPal app #4), behind Apple Pay among payment apps used in the last month while SQ’s
Cash App ranked #3
• For buy now pay later (BNPL), teens said they used PayPal “Pay in 4” most frequently, followed by SQ’s Afterpay
• Cash is the most penetrated payment method, with 89% of teens saying they used cash in the past month vs 83% LY
• While 26% of teens own a VR device, just 5% use it daily; 48% of teens are either unsure or not interested in the Metaverse
Executive Summary Teen Behavior & Habits Teen Brand Preferences Demographics & Appendices
Key Takeaways – Brand & Preference Rankings
•    53% of teens cite Amazon as their No. 1 favorite e-com site (-300 bps Y/Y); importantly, Amazon decreased from 47% share to
     35% Y/Y among upper income females
•    Nike is the No. 1 apparel brand for teens & LULU gains 300 bps Y/Y; Nike is the No. 1 footwear brand—up 400 bps Y/Y
•    Athletic brands mindshare accounted for 44% of teens’ favorite apparel brand – the most ever in our survey by 300 bps
•    Crocs increased from the No. 8 preferred footwear brand to No. 6 while Hey Dude is in the top 10 for 2 consecutive surveys
•    Vans lost 400 bps of mindshare as a favorite footwear brand and 600 bps of share among upper income teens
•    e.l.f. rose to the No. 1 preferred makeup brand for all teens for the first time – gaining 300 bps Y/Y and displacing Maybelline
•    Ulta remained the No. 1 preferred beauty destination with 48% mindshare (46% LY) while Sephora remained at No. 2 and ceded
     400 bps of share
•    Olaplex was the No. 1 preferred haircare brand among females with 11% mindshare and 15% share among UI females
•    Chick-Fil-A is No. 1 restaurant; Chipotle No. 3 gained 300 bps of share to 8% (vs. 5% LY); Starbucks remained No. 2 at 11%
     mindshare
•    Teens interest in plant-based meat is slipping; 43% consume or are willing to try it, down from 49% in Spring 2021
•    87% of teens own an iPhone and 87% expect an iPhone to be their next phone; 72% of teens already have AirPods
•    Teens spend 30% of their daily video consumption on Netflix and YouTube (both 30%); HBO Max gained share
•    TikTok is the favorite social media platform (33% share) surpassing Snapchat for the first time (31%); Instagram was again third
     (22%)
•    Russia’s invasion of Ukraine was the most important political or social issue – combining gas prices and inflation results in 14%
     mindshare, enough to displace the Russian/Ukraine situation

             Executive Summary             Teen Behavior & Habits          Teen Brand Preferences         Demographics & Appendices
Brand Highlights: Global Lifestyle Brands
Nike (+) SOLIDIFIES ITS NO. 1 RANK; CONVERSE ON THE RISE
Nike remains the No. 1 brand for teens in apparel—having held this spot for 11 consecutive years. This Spring, it
captured 30% of teen votes. As a preferred footwear brand (ranked No. 1), it widened its margin +400 bps Y/Y
capturing 60% of the vote as Converse displaced Vans as the No. 2 footwear brand. Nike also increased
mindshare among males for their preferred footwear brand and increased share to 63% from 59% Y/Y. Also,
Nike/Jordan is the No. 1 Fashion trend among males.
Crocs (+) REMAINS AT HIGHEST LEVEL IN TEEN SURVEY
Crocs was the No. 6 preferred footwear brand this Spring—up from No. 8 last year and compares to No. 6 last
Fall. This is particularly impressive given Nike gained 400 bps Y/Y within footwear. Crocs ranked No. 7 for upper-
income teens while Hey Dude was the No. 9 preferred footwear brand. Among all females, Crocs ranked No. 5
for preferred footwear brand with Hey Dude at No. 7. Crocs was the No. 8 preferred footwear brand for UI males
OW, PT $246 and females.
Lululemon (+) RISES AS FASHION & ATHLETIC BRAND
lululemon was the No. 3 preferred apparel brand for teens vs No. 4 LY—ranking No 3 among average-income
teens and No. 2 for upper-income teens. It pulled away as the No. 1 brand for upper-income females this year
with 14% share, up 400 bps Y/Y. It, along with leggings, remains the “top trend” for females by a wide margin.
lululemon is the No. 2 athletic brand for upper-income teens and increased to the No. 2 preferred athletic brand
for average-income teens Y/Y from No. 3.
AKA (+) PRINCESS POLLY - THIRD FAVORITE ONLINE SHOPPING DESTINATION FOR FEMALES
Princess Polly increased to third favorite online shopping destination for female upper-income teens compared
to seventh favorite in Fall 2021 and fifth favorite in Spring 2021. We think this points to increased brand
awareness and reflects the brand’s relevance with the female GenZ consumer. Princess Polly ranked ahead of
notable brands such as lululemon, American Eagle, and Urban Outfitters among the female upper-income
OW, PT $15
cohort. Princess Polly made up 62% of AKA’s revenue in 2020.
Executive Summary Teen Behavior & Habits Teen Brand Preferences Demographics & AppendicesStock Highlights: Beauty & Wellness
Korinne Wolfmeyer, Assistant Vice President | Sr. Research Analyst
EL (+/-) OVERALL BEAUTY SPEND UP, BUT SOME BRANDS ARE SEEING SHARE LOSS
Cosmetics spend was +10% Y/Y and fragrance spend was +33% Y/Y; this plays well for EL, with fragrance
making up ~12% of sales and cosmetics making up ~26% of sales. Skincare (~60% of sales for EL) was flat
Y/Y in our survey. On the cosmetics side, EL’s Too Faced brand dropped three slots from the Fall to the No. 8
preferred makeup brand, while MAC dropped one slot to No. 9. On the skincare side, Clinique dropped one slot
OW, PT $380 to No. 6, though The Ordinary jumped one slot to No. 3, which is the highest level seen in our survey.
ELF (+) BUMPS UP TO NO. 1 MAKEUP BRAND AND MAINTAINS NO. 13 SKINCARE BRAND RANKING
e.l.f. rose to the No. 1 preferred makeup brand for all teens for the first time in our survey – gaining 300 bps
share Y/Y. Maybelline slid into the No. 2 spot. e.l.f. also rose to No. 3 among upper-income teens (vs. No. 4 in
the Fall), and it maintained its No. 1 position among average-income teens for the third survey in a row, but
gained 300 bps share Y/Y. On the skincare side, e.l.f. maintained its No. 13 position from the Fall and 1%
N, PT $32 mindshare.
OLPX (+) NO. 1 HAIRCARE BRAND
Olaplex came in as the No. 1 preferred haircare brand among female teens with 11% mindshare. The brand
did even better for upper-income female teens at 15% mindshare. SheaMoisture consistently ranked No. 2
among both income groups at 9% mindshare overall, while Dove and Pantene came in at No. 3 and No. 4.
Only a few other brands known for their bond-building capabilities showed up in our survey farther down in the
OW, PT $36 rankings (OGX, Redken) making us feel good about the competitive landscape for Olaplex among Gen Z.
ULTA (+) GROWS SHARE EVEN AS DIGITAL BEAUTY PURCHASES INCREASE
Ulta remained the No. 1 preferred beauty destination with 48% mindshare—up from 46% last year. Sephora
ranked No. 2 at 20% share—down 400 bps Y/Y and down 100 bps sequentially. Too, Target was the No. 3
preferred beauty destination at 9% mindshare—further giving us confidence in the importance of the
Ulta/Target partnership. This is all despite teen preference for in-store purchases slowing down a bit
OW, PT $475 sequentially (100 bps) and Amazon gaining 100 bps in mindshare for favorite beauty shopping destinations.
Executive Summary Teen Behavior & Habits Teen Brand Preferences Demographics & AppendicesStock Highlights: Packaged Food
Michael Lavery, Director | Sr. Research Analyst
GIS (+) TEENS REPORT STRONG INTENTIONS TO CONSUME MORE NATURE VALLEY
Of those who listed Nature Valley as their favorite snack brand, net 78% of teens plan to eat more or the same
amount of it over the next six months (% planning to eat more + same – less), the highest amount for any
brand. Among large brands, it had more than a third more teens (~20%) planning to eat more of it than the
average of other large brands (~14%).
OW, PT $75
CPB (+) TEENS REPORT STRONG INTENTIONS TO CONSUME MORE GOLDFISH
Campbell’s Goldfish was the most preferred snack brand by teens, maintaining its position from our Fall 2021
survey, with 11% of teens listing it as their favorite. Also, net ~72% of teens who listed Goldfish as their favorite
brand plan to eat more or the same amount of it over the next six months (% planning to eat more + same –
Neutral, PT $45 less), which was third highest among the large preferred snack brands, second only to Nature Valley and Clif.
BYND (-) TEENS ARE LESS WILLING TO TRY PLANT-BASED MEAT
Impossible was the most preferred plant-based brand among teens with a plant-based brand preference
(39%), followed by Beyond Meat (32%). Younger consumers also appear less open to trying plant-based meat
than in our prior surveys. Of the teens we surveyed, 43% either consume or are willing to try plant-based meat,
UW, PT $29 down from 47% in our Fall 2021 teen survey and down from 49% in Spring 2021. Of the teens who do not
consume plant-based meat, 34% are willing to try it, down from 38% in our Fall 2021 survey.
Executive Summary Teen Behavior & Habits Teen Brand Preferences Demographics & AppendicesStock Highlights: Restaurants & Branded Hospitality
Nicole Miller Regan, Managing Director | Sr. Research Analyst
CMG (+) SEQUENTIALLY STRONGER BRAND SCORES
Chipotle jumped to second most preferred brand among Upper Income teens (mindshare increased to 14% vs. 10%
in Fall 2021 vs. 11% in Spring 2021); notably the brand’s highest ranking since Spring 2016. Chipotle experienced
steady Y/Y mind share levels among Average Income teens (#4 at 5% in Spring 2022 vs #3 at 5% in Spring 2021 vs.
#4 at 5% in Spring 2020 vs. #6 at 3% in Fall 2019) which was within the brand’s historical range. We believe gaining
mindshare among Average Income teens represents the largest opportunity as the company’s marketing efforts aid
overall awareness. Chipotle continues to be most preferred at Hispanic cuisine level across both Upper and Average
OW, PT $2,500
income teens.
SBUX (=) REMAINS MOST PREFERRED PUBLIC COMPANY BRAND AMONG ALL TEENS
Starbucks experienced sequentially stronger mindshare among Upper Income teens (up to 13% vs. 11% mindshare
in Fall 2021 vs. 12% mindshare in Spring 2021) while notably ceding its prior position as the second most preferred
brand to Chipotle. Despite seeing sequential strength we note that the brand’s overall preference remains muted vs.
historical peak levels (18% Fall 2013 & Spring 2007; 16% Spring 2008; 15% Fall 2014 & Spring 2009 & Fall 2007).
Among Average Income teens, Starbucks maintained its No. 2 spot (with 11% mindshare vs. 10% in Fall 2021 vs.
10% in Spring 2021, 9% in Fall 2020, 8% in Spring 2020, and 10% in Fall 2019). We continue to view Starbucks’
N, PT $100 brand equity as relevant social currency and note it is the most preferred brand at the coffee cuisine level.
MCD (+) REMAINS TOP 5 BRAND OVERALL; MINDSHARE TICKS HIGHER SEQUENTIALLY
McDonald’s maintained a top 5 brand ranking among both Upper and Average Income teens while experiencing
sequential improvement in mindshare to #4 (at 4%) among Upper Income teens (as compared to #5 at 3% in Fall
2021) and steady at #3 (with sequentially higher mindshare of 7% vs. 5% in Fall 2021) among Average Income
teens. McDonald’s continues to be most preferred within the Hamburger cuisine category. Looking forward, we
believe the brand’s ongoing efforts to drive heightened levels of digital engagement could help to drive incremental
OW, PT $250 traction with teens.
Executive Summary Teen Behavior & Habits Teen Brand Preferences Demographics & AppendicesStock Highlights: Semiconductors & Financial Technology
Harsh Kumar, Managing Director | Chris Donat, Managing Director
AAPL (+) Share Remains Near Record Levels as 5G Cycle Continues (covered by Harsh Kumar)
Both the 87% iPhone ownership and 87% intention to purchase an iPhone metrics remain near record highs for
our survey. We view the elevated penetration and intention are important for a maturing premium smartphone
market. In addition, these trends are encouraging as the company continues to introduce new 5G iPhones,
which continues to provide a significant product cycle refresh. We think these positive trends can also be a
catalyst for further services growth, as the install base for Apple hardware continues to grow.
OW, PT $200
PYPL (+) HIGHLY RANKED PAYMENTS APPS AND LEADING BNPL (covered by Chris Donat)
We think PayPal’s strong ranking with teens for payments (both Venmo and PayPal) and leading spot for buy
now pay later (Pay in 4) positions PYPL for future market share gains and payment volume growth. PYPL’s
Venmo ranked #2 behind Apple Pay with teens who have used a payment app in the last month. We think
OW, PT $185 PYPL can leverage its strength with teens to attract more merchants to its platform and move into social
commerce.
SQ (=) TRAILING PYPL IN BOTH PAYMENTS AND BNPL (covered by Chris Donat)
The penetration rate of Block’s Cash App trails Venmo by 6 ppt for monthly usage. And the recently closed
Afterpay buy now pay later (BNPL) acquisition lags PayPal “Pay in 4” by 4 ppt. We think SQ is a key
company to watch for how well it can combine its payments business with BNPL.
N, PT $130
Executive Summary Teen Behavior & Habits Teen Brand Preferences Demographics & AppendicesStock Highlights: Internet
Tom Champion, Director
SNAP (+) STILL DOMINANT AMONGST TEENS (covered by Tom Champion)
SNAP fell to the #2 favorite social app among 31% of teen respondents, surpassed by TikTok for the first time
(33%) and ending SNAP’s streak at #1. While the TikTok insurgency is fairly clear, we are still confident in
Snap’s popularity given it’s a close #2 favorite and consistent with prior surveys. SNAP was again #2 for
OW, PT $53 engagement behind Instagram, but improved 700 bps from Fall ’21 at 84%. We’ve noted users check the app
30x a day on average. Also, it’s worth noting 30% of teens have purchased an item directly from a social media
site, up 28% & 26% from the prior two surveys. We view SNAP as well positioned to capitalize on social e-
commerce going forward.
AMZN (+) CONTINUES TO BUILD ON MARKET LEADERSHIP (covered by Tom Champion)
AMZN is again the most widely used retailer among teens, improving to 53% of respondents saying AMZN is
their favorite online retailer from 52% in Fall ‘21 (compared to Shein at 8%). This is down 300 bps from Spring
2021 but up 100 bps from last Fall. The category dominance in the teen segment is underappreciated, in our
view. Prime household adoption rate was strong, with 86% of U.S. households having a Prime subscription, in-
OW, PT $3,900 line with Spring ’21. Prime adoption and the maturation of the teen cohort should serve as a powerful tailwind
for many years to come.
Executive Summary Teen Behavior & Habits Teen Brand Preferences Demographics & AppendicesStock Highlights: Infrastructure & Communication Software
Jim Fish, Director
AKAM (+/-) SHOPPING AND STREAMING UP, BUT GAMING DOWN (covered by James Fish)
The Akamai network is the largest, most distributed architecture in the space. Positively, teens are increasing
their viewing of streaming services that are Akamai customers, continuing to download online games, and
viewing of websites / e-commerce is strong. However, metrics for gaming (hours spent gaming, new console
purchasing, percentage of games downloaded etc.) all remain compressed compared to peak COVID-19
levels. Given Akamai holds the “lion’s share” of gaming traffic according to our CDN Times report, Akamai is
N, PT $121 the most exposed CDN vendor to the moderating gaming cycle. With mixed results and no clear catalyst in the
name, we remain on the sidelines and await a better entry point on Akamai.
FIVN (+) TELEPHONY REMAINS THE CHANNEL OF FOCUS FOR TEENS (covered by James Fish)
Contact centers are becoming the main interaction point with end-consumers, including teens. Five9’s platform
can help contact centers (be it human or bot) service and better engage with teens that can drive a better
customer experience and a returning customer. Teens continue to prefer a live phone call more than other
channels, but also were more open to newer communication channels like SMS messaging & live chat. While
industry estimates call for agent declines, the low acceptance of bots today gives us confidence TAM
estimates for the space are too conservative. As one of the best pure-plays in the market, we find the results a
OW, PT $163
positive for Five9.
Executive Summary Teen Behavior & Habits Teen Brand Preferences Demographics & AppendicesTeen Behavior & Habits
E-Commerce
Social Media & Content
Key Themes,
Trends &
Takeaways
Food & Snacks Payment & Crypto
Fashion & Beauty Video Games
Executive Summary Teen Behavior & Habits Teen Brand Preferences Demographics & AppendicesGenZ Insights: They Actually Care About The World
Most Important Political & Social Issues
FALL 2020 SPRING 2021 FALL 2021 SPRING 2022
1 Racial Equality 19% 1 Racial Equality 20% 1 Environment 15% 1 Russia/Ukraine Invasion 13%
2 Environment 9% 2 Environment 12% 2 Racial Equality 13% 2 Environment 11%
3 Black Lives Matter 8% 3 Black Lives Matter 6% 3 Afghanistan 6% 3 Racial Equality 10%
4 2020 Election / Voting 7% 4 Coronavirus 5% 4 Coronavirus 6% 4 Gas Prices 10%
5 Coronavirus 6% 5 Equality 5% 5 Abortion 5% 5 Inflation 4%
6 Abortion 5% 6 Abortion 5% 6 Joe Biden 3% 6 Abortion 3%
7 Equality 5% 7 Immigration 3% 7 Economy 3% 7 LGBTQ+ Rights 3%
8 Immigration 2% 8 Economy 3% 8 Women's Rights 3% 8 Economy 2%
9 Police Brutality 2% 9 Joe Biden 2% 9 Gas Prices 3% 9 Equality 2%
10 Gun Control 2% 10 Gun Control 2% 10 LGBTQ+ Rights 2% 10 Women's Rights 2%
• We started asking teens to “name a political or social issue that is important” to them for the first time in Fall 2019
• GenZ is unique in that they appear to care more about social justice & the environment versus former generations,
however this year the Russian invasion of Ukraine rose to their No. 1 concern
• Gas Prices entered the top 10 last Fall and rose from No. 9 to No. 4 this Spring; Gas Prices & Inflation combined
result in 14% mindshare, enough for the No. 1 spot despite a generational event underway
• Coronavirus-related concerns fell off the list along with Afghanistan and Joe Biden
• The Environment remains in the top 2 consistently, boding well for rental services like RENT and resale services like
TDUP and The RealReal
Executive Summary Teen Behavior & Habits Teen Brand Preferences Demographics & AppendicesGenZ Insights...The Who’s Who?
Who They Like & Who They Follow
Favorite Celebrities Favorite Social Media Personalities
1. Ryan Reynolds 1. Emma Chamberlain
2. Zendaya 2. Kanye West
3. Kanye West 3. Dwayne “The Rock” Johnson
4. Dwayne “The Rock” Johnson 4. Zendaya
5. Taylor Swift 5. JiDion
6. Adam Sandler 6. Kevin Hart
7. Kevin Hart 7. Mr. Beast
8. Tom Holland 8. Danny Duncan
9. LeBron James 9. Lebron James
10. Harry Styles 10. Markiplier
• Ryan Reynolds moved up from No. 2 in the Fall to the top celebrity taking the spot from Adam Sandler while Zendaya,
previously No. 7, was the teens’ 2nd favorite celebrity. Kevin Hart fell from No. 3 to No. 7, and Harry Styles fell from No.
8 to No.10.
• Emma Chamberlain held her spot as Top Social Media Personality. Kanye West moved up from No. 8 to No.2. Kylie
Jenner, David Dobrik, and Charli D’Amelio fell from the Top 10 while Zendaya, JiDion, and Markiplier made their debut.
Executive Summary Teen Behavior & Habits Teen Brand Preferences Demographics & AppendicesTikTok Takes Lead As Favorite; Instagram Most Used
Favorite Social Media Platform
Highest Social Media Engagement
• TikTok (33%) surpassed Snapchat (31%) as the favorite teen app for the first time ever, while Instagram followed again in 3rd.
• Instagram continues to lead the pack in monthly usage at 89%, followed by Snapchat at 84% and TikTok at 80%.
• When asked, the average teen in our survey spends ~4.2 hours per day on social media (roughly in-line with past surveys).
Executive Summary Teen Behavior & Habits Teen Brand Preferences Demographics & AppendicesWhat’s In Your Wallet? Food, Video Games & Clothing
Upper-Income Teens
Males’ Wallet Share Females’ Wallet Share
1 Food 23% 1 Clothing 29%
2 Clothing 16% 2 Food 22%
3 Video Games/Systems 14% 3 Personal Care 11%
• Food remains the most important category for male spending and remains flat on a Y/Y basis
• Video Games fell from No. 2 in the male wallet last Spring at 16% to No. 3—losing 200 bps of share
• Clothing increased from No. 3 to No. 2 with 16% share for males—flat Y/Y
• Clothing remains the top-choice within the wallet for females, steady at 29% share the last three surveys; Food
stayed at No. 2, but decreased 200 bps Y/Y
• Personal care remained the No. 3 wallet choice for females at 11%
Executive Summary Teen Behavior & Habits Teen Brand Preferences Demographics & Appendices•
Annual Teenage Spend Per Year All Teens
$2,200
$2,400
$2,600
$2,800
$3,000
$3,200
$2,000
teens ages 13-19
Spring 2005
Executive Summary
Fall 2005
Spring 2006
$3,023
Fall 2006
Peak Spend
Spring 2007
Fall 2007
Spring 2008
Fall 2008
Spring 2009
Fall 2009
Spring 2010
Fall 2010
Spring 2011
Teen Behavior & Habits
Fall 2011
Spring 2012
Fall 2012
Spring 2013
Fall 2013
Spring 2014
Fall 2014
Spring 2015
Fall 2015
Spring 2016
Fall 2016
Teen Brand Preferences
Spring 2017
Fall 2017
Teen Spending Up 9% Y/Y, Up 4% Vs. Fall 2021
Spring 2018
Fall 2018
Spring 2019
Fall 2019
Spring 2020
Fall 2020
Trough
Spring 2021
Fall 2021
Spring 2022
$2,367
Demographics & Appendices
Teens self-reported spending ~$2,367 per year in our survey, implying total teen spending of ~$66B, assuming 27.7MFemale Spend Provides Support Of Fashion Cycle
Upper Income Female Spend – Apparel, Footwear and Accessories
$1,500
$1,400
$1,300
+14% Y/Y
$1,178
$1,200
$1,100
$1,000
$900
• We are encouraged by the growth of Female fashion spend, which was up 14% Y/Y and grew across all three
categories - +15% for Apparel, +15% for Footwear and +7% for Accessories
• Apparel and Footwear are at their highest levels since Spring 2019 while Accessories is at its pre-pandemic levels
Executive Summary Teen Behavior & Habits Teen Brand Preferences Demographics & AppendicesClothing Remains At Highest Level Of Female Wallet Since 2013
Upper-Income Females
• Among upper-income females, the wallet share for clothing, while flat Y/Y, has maintained its share at 29% -- the
highest levels for Spring since 2013. This is up 280 bps vs 2LY and a 390 bps gain after stagnating at ~25% from
Spring 2017-2019.
Executive Summary Teen Behavior & Habits Teen Brand Preferences Demographics & AppendicesWomen Now Lead Digital Shift
Upper-Income Teens
95%
90%
91%
70%
Female Male
50%
• When asked if teens shop online, until 2020 (outside of a single instance in Spring 2013), digital shopping had higher
penetration with men vs. women
• In Fall 2020, digital penetration for the ladies came in neck-and-neck with the guys at 90% - last Spring, the digital
penetration rate for females accelerated substantially, outpacing the males at 96% vs. 92%
• While the gap closed last Fall, females widened the gap above men with 95% digital penetration vs. males at 91%
Executive Summary Teen Behavior & Habits Teen Brand Preferences Demographics & AppendicesShopping Channel Preference
Upper-Income Teens
• Specialty retail is the most prominent channel for teens—with 28% of their time spent in this channel. Specialty was down
200 bps Y/Y, but is still materially higher than the pre-COVID average of ~24%
• Of importance, we changed the aided examples for "Specialty" in the question last Spring, from “Express, Abercrombie,
Gap” to “Pacsun, American Eagle, Hollister”, which we believe might have skewed the data
• Online dropped share to 21% from 22% last Spring and 24% Spring 2019—this could be tied to consumer eagerness to
be in store again
• Dept Stores and Secondhand both lost 100 bps of share Y/Y while Outlet and Discount Stores both gained 100 bps Y/Y
Executive Summary Teen Behavior & Habits Teen Brand Preferences Demographics & AppendicesSecondhand Market Adoption Sold Secondhand Clothes
66% 62%
Upper-Income Teens 62%
58% 60% 55% 57% 58%
56%
53% 52% 55%
% of UI Teens Who Have Tried a Secondhand eCom Platform
46%
41%
40% 40%
Female Male Overall
Secondhand Ranks
Fall 2020 Spring 2021 Fall 2021 Spring 2022
#14
Favorite Brand/Retailer
18% 19% 19%
19%
Purchased Secondhand Clothes
63% 62%
66%
60%
37%
46% 47%
51%
46%
When Aggregated* 31% 34%
36%
Male Female
Female Male Overall
Fall 2020 Spring 2021 Fall 2021 Spring 2022
Fall 2020 Spring 2021 Fall 2021 Spring 2022
• We asked teens about their activity on popular Secondhand Marketplaces, including Poshmark, The RealReal, Tradesy,
thredUp, Mercari, and Depop – above, Upper Income teen participation on these platforms is charted.
• Secondhand marketplace activity has remained relatively stable, with UI males remaining at 19% penetration and UI
females moving to 40% penetration from 41% in Fall 2021.
• 46% of UI teens have PURCHASED clothes secondhand (either a marketplace or a thrift store) & 56% have SOLD
clothes secondhand with female engagement higher than male at 60% vs. 52%.
Executive Summary Teen Behavior & Habits Teen Brand Preferences Demographics & Appendices
*includes mentions for Thrift/Consignment Stores, Goodwill, Platos Closet and Park Avenue ThriftRental Market Appetite
Upper-Income Teens
Would You Pay a Monthly Fee For a Rent-and-Return Retail Service?
39%
37%
31% 31%
30%
26%
25%
22%
Male Female
Fall 2020 Spring 2021 Fall 2021 Spring 2022
• Appetite from UI teens for a rent-and-return service to keep wardrobes fresh was consistent Y/Y but down sequentially
with 31% female acceptance and 25% male acceptance
Executive Summary Teen Behavior & Habits Teen Brand Preferences Demographics & AppendicesAthletic Apparel Trending Upward
Aggregate Athletic Mindshare As Favorite Apparel Brand - Upper-Income Teens
50%
45% 44%
41%
40% 39%
37% 37% 38% 38%
Average = 26% 36%
35% 35%
35% 33% 34%
32%
30% 28%
26%
25%
20%
15%
10%
5%
0%
• 44% of preferred apparel brands that are “athletic,” the highest level we have ever seen, largely due to Nike taking
29% share—up from 25% last Spring and Fall.
Executive Summary Teen Behavior & Habits Teen Brand Preferences Demographics & AppendicesAthletic Footwear Still Gaining Share Among Females
Favorite Footwear Brand Mindshare - Upper-Income Female Teens
• 85% of females prefer an athletic brand of footwear (above), up 300 bps Y/Y and +700 bps vs 2LY – the second
highest result ever after last Fall at 86%. 88% of males prefer an athletic brand of footwear, flat Y/Y and up 100 bps
vs Spring.
Executive Summary Teen Behavior & Habits Teen Brand Preferences Demographics & AppendicesNetflix & YouTube Tied For Daily Video Consumption
Daily Video Consumption by Platform
37%
33%
32% 32%
31%31% 30%
30%
14%
11%
8% 8% 8%
7% 7% 7% 7% 7% 7% 8%
6% 6% 5%
5%
3% 3% 4% 3%
Amazon Prime Cable TV HBO Max Other streaming Disney+ Hulu YouTube Netflix
Spring '19 Spring '20 Spring '21 Spring '22
• On average, teens spend 30% of their daily video consumption on Netflix, down 2% from Spring 2021.
• Netflix remained the top platform, slightly edging second place YouTube at ~30%.
• Cable declined again, Hulu & Disney were roughly flat, while HBO Max improved to 6%.
Executive Summary Teen Behavior & Habits Teen Brand Preferences Demographics & AppendicesOnline Video Continuing to Gain Share
• Cord Nevers: 41% of teens in our survey indicated that they do not have
cable TV in their household; this is up from 40% in the Fall.
• Cord Cutters: 8% of teens said they expect their household to cancel
cable TV within the next 6 months, which is a slight increase from Fall ’21.
• Migration of Time/Wallet to Online Video: As a result of these trends,
we expect to see an ongoing transition toward online video / streaming
services.
Are you planning to cancel your cable subscription over the next 6 months?
(% of students)
Spring Spring Spring Spring Spring Spring
Fall 2016 Fall 2017 Fall 2018 Fall 2019 Spring 2020 Fall 2020 Fall 2021
2016 2017 2018 2019 2021 2022
I don't have cable 19% 17% 17% 20% 22% 25% 28% 32% 33% 35% 37% 40% 41%
No 70% 75% 72% 72% 69% 66% 62% 60% 58% 58% 56% 53% 52%
Yes 11% 8% 10% 8% 10% 9% 10% 9% 8% 7% 7% 7% 8%
Executive Summary Teen Behavior & Habits Teen Brand Preferences Demographics & AppendicesCustomer Service Channel Preferences
“When having to interact with customer service, what communication channel do you most prefer to utilize?”
• 51% of teens prefer to pick up the phone and call a customer service agent (down from 58% last survey), followed by
Text /SMS and Live Chat with a Human.
• Unsurprisingly, teens are more willing to use new communication channels like text/sms, live chat and social media
than the average consumer, though surprisingly, Phone remains the channel of choice. As the population continues to
shift towards Millennials & GenZ, we will see continued shifts to digital channels
Executive Summary Teen Behavior & Habits Teen Brand Preferences Demographics & AppendicesTeens’ Usage of Video Conferencing Solutions for Education
During the pandemic, which video communication tool did your school ask you to use for class, group projects, or
any other school related activity? (select all that apply)
% of “Other” Mentions (Most Popular)
• Unsurprisingly, Zoom was mentioned again by >65% of
students as a tool the school asked teens to use during hybrid
learning.
• On average, 1.47 solutions were mentioned per student, up vs
last survey but still notably lower than the ~2.5 solutions per
remote worker in our broader consumer survey.
Executive Summary Teen Behavior & Habits Teen Brand Preferences Demographics & AppendicesVideo Games: Teen Spending And Preferences
$225 - Expected Video Game Spend in 2022
$250 18%
14% - Budget Spent On Video Games in 2022
16%
$200 14%
12%
$150
10%
8%
$100
6%
$50 4%
2%
$0 0%
Video Game Spend (Male+Female) Video Game Spend Allocation (Male)
• Teens are expected to spend $225 on video games during 2022, up from $199 in the Spring 2021 survey
• We believe this could be driven by lower than historical spending amounts over the last few surveys
• For upper income males, video games as a percentage of total budget was flat at 14% in the Spring 2021 survey
• We see the flat percentage of budget over the last two surveys reflecting the post-vaccine COVID dynamics
• Expected video game spend in 2022 still remains below peak pre-COVID levels but appears to be steadily rising
• Overall, we think video games as a percentage of budget will likely regress closer to pre-pandemic levels
Executive Summary Teen Behavior & Habits Teen Brand Preferences Demographics & AppendicesVideo Games: Current “Gamer” Behavior
All Teens
68% Of Teens In Our Survey Say They Are Gamers
(vs. 67% in Fall 2021)
46% Of Gamers Plan to Buy New Console System in the Next 2 Years
(vs. 52% in Fall 2021)
12% Of Gamers Plan to Play More Video Games After COVID Subsides
(vs. 12% in Fall 2021)
Executive Summary Teen Behavior & Habits Teen Brand Preferences Demographics & AppendicesTeen Video Game Trends
26% Of Gamers Play Video Games on Both
Console and PC
Of PC Gamers Use a GPU
63% Board/Graphics Card
(up from 60% in Fall 2021)
Of PC Gamers Plan to Buy a GPU/
28% Graphics Card in the Next 6 Months
(down from 30% in Fall 2021)
Of GPU Board/Graphics Card Purchasers
34% Would Pay Over MSRP
(flat from Fall 2021)
Executive Summary Teen Behavior & Habits Teen Brand Preferences Demographics & AppendicesTop Payment Apps for Teens
Penetration for Payment Apps on Smartphone and Used in Last Month
25% For users of Venmo, Cash App & PayPal,
24%
23% Venmo Leads
Apps on smartphone
21%
Apps used in the last month
20%
19%
24%
16%
15%
15%
7% 4%
13%
7%
10%
10% 7%
7% 7% 39% 12%
6% 6%
5% 5%
5% 4% 4%
3%
2% 2% 2% 2% 2%
0%
Apple Pay Venmo Cash App PayPal Zelle Wells Fargo Bank of
America
JPMorgan
Chase
Amazon Pay Google Pay
Other
Other (please
list)
Apple Pay has highest penetration of users at 23%. (We point out that 87% of teens in the survey say they have an iPhone.)
PayPal’s Venmo follows closely at 21% with SQ’s Cash App at 15%. Payment apps from Zelle and traditional banks lag the
fintech apps.
Executive Summary Teen Behavior & Habits Teen Brand Preferences Demographics & AppendicesPayPal “Pay in 4” Leads in Top Buy Now Pay Later Offerings
Penetration for Teens on Buy Now Pay Later Offerings
34%
PayPal Pay in 4
33%
30%
Afterpay
29%
18%
Klarna
15%
16%
American Express Pay It Plan It
21%
12%
Affirm
7%
9%
Zip
7% Spring 2022 Fall 2021 Spring 2021
4%
Sezzle
6%
10%
Other
Other (please list)
10%
0% 5% 10% 15% 20% 25% 30% 35% 40%
PayPal “Pay in 4” continues to lead in penetration for teens among the top Buy Now Pay Later offerings at 34%
(unchanged from Fall survey). SQ’s Afterpay held the second position, but lost 2 ppt of market share. Klarna’s
penetration held steady from the Fall survey at 18%.
Executive Summary Teen Behavior & Habits Teen Brand Preferences Demographics & AppendicesCash and Debit Dominate Teens’ Spending
Penetration of Payment Methods Used in Last Month Among Teens
100% 32% of Teens Do Not Have a Traditional Bank Account
Used in last month
89%
90%
80%
74%
70% 32%
60%
68%
50%
40%
30% 25%
Yes No
20% 17%
10%
8%
10% 5% 3% 2%
0%
Cash (paper Debit card Credit card Contactless card Prepaid card Check BNPL QR code Other (please
currency) Other
list)
Cash is the most penetrated payment method, with 89% teens saying they used cash in the past month. (We adjusted our
survey questions about payments methods, so comparisons with prior surveys are not valid.) Teens are significant users of
debit cards, with 74% of them using a debit card in the past month. Only 25% used a credit card. While teens are using
contactless cards, they do not appear to have embraced QR codes.
Executive Summary Teen Behavior & Habits Teen Brand Preferences Demographics & Appendices11% Of Teens Have Bought Crypto
Have you ever bought bitcoin or another cryptocurrency?
Gender Makeup of Teen Crypto Traders
3%
14%
83%
Female Male Non-Binary
11% of teens claim to have traded cryptocurrency (up from 9% in Fall 2021), and another 76% are aware of what
cryptocurrencies are. Of the crypto traders, a striking 83% are male. Teens who traded crypto also tended to be older and
have above-average household incomes relative to the survey average.
Executive Summary Teen Behavior & Habits Teen Brand Preferences Demographics & AppendicesNon-Fungible Tokens (NFTs) Awareness Growth
Have you ever heard of Non- Have you ever purchased a Non-
Fungible Tokens (NFT)? Fungible Token (NFT)?
9%
81%
16%
61%
75%
36% 8%
Male Female Non-Binary
92%
Male Female Overall
Yes No
NFTs have burst onto the scene in the last 12 months. 61% of teens had heard of NFTs when asked (compared to 22% in
Fall 2021), with 81% of Males having heard of the digital assets (vs 33% in Fall 2021). Of those that have heard of them, 8%
have purchased NFTs, lower than the 10% rate last Fall. We are interested to see how this number evolves, and if the NFT
craze will be sustainable longer term.
Executive Summary Teen Behavior & Habits Teen Brand Preferences Demographics & AppendicesEnter the Metaverse: 26% of Teens Own a VR Device
• The Spring ’22 TSWT survey introduces a new series of questions around VR device ownership, usage, and the
Metaverse.
• Overall, VR device ownership is much higher than we expected, with 26% of respondents owning a VR device.
• That said, of those with a VR Device only 5% use daily and ~17% use it weekly. This level of engagement is
uncompelling relative to smartphones.
• Interest in the Metaverse appears mixed: 50% of teens either are unsure on the Metaverse or are not interested / no
intentions to purchase a device. Just 9% are interested and intent to purchase .
% of Teens that Own a VR Headset % of Teens that Do Not Own a VR Headset
32%
48%
25%
34%
18%
16%
12% 9%
5%
Owns VR device, Occasional user Moderate user Frequent user
Not interested, Moderately Unsure Interested, no Interested,
seldom uses it (several times / (several times / (daily)
no plans to interested, plans to intend to
month) week)
purchase may purchase purchase purchase
Executive Summary Teen Behavior & Habits Teen Brand Preferences Demographics & AppendicesTeen iPhone Ownership And Purchase Intent Near Highs
100%
90%
80%
70%
60%
50%
40%
30%
20%
10%
0%
Own an iPhone Expect next phone to be an iPhone
• iPhone ownership was down year-over-year to 87%. We note ownership is up from 88% in last Spring’s survey.
• 87% of teens said their next phone will be an iPhone, down 3% from Spring-21 survey.
• We note both of the metrics are slightly lower than the all-time highs we saw during the Spring-21 survey.
Executive Summary Teen Behavior & Habits Teen Brand Preferences Demographics & AppendicesTeen Privacy | Teens Mixed on Desire for Protected Browsing
“If you are an iPhone or Apple user, are you using or plan to utilize Apple’s new iCloud+ Private Relay service?
iCloud+ Private Relay is a service that is included in your iCloud+ subscription that you must pay for monthly.
• 41% of teens surveyed are either currently using Private Relay, or interested in using Private Relay in the next 6
months. This is relatively in-line with our assumptions outlined in our Private Relay Report, that estimated ~46% of
total consumers would be willing to pay for iCloud+ (and Private Relay)
• Overall, survey results remain relatively in-line with our assumptions published in our Private Relay report, and is
most positive for NET, followed by AKAM and FSLY in our coverage universe
Executive Summary Teen Behavior & Habits Teen Brand Preferences Demographics & AppendicesTeen Apple Watch Ownership Still Over 30%
40%
35%
30%
25%
20%
15%
10%
5%
0%
Own A Smartwatch Plan to buy Apple Watch
• Smart watch ownership was up to 37% from 34% in Spring 2021. Apple Watch ownership was up to 34% from 30% last Fall.
• Apple Watch buying intent was up with 14% planning to buy in the next 6 months vs. 13% in the Spring-21 survey.
Executive Summary Teen Behavior & Habits Teen Brand Preferences Demographics & AppendicesTeen Brand Preferences
Image Source: Nike
Spring 2001
Gap
Fall 2001
Spring 2002
Executive Summary
Fall 2002
Spring 2003
3.5 years
Fall 2003
Spring 2004
Abercrombie & Fitch
Fall 2004
Spring 2005
Fall 2005
Spring 2006
Fall 2006
Hollister
3.5 years
Spring 2007
Fall 2007
Spring 2008
Teen Behavior & Habits
Fall 2008
Spring 2009
Fall 2009
Brands
2.5 years
Spring 2010
Action Sports
Fall 2010
Spring 2011
Fall 2011
Spring 2012
Fall 2012
Spring 2013
Teen Brand Preferences
Fall 2013
Spring 2014
Fall 2014
Spring 2015
Fall 2015
Spring 2016
Fall 2016
Nike
11 years
Spring 2017
Fall 2017
Spring 2018
Fall 2018
Spring 2019
Fall 2019
Demographics & Appendices
Spring 2020
Fall 2020
Spring 2021
Fall 2021
Spring 2022Favorite Apparel Brands
All Teens – See Appendix for more detail broken down by upper vs. average-income teens or male vs. female
FALL 2020 SPRING 2021 FALL 2021 SPRING 2022
1 Nike 27% 1 Nike 27% 1 Nike 27% 1 Nike 30%
2 American Eagle 8% 2 American Eagle 7% 2 American Eagle 7% 2 American Eagle 7%
3 Adidas 5% 3 PacSun 6% 3 PacSun 5% 3 lululemon 5%
4 Pacsun 4% 4 lululemon 4% 4 Adidas 5% 4 H&M 4%
5 Hollister 4% 5 Adidas 4% 5 lululemon 5% 5 Adidas 4%
6 lululemon 3% 6 Hollister 3% 6 SHEIN 4% 6 PacSun 3%
7 H&M 3% 7 Urban Outfitters 3% 7 Hollister 3% 7 SHEIN 3%
8 Urban Outfitters 3% 8 SHEIN 3% 8 H&M 3% 8 Hollister 2%
9 Vans 2% 9 H&M 2% 9 Urban Outfitters 2% 9 Urban Outfitters 2%
10 Forever 21 2% 10 Thrift/Consignment Stores2% 10 Vans 2% 10 Forever 21 2%
Nike + Adidas 32% Nike + Adidas 31% Nike + Adidas 32% Nike + Adidas 34%
• Apparel spending was ~$560/year—up 5% sequentially and 10% Y/Y
• Females outspend males by ~$228 vs $186 last Fall; female spending was +15% Y/Y and
male +8% Y/Y
• Nike is the No. 1 brand (11 years running) at 30% share, up 300 bps sequentially and Y/Y
• American Eagle remains its No. 2 spot with 7% share, flat sequentially and Y/Y
• Thrift/Consignment stores was ranked No. 15 but when combined with Goodwill would have
been No. 10
• lululemon moved from No. 4 to No. 3, gaining 100 bps Y/Y of share
• H&M jumped from No. 9 with 2% share last Spring to No. 4 with 4% share this Spring
Executive Summary Teen Behavior & Habits Teen Brand Preferences Demographics & Appendices
Image Source: nike.comFavorite Footwear Brands
All Teens – See Appendix for more detail broken down by upper vs. average-income teens or male vs. female
FALL 2020 SPRING 2021 FALL 2021 SPRING 2022
1 Nike 52% 1 Nike 56% 1 Nike 57% 1 Nike 60%
2 Vans 16% 2 Vans 12% 2 Vans 11% 2 Converse 8%
3 Adidas 11% 3 Adidas 9% 3 Adidas 9% 3 Adidas 8%
4 Converse 4% 4 Converse 6% 4 Converse 7% 4 Vans 8%
5 Foot Locker 2% 5 Foot Locker 2% 5 Foot Locker 2% 5 New Balance 1%
6 Birkenstock 1% 6 Dr. Martens 2% 6 Crocs 1% 6 Crocs 1%
7 Dr. Martens 1% 7 New Balance 1% 7 New Balance 1% 7 Foot Locker 1%
8 New Balance 1% 8 Crocs 1% 8 Hey Dude 1% 8 Dr. Martens 1%
9 Crocs 1% 9 Birkenstock 1% 9 Dr. Martens 1% 9 Hey Dude 1%
10 Steve Madden 1% 10 Under Armour 1% 10 Birkenstock 1% 10 Under Armour 1%
• Footwear spending was $300/year vs $270/year last Spring—up 11% Y/Y led by women’s +16% Y/Y and men’s +7%
• Despite seeing a female-led spending recovery, males still outspend females on footwear by $51/year
• Nike (No. 1) gains substantial share—up 400 bps Y/Y to 60% vs. 56% last year; taking share from Vans at No. 4
• Converse gained 200 bps Y/Y taking the No. 2 spot from Vans down 400 bps Y/Y; adidas remains No. 3
• Under Armour remains in the Top 10 Y/Y after falling off last Fall—Spring 2021 was the first time being inside the top
since Fall 2019
• Dr. Martens falls down to No. 8 (vs. No. 6 last year) while Birkenstock fell out of the top 10
• Crocs moved up 2 spots—now the No. 6 brand—vs. 8 last Spring—the highest ranking ever
• Hey Dude maintained its position as a top-ten footwear brand—ranking No. 9
Image Source: Crocs.com
Executive Summary Teen Behavior & Habits Teen Brand Preferences Demographics & AppendicesTop Fashion Trends Right Now
Upper-Income Teens, Female
FALL 2020 SPRING 2021 FALL 2021 SPRING 2022
1 Leggings / lululemon 21% 1 Leggings / lululemon 23% 1 Leggings / lululemon 17% 1 Leggings / lululemon 35%
2 Jeans 10% 2 Baggy / Saggy Pants 9% 2 Crop Tops 11% 2 Jeans 8%
3 Nike / Jordans 9% 3 Mom Jeans 8% 3 Jeans 11% 3 Nike / Jordans 8%
4 Crop Tops 8% 4 Nike / Jordans 7% 4 Baggy / Saggy Pants 10% 4 Baggy / Saggy Pants 6%
5 Baggy / Saggy Pants 4% 5 Crop Tops 6% 5 Nike / Jordans 8% 5 Crop Tops 5%
6 Oversized Tops 3% 6 Jeans 5% 6 Mom Jeans 5% 6 Mom Jeans 3%
7 Ripped Jeans 3% 7 Athletic Wear 3% 7 Hair Trends 3% 7 Hair Trends 3%
8 Brandy Melville 2% 8 Ripped Jeans 2% 8 Athletic Wear 2% 8 Athletic Wear 2%
9 Vans 2% Brandy Melville 2% 9 Converse 2% 9 Hoodies 2%
10 Athletic Wear 2% 10 Hair Trends 2% 10 Ripped Jeans 2% 10 Comfort 1%
Comfort 2% Sweat Shirts 1%
• This unaided question goes to all teens to opine on top fashion trends for females in school
• Leggings/lululemon is still the No. 1 trend at 35%, up 1,200 bps Y/Y with many answers ranging from flared leggings
to ripped leggings
• Denim trends continue to maintain significant mindshare with Jeans increasing 300 bps Y/Y, Ripped Jeans losing
share dropping out of the top 10, and Mom Jeans which entered last Spring and ranks currently at No. 6
• We continue to see significant influence from the 1990s—with baggy/pants taking No. 4 along with crop tops No. 5
• Nike/Jordans gained 100 bps from No. 4 to No. 3 Y/Y while athletic wear ceded 100 bps from No. 7 to No. 8
• Hair trends gained 100 bps of mindshare and increased from No. 10 last Spring to No. 7
• Responses such as, “Air forces and perms” and “Mom jeans, Flare jeans, boot cut jeans” sum up the current trends
best
Executive Summary Teen Behavior & Habits Teen Brand Preferences Demographics & AppendicesTop Fashion Trends Right Now
Upper-Income Teens, Male
FALL 2020 SPRING 2021 FALL 2021 SPRING 2022
1 Nike / Jordans 15% 1 Nike / Jordans 15% 1 Nike / Jordans 18% 1 Nike / Jordans 23%
2 Athletic Wear 8% 2 Athletic Wear 13% 2 Athletic Wear 9% 2 Athletic Wear 12%
3 Hoodies 6% 3 Flannels 8% 3 5" Inseam Shorts 6% 3 Flannels 10%
4 5" Inseam Shorts 4% 4 Hoodies 8% 4 Short Shorts 5% 4 Hoodies 7%
5 Shorts 4% 5 Shoes 4% 5 Shorts 5% 5 Sweat Shirts 4%
6 Short Shorts 4% 6 Sweat Shirts 3% 6 Hoodies 4% 6 Hair Trends 3%
7 Jogger Pants 3% 7 Layering 2% Hair Trends 3% Hats 3%
8 Flannels 3% Jeans 2% 8 Hats 3% 8 Jogger Pants 3%
9 Sweatshirts 3% 9 Shorts 2% 9 T-Shirts 3% 9 Baggy / Saggy Pants 2%
10 Vans 2% Baggy / Saggy Pants 2% 10 Baggy / Saggy Pants 3% 10 Leggings / lululemon 2%
• Like the former question, this question goes to all teens to opine (unaided) on top fashion trends for males
• Mentions of Nike / Jordan take the No. 1 spot again and gains 800 bps of mindshare to 23%
• Athletic Wear, while still No. 2, moved to 12%, down 100 bps Y/Y but up 300 bps sequentially
• Combining “Short Shorts” and “5” Inseam Shorts” results in 1.9% share, or would otherwise be No. 10
• Mentions of lululemon appeared on the top 10 list for the first time with UI males
• Flannels and Hoodies each held their respective rankings; Hoodies and Sweat Shirts combined for 11% mindshare
• Hair Trends, Hats, and Jogger Pants all remained in the top 10 after entering last Fall
• Some hair trends included Perms, Mullets and Long Hair
Executive Summary Teen Behavior & Habits Teen Brand Preferences Demographics & AppendicesTop Brands Starting To Be Worn
Upper-Income Teens
FALL 2020 SPRING 2021 FALL 2021 SPRING 2022
1 Adidas 11% 1 Adidas 11% 1 Nike 13% 1 Nike 10%
2 Champion 10% 2 Champion 9% 2 Adidas 11% 2 Champion 10%
3 Nike 10% 3 Nike 9% 3 Champion 8% 3 Adidas 10%
4 Vans 5% 4 Vans 4% 4 Hollister 4% 4 lululemon 4%
5 Hollister 4% 5 Under Armour 4% 5 Vans 4% 5 American Eagle 4%
6 lululemon 4% 6 Hollister 4% 6 Under Armour 4% 6 Under Armour 3%
7 American Eagle 4% 7 American Eagle 3% 7 American Eagle 4% 7 Hollister 3%
8 Under Armour 3% 8 PacSun 2% 8 lululemon 3% 8 Vans 3%
9 PacSun 2% 8 lululemon 2% 9 H&M 3% 9 New Balance 3%
10 H&M 2% 10 Patagonia 2% 10 New Balance 2% 10 The North Face 2%
FALL 2020 SPRING 2021 FALL 2021 SPRING 2022
1 SHEIN 7% 1 SHEIN 9% 1 PacSun 8% 1 lululemon 10%
2 PacSun 7% 2 PacSun 7% 2 Zara 7% 2 Nike 6%
3 lululemon 6% 3 lululemon 5% 3 American Eagle 6% 3 PacSun 5%
4 American Eagle 6% 4 Zara 5% 4 lululemon 6% 4 American Eagle 5%
5 Brandy Melville 6% 5 Urban Outfitters 4% 5 SHEIN 6% 5 Zara 5%
6 Nike 5% 6 Brandy Melville 4% 6 Nike 5% 6 Aritzia 4%
7 Hollister 4% 7 American Eagle 4% 7 Urban Outfitters 4% 7 Urban Outfitters 4%
8 Champion 3% 8 Princess Polly 4% 8 Brandy Melville 4% 8 SHEIN 3%
9 Urban Outfitters 3% 9 Nike 3% 9 Hollister 3% 9 Garage 3%
10 H&M 2% 10 Champion 3% 10 Garage 3% 10 Converse 3%
Executive Summary Teen Behavior & Habits Teen Brand Preferences Demographics & AppendicesTop Brands No Longer Worn
Upper-Income Teens
FALL 2020 SPRING 2021 FALL 2021 SPRING 2022
1 Under Armour 22% 1 Under Armour 17% 1 Under Armour 23% 1 Under Armour 23%
2 Adidas 12% 2 Adidas 12% 2 Adidas 11% 2 Adidas 15%
3 Nike 12% 3 Gap 11% 3 Nike 9% 3 Nike 8%
4 Gap 7% 4 Nike 9% 4 Gap 7% 4 Gap 7%
5 Puma 5% 5 Puma 4% 5 Skechers 6% 5 Puma 5%
6 Reebok 4% 6 Skechers 4% 6 Reebok 5% 6 Reebok 4%
7 Hollister 3% 7 Hollister 4% 7 Champion 4% 7 Champion 4%
8 Skechers 3% 8 Reebok 4% Puma 4% 8 Skechers 4%
9 Champion 3% 9 Old Navy 3% 9 Hollister 3% 9 Hollister 3%
10 Ralph Lauren 2% 10 Champion 3% 10 Vineyard Vines 3% 10 American Eagle 3%
FALL 2020 SPRING 2021 FALL 2021 SPRING 2022
1 Justice 26% 1 Justice 20% 1 Justice 26% 1 Justice 22%
2 Hollister 8% 2 Hollister 12% 2 Hollister 9% 2 Hollister 11%
3 Forever 21 7% 3 American Eagle 10% 3 Gap 6% 3 American Eagle 9%
4 American Eagle 6% 4 Forever 21 7% 4 American Eagle 5% 4 Forever 21 5%
5 Aeropostale 6% 5 Gap 6% 5 Adidas 5% 5 Adidas 5%
6 Gap 5% 6 Old Navy 4% 6 Old Navy 4% 6 Gap 4%
7 Adidas 5% 7 Abercrombie & Fitch 4% Aeropostale 4% 7 Under Armour 4%
8 Old Navy 4% 8 Aeropostale 4% 8 Forever 21 4% 8 Old Navy 4%
9 Abercrombie & Fitch 4% 9 Brandy Melville 4% 9 Under Armour 3% 9 Brandy Melville 3%
10 Victoria's Secret 3% 10 Adidas 3% 10 Nike 3% Abercrombie & Fitch 3%
Executive Summary Teen Behavior & Habits Teen Brand Preferences Demographics & AppendicesFavorite Handbag Brands
All Female Teens
FALL 2020 SPRING 2021 FALL 2021 SPRING 2022
1 Louis Vuitton 19% 1 Louis Vuitton 18% 1 Michael Kors 18% 1 Coach 17%
2 Michael Kors 18% 2 Michael Kors 16% 2 Louis Vuitton 16% 2 Michael Kors 15%
3 Coach 13% 3 Kate Spade 14% 3 Coach 14% 3 Louis Vuitton 14%
4 Kate Spade 12% 4 Coach 13% 4 Kate Spade 12% 4 Kate Spade 12%
5 Gucci 6% 5 Gucci 6% 5 Gucci 6% 5 Chanel 6%
6 Chanel 5% 6 Chanel 5% 6 Chanel 5% 6 Gucci 5%
7 Vera Bradley 3% 7 Prada 4% 7 Prada 3% 7 Prada 3%
8 Prada 3% 8 Vera Bradley 3% 8 Vera Bradley 2% 8 Target 2%
9 Steve Madden 1% 9 Guess 1% 9 Nike 2% 9 Dior 2%
10 Target 1% 10 SHEIN 1% 10 Dior 1% 10 Vera Bradley 2%
Marc Jacobs 2%
• Handbag spending improved to $101—up 8% Y/Y and up 5% sequentially, reversing a multi-year low
• Coach overtook Michael Kors as the No. 1 brand after gaining 400 bps Y/Y from the No. 4 position last Spring
• Kate Spade went from No. 3 last year to No. 4 this Spring while losing 200 bps of mindshare
• Tapestry was the most relevant portfolio company in our coverage capturing 30% of total vote vs 27% LY
• Louis Vuitton decreased 400 bps Y/Y and went from No. 1 last Spring to No. 3
• Chanel and Gucci switch positions Y/Y while Prada remained in the No. 7 spot with 3% share
• SHEIN remains out of the top 10 after falling out last Fall; SHEIN was the No. 13 brand with 1% share
• Target re-entered the top 10 at No. 8 after falling out the last 2 surveys while Dior moved up sequentially to No. 9
• Vera Bradley decreased from No. 8 last year to tie for No. 10 alongside Marc Jacobs; Tory Burch was ranked No. 12
Executive Summary Teen Behavior & Habits Teen Brand Preferences Demographics & AppendicesAccessible Luxury Makes Slight Rebound
70%
64% Michael Kors +
62%
60% Kate Spade + Coach
Consolidated Luxury vs Accessible
60%
57%
53% 49%
50% 49%
LuxuryMindshare
44% 44%
43% 43%
40% 37%
36%
31% 32%
30% 31%
30% 28%
23%
20% 17% 17%
13%
10%
0%
Spring 2017 Fall 2017 Spring 2018 Fall 2018 Spring 2019 Fall 2019 Spring 2020 Fall 2020 Spring 2021 Fall 2021 Spring 2022
• We are seeing a leveling off of accessible luxury brand mindshare, steady sequentially and slightly up Y/Y at 44%
• Tapestry was the most relevant portfolio—30% of total vote
• Capri Holdings (received votes for Michael Kors & Versace & Jimmy Choo) held a collective vote of 15% down from
18% last Fall
• Luxury mindshare moved down 500 bps from Spring but was up 100 bps sequentially; LV, Gucci, Prada, Chanel, and
Dior in top-ten
• Secondary platforms are increasingly a way for brands to access luxury brands and include The RealReal, Poshmark,
and Depop, among others
Executive Summary Teen Behavior & Habits Teen Brand Preferences Demographics & AppendicesFavorite Watch Brand
Upper-Income Teens
FALL 2020 SPRING 2021 FALL 2021 SPRING 2022
1 Rolex 36% 1 Rolex 35% 1 Apple 39% 1 Apple 42%
2 Apple 35% 2 Apple 34% 2 Rolex 35% 2 Rolex 33%
3 Fossil 3% 3 Casio 3% 3 Casio 3% 3 Garmin 2%
4 Fitbit 2% 4 Fitbit 2% 4 Richard Mille 2% 4 Fossil 2%
5 Casio 2% 5 Garmin 2% 5 Fitbit 2% 5 Casio 2%
6 Garmin 1% 6 Fossil 2% 6 Freestyle 2% 6 Gucci 1%
7 Gucci 1% 7 Tissot 1% 7 Garmin 1% 7 Fitbit 1%
8 Patek Philippe 1% Michael Kors 1% 8 Fossil 1% 8 Cartier 1%
9 Tissot 1% 9 Cartier 1% 9 Swatch 1% 9 Richard Mille 1%
10 Michael Kors 1% 10 Swatch 1% 10 Patek Philippe 1% 10 Tissot 1%
Gucci 1% Nike 1%
• 86% of upper-income teens do not plan to purchase a watch in the next six months vs. 85% last Fall and 89% last
Spring
• Rolex, remained at the No. 2 spot after falling form No. 1 last Fall; Rolex lost 200 bps share Y/Y
• Apple, remained as the No. 1 watch brand sequentially and gained 700 bps share Y/Y and 300 bps S/S
• Garmin jumped to No. 3 from No. 5 last Spring but remained at 2% mindshare Y/Y
• Richard Mille remained in the top 10 at No. 9 after entering last Fall; it ceded 100 bps sequentially
• Michael Kors remained out of the top 10 tied at No. 12 while Nike entered the top 10 tied with Tissot
Executive Summary Teen Behavior & Habits Teen Brand Preferences Demographics & AppendicesYou can also read


