Summaries of Regional Case Studies on Essential Freshwater: Action for Healthy Waterways - Local Government New Zealand Regional Sector Water Subgroup
←
→
Page content transcription
If your browser does not render page correctly, please read the page content below
Local Government New Zealand
Regional Sector Water Subgroup

Summaries of Regional Case Studies on
Essential Freshwater: Action for Healthy
Waterways
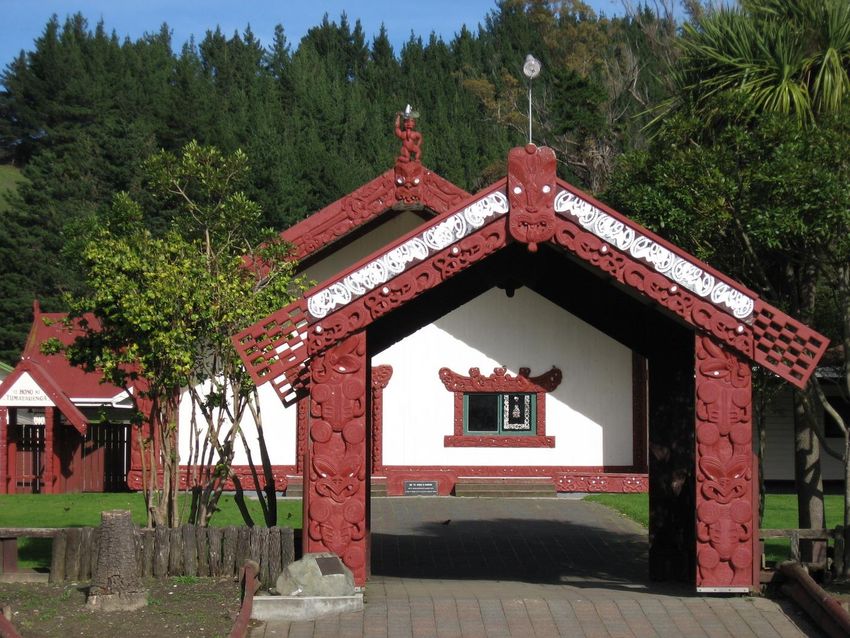
Cover photo: Looking towards Lake Te Anau and Fiordland from Ramparts Hill, Southland
Source: Karen Wilson, Environment Southland

Acknowledgements
This report has been compiled at short notice with the help and support of many people from
regional New Zealand. These people include Alastair Smaill (Programme Leader – Urban Water)
from Greater Wellington Regional Council; Jonny Horrox (Resource Scientist) from West Coast
Regional Council; Cameron Smith (Team Leader Regional Leadership and Policy) from Environment
Canterbury; Gavin Ide (Principal Advisor Strategic Planning), Monique Benson (Water Management
Advisor), Johanna Rogers (Water Information Coordinator) from Hawke’s Bay Regional Council;
Joanna Noble (Strategic Planning Manager) and Te Rina Whaanga (Senior Policy Advisor) from
Gisborne District Council; Clare Barton (Group Manager Environmental Management) and David
Light (Manager Utilities) from Nelson City Council; Gary Bedford (Director – Environment Quality)
from Taranaki Regional Council); Darryl Jones (Economist) from Northland Regional Council; Santiago
Bermeo (Senior Planner) and Nicola Green (Principal Advisor – Policy and Planning) from Bay of
Plenty Regional Council; Blair Keenan (Principal Economist) and Femi Olubode (Economist) from
Waikato Regional Council; Emma Duncan (GIS Analyst) and Emma Moran (Senior Policy Analyst /
Economist) from Environment Southland); Nicola Smith (Director, Market Economics), Gerard Willis
(Enfocus), and Clare Wooding (Principal Policy Advisor, Local Government New Zealand).

This document is an internal report produced for LGNZ by the LGNZ Regional Sector Water Subgroup
and it includes summaries of case study assessments contributed by 9 regional or unitary councils.
An additional joint case study by Northland and Auckland councils is also underway. The
assessments are still being finalised and some of the detail or conclusions may be subject to change,
following the Freshwater Forum. The final report will be produced in October 2019.

Within the limited time available, the regional councils and LGNZ have made all reasonable efforts to
ensure the accuracy of these assessments and any other information contained within this report.

The introduction to this report was written by Emma Moran (Senior Policy Analyst / Economist),
Environment Southland and, while based on the advice and experience of a number of policy
analysts and economists working for regional councils, it does not necessarily represent the views of
the Regional Sector.

For clarity, this report is not intended to be a policy document.

Version – Final
Date – 19 September 2019

2

Contents
Introduction ............................................................................................................................................ 5
1 Canterbury – Nitrogen ‘bottom line’ in the Waitaki Catchment .................................................... 7
2 Taranaki – Nutrient ‘bottom lines’, Nitrogen Cap, and Overseer for the Waingongoro ................ 9
3 Waikato – Nutrient ‘bottom lines’ in the Waikato and Waipa Catchments ................................. 12
4 Greater Wellington – Review of Landcare report for the Ruamahanga Catchment (Wairarapa) 14
5 West Coast – Stock Exclusion Regulations .................................................................................... 16
6 Hawke’s Bay – Water takes........................................................................................................... 18
7 Bay of Plenty – Nutrient ‘bottom lines’ and farming reulations ................................................... 20
8 Southland – Nitrogen Cap in 5 ‘high nitrate-nitrogen’ catchments.............................................. 23
9 Southland – Wastewater National Environmental Standard for Gore District............................. 26
10 Gisborne – Implications for whenua Māori .............................................................................. 29
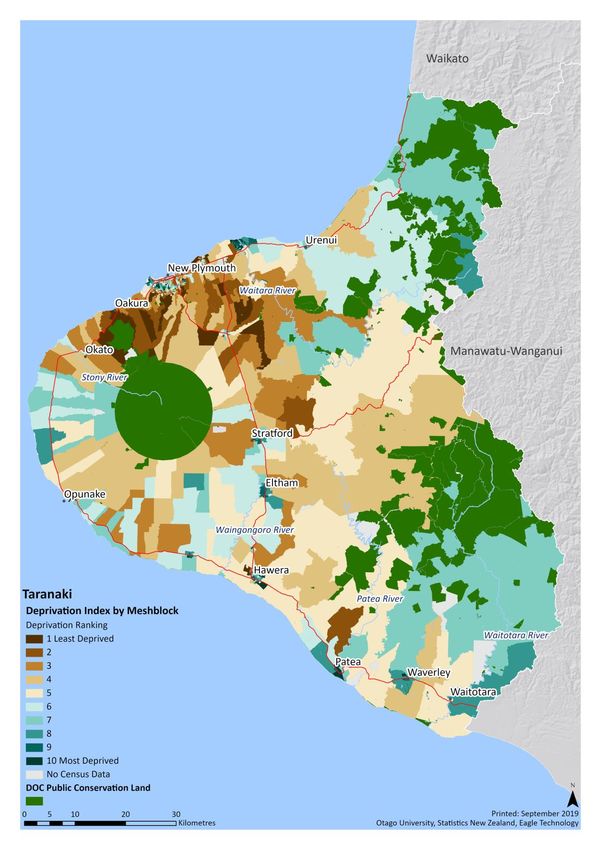
11 Appendix 1 – Regional Socioeconomic Deprivation Index maps .............................................. 32
3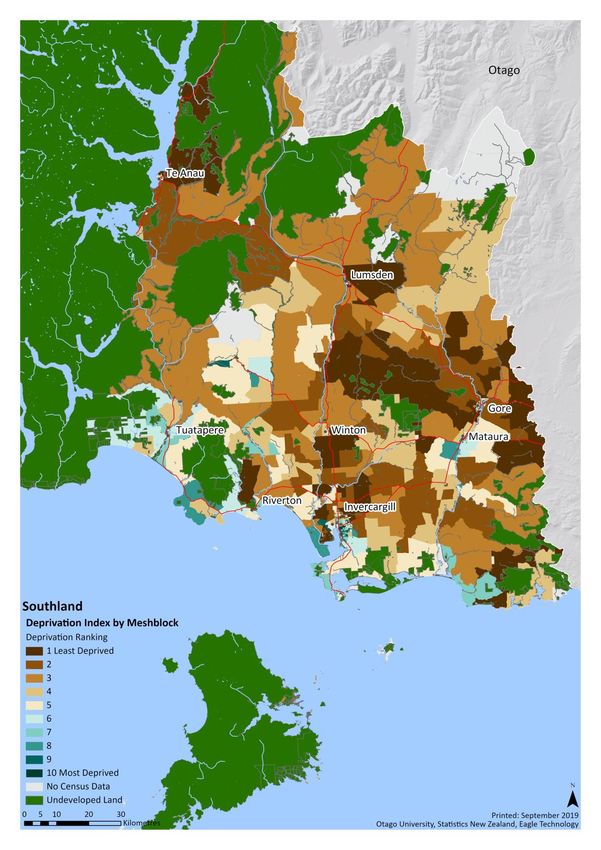
4
Introduction
In early September 2019 Central Government released Essential Freshwater: Action for Healthy
Waterways for consultation. It sets out a package of proposals (using a range of policy tools) to stop
further degradation within five years and reverse past damage within a generation. Beyond this, the
Government plans to address water allocation issues. The package contains an amended National
Policy Statement for Freshwater Management, a new National Environment Standard for
Freshwater, and regulations for both water takes and stock exclusion. It also signals upcoming
proposals for drinking water, wastewater and stormwater being developed as part of the
Department of Internal Affairs’ ‘Three Waters’ Review.

The Essential Freshwater Package, along with other elements of Central Government’s work
programme, is likely to mean significant change for many New Zealanders. In essence, where the
Government’s market reforms in the 1980s saw the removal of financial subsidies from agriculture,
this generation’s initiatives for water are moving further towards the removal of some
environmental subsidies (i.e. accounting for externalities) across most of the economy. There will be
both important benefits and costs from these changes and, although their initial distribution
between people and communities will be variable, New Zealand is a small place and we will all
experience the results.

An important but challenging question that is posed with the impact assessment of any new national
policy direction is how to scale up costs and benefits for different areas to the national level.
However, in assessing policy implications from a single panoramic viewpoint, much of the picture
can be lost. As with everything to do with water, assessing how a shift in policy may play out for
communities is an extremely complex task – in many locations the costs will be fairly manageable
but there will also be cases of extremes (e.g. low costs and high costs).

A better understanding of nation-wide impacts can be gained from considering the network of 16
regional viewpoints and how they fit together - and within each region, at least some of the
perspectives of 61 cities, districts and, beyond this, our local communities – including mana whenua.
Exploring the breadth of New Zealand’s interconnected but disparate parts helps build a national
picture – rather than just relying on totals or averages.

In looking up and out to build a picture of national impacts it may be possible to develop something
of a regional ‘typology’. As a first step in identifying gaps in the existing picture, the purpose of this
report is to bring together summaries of case studies prepared by regional councils from around
New Zealand on a number of specific proposals. An additional case studies (not included here) is
being prepared by Northland and Auckland (jointly) on the impacts of proposals to reduce sediment
loss into the Kaipara Harbour. Along with the case studies, Appendix 1 includes maps of the
socioeconomic deprivation to illustrate how variable the impacts may be spatially within and
between regions.

This case study series will be presented and discussed at LGNZ’s Freshwater Forum. The next step
will be to finalise the case studies. Also included in the final report, will be a table that broadly
characterises each region’s economy and identifies the relevance of selected proposals. The case
studies be used to inform both LGNZ’s independent review of the interim Regulatory Impact Analysis
and its submission on the Essential Freshwater Package.

                                                                                                        5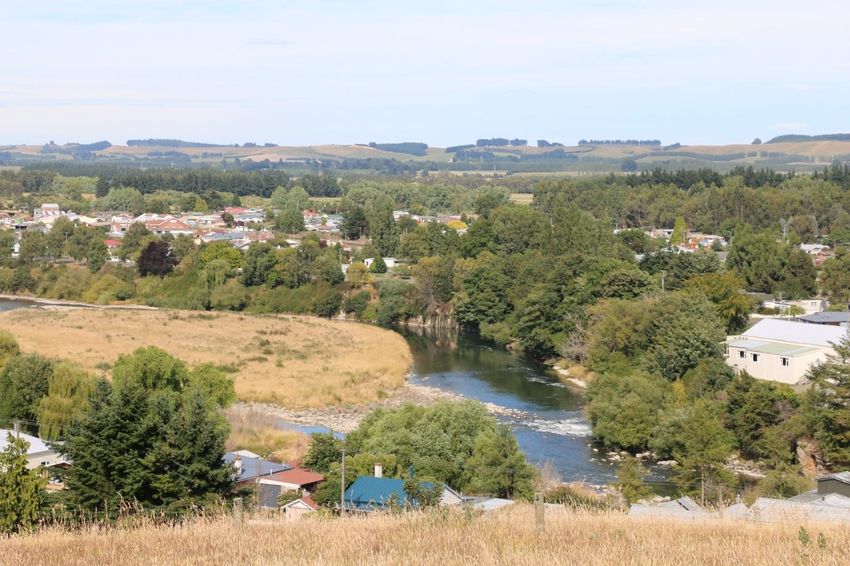
New Zealand's regions are, in essence, collections of surface water catchments that flow from the
mountains to the sea. These catchments number in the thousands and come in a seemingly endless
array of shapes and sizes – they are our link to the estuaries and the coast. In developed areas, each
catchment may contain one or more local communities – marae, settlements, towns or cities and
their surrounding rural hinterland. These local communities are located near water because water is
vital to life and central to our shared identity, as is reflected in Te Mana o te Wai.

6
1 Canterbury – Nitrogen ‘bottom line’ in the Waitaki Catchment

1.1 Initial Conclusions
The Waitaki River catchment is Canterbury’s largest, with the river draining an area of approximately
12,000 km2. Streams and rivers in the Waitaki include alpine upland, hill-fed upper and lower,
upland spring, lake-fed rivers, and spring-fed plains. There is a large variation in climate, soils and
landscape, and a diversity of land use, ranging from extensively farmed high country stations in the
upper reaches to intensive pastoral farming in the flatter areas.

The proposed ‘bottom line’ for dissolved inorganic nitrogen (DIN) is expected to have considerable
impact on land use in the lower Waitaki catchment. The alpine and hill-fed steams in the upper
Waitaki all achieve (i.e. are above) the proposed DIN bottom line of 1mg/L., however groundwater
fed (spring-fed) streams in the lower Waitaki ‘Northern Fan’ FMU are not. The Waitaki catchment
example largely mirrors the state of streams across Canterbury. Alpine, upland and lake fed streams
achieve the DIN bottom line, while 66% of spring-fed rivers on the plains and 73% of spring-fed
urban rivers in Christchurch do not meet the bottom line.

Recent plan changes with limits specific to the Waitaki have focused on implementing Good
Management Practice (GMP) in order to reduce instream loads of Dissolved Reactive Phosphorus
(DRP), sediment and E.coli. However, it is recognised that the shift from border dyke to spray
irrigation would increase DIN concentrations. Despite this, the majority of water quality parameters
and overall ecological health are likely to improve through action required by the plan change.
Overall, we expect the ecological benefits of reducing DIN to 1 mg/l in the spring-fed streams in the
Waitaki to be limited, while the costs of achieving the DIN bottom line to be significant. Other target
attributes may better deliver ecological benefits for these streams.

In some of Canterbury’s hill-fed streams we do have DIN concentrations above 1mg/l, particularly in
their lower reaches where there is considerable groundwater-surface water interaction. For these
rivers our initial conclusions are that significant reductions in DIN concentrations would lead to
greater ecological benefits as it would lead to lower periphyton cover and less eutrophication. In-
stream productivity in these hill-fed streams is more closely linked to water column nutrient
availability compared to spring-fed streams, where a portion of the nutrients used for plant growth
is taken from the sediment.

The environmental benefits of the proposed DIN limit in spring-fed streams dominated by rooted
aquatic plants (macrophytes) are likely to be small. That is because macrophytes also obtain
nutrients from the substrate of these streams. Therefore, the ecological benefits associated with
the proposed DIN bottom line are expected to differ across river types and tight management of DRP
is likely to be equally important.

                                                                                                     7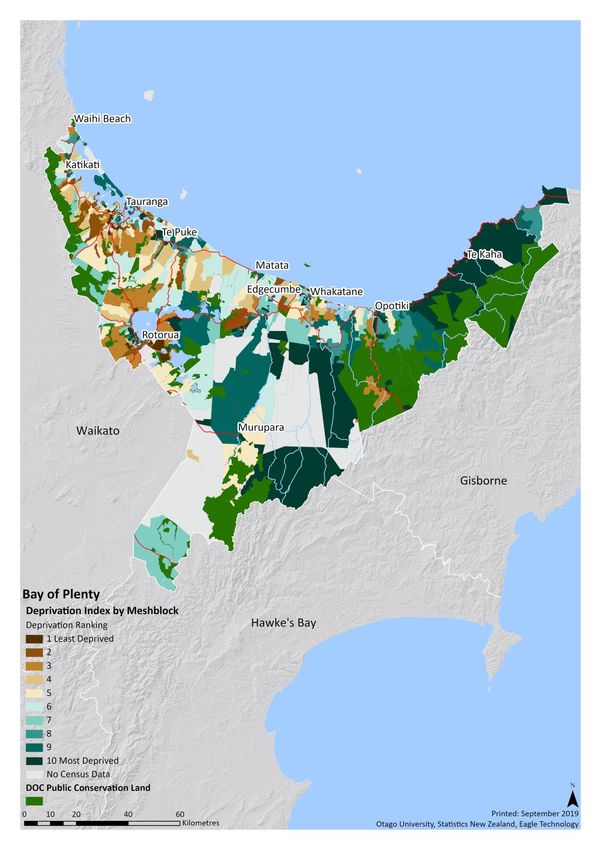
1.2 Setting
The draft NPS for Freshwater Management has a proposed bottom line for nitrogen in rivers at an
annual median of 1.0 milligrams per litre of dissolved inorganic nitrogen (DIN). This would apply to
all rivers and streams. Within the lower Waitaki sub-catchment there are three spring-fed rivers on
the plains that form the Northern Fan FMU – Penticotico Stream, Whitneys Creek and Waikākahi
Stream.
All three rivers have elevated nutrient concentrations. Along with all other rivers in the Waitaki,
Plan Change 5 to the Land and Water Regional Plan places water quality limits for these rivers, and
requires all farming activities to be operating at Good Management Practice. For the Lower Waitaki
spring-fed streams the annual median DIN limits are approximately:
Penticotico Stream = 1.21 mg/l
Whitneys Creek = 1.8 mg/l
Waikākahi Stream = 2.65 mg/l
1.3 Methods and Results
Given timing constraints, we have not been able to undertake specific modelling and our
commentary will be a ‘best estimate’ based on knowledge of DIN and land use around the region.
This case study is informed by earlier work completed as part of Plan Change 5, which became
operative in February 2019. We have focused only on those rivers with a current state of DIN >1
mg/l, have assessed current land use within these catchments, and compared this against land use in
comparable catchments that do meet the DIN bottom line. We have then drawn conclusions about
the scale of land use change that may be needed to meet the proposed DIN bottom line. The
analysis will cover the expected land use change required to meet the proposed DIN bottom line in
the Northern Fan FMU within the Waitaki catchment.
8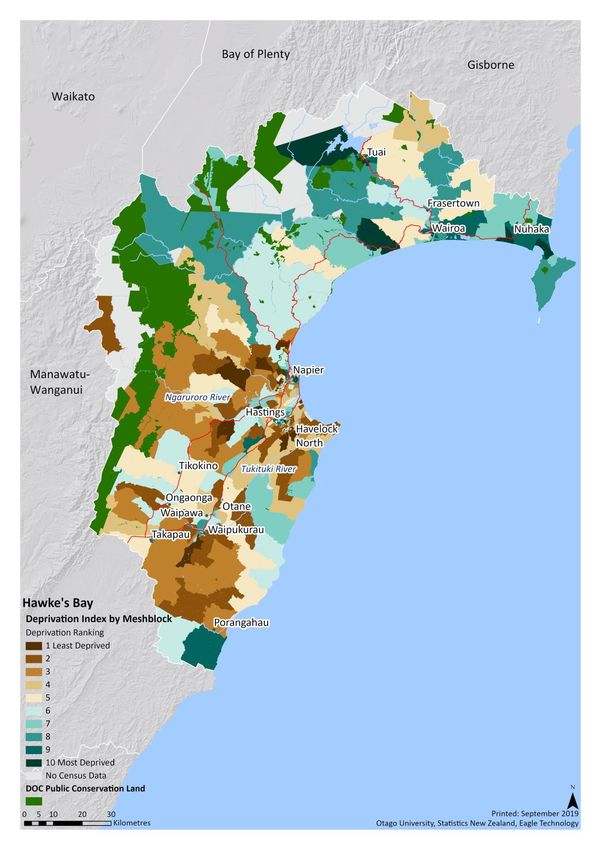
2 Taranaki – Nutrient ‘bottom lines’, Nitrogen Cap, and Overseer for
the Waingongoro
2.1 Initial Conclusions
At present, the Nitrogen Cap proposal (Option 1) applies to 13 catchments across New Zealand. This
proposal focuses on nitrate nitrogen (NO3N) but is likely to contribute towards achieving the
recommended nutrient bottom lines, which target both dissolved inorganic nitrogen (DIN) and
dissolved reactive phosphorus (DRP). The Waingongoro River in Taranaki is one of the N-cap
catchments but in fact many other rivers and streams across the south Taranaki ring plain have
similar DIN and DRP concentrations. In Taranaki, the N-Cap proposal and recommended nutrient
bottom lines are quite different to the region’s current policy pathway, and analysis has shown they
may not improve ecological health as quickly or as cost-effectively. The N-Cap proposal requires the
use of Overseer to measure a farm’s performance and environmental footprint in terms of nitrogen
loss, which is a major shift for the region. It is anticipated that the economic impacts of the nutrient
bottom lines across Mount Taranaki’s southern ring plain will be considerable. This area has
relatively high levels of social deprivation.
2.2 Setting
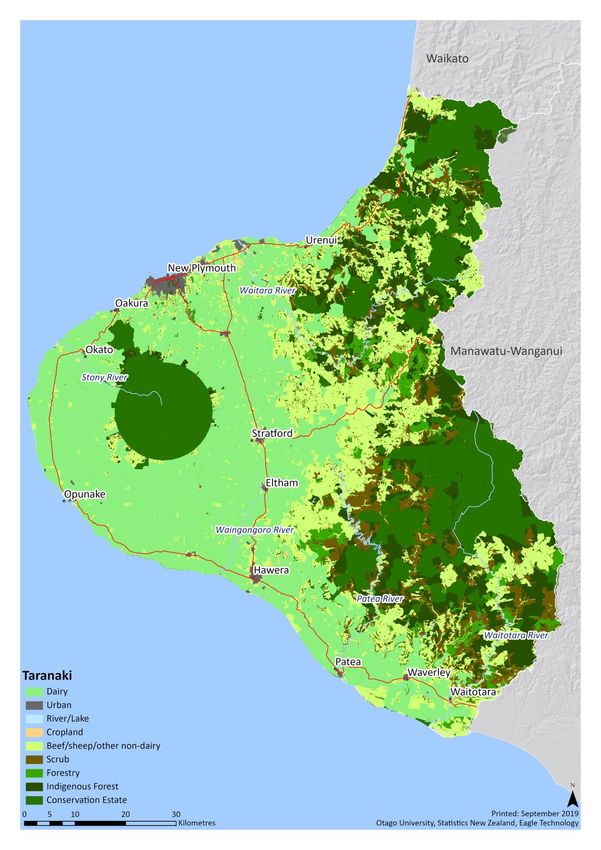
The Waingongoro runs south from Mount Taranaki and is one of the larger rivers on the ring plain.
Within the catchment, exotic grassland covers around 91% of land and indigenous forest about 7%
of land. Below the National Park, land is predominantly used for intensive dairying. The
Waingongoro River holds special value for Ngāruahine and Ngāti Ruanui iwi, and at the mouth of the
River is Ōhawe (one of New Zealand’s earliest settled places). The River is also highly valued for its
aesthetic, scenic and recreational values - supporting an important trout fishery and of regional
significance for contact recreation. Council monitoring shows the Waingongoro River has good to
excellent stream health using macroinvertebrate, periphyton, and chlorophyll-A measures - and little
to no correlation between trends or levels of nutrients, and stream health.
Farm-scale riparian plans cover almost all of the catchment and evidence shows they have improved
in-stream ecological health. On completion in 2024, it is likely phosphorus loss will have reduced by
10% although nitrogen loss by less than 5% from current concentrations. Diversion of all remaining
discharges of treated dairy effluent from water to land should be completed by 2025 and will reduce
nitrogen loss by 10 to 15% and phosphorus loss by up to 35% - the cost to farmers is roughly $4.4
million. The Council opposes the use of Overseer within a regulatory framework for a wide range of
reasons that centre around its uncertainty and applicability to Taranaki.
9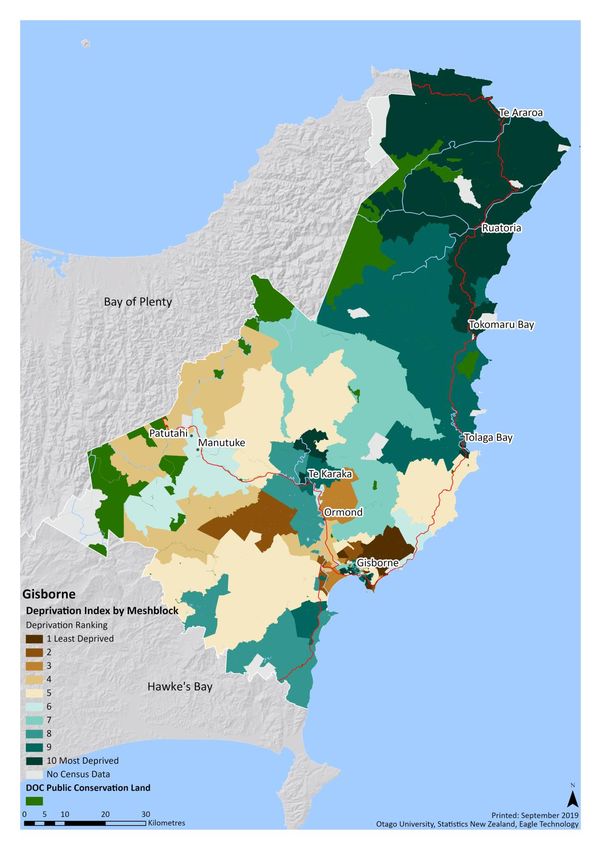
Figure 1: Land use map for Taranaki Region

10
2.3 Methods and Results
This case study relied on an existing review of interventions done as part of developing Taranaki’s
new Land and Freshwater Plan. To achieve a 10% reduction in DIN within the catchment, the ‘worst’
30% of farms would have to reduce N loss down to the 70th%ile of farm N loss rates for the
catchment. The estimated average cost per farm captured by this obligation would be about
$55,000 annually. At a catchment scale, these costs total about $825,000 and $2.4 million annually.
The analysis showed that further, much more draconian interventions will be needed to meet the
nutrient ‘bottom lines’.
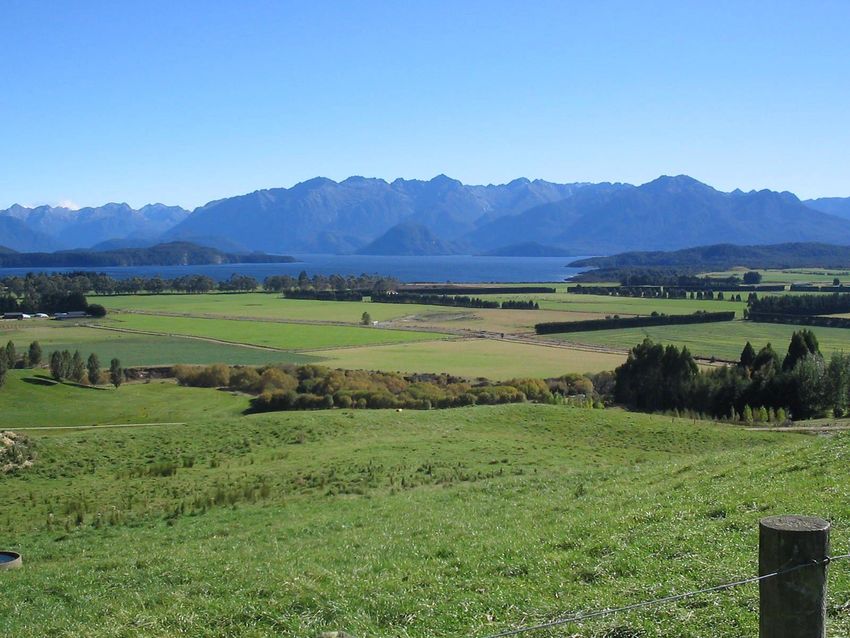
Image 1: Mangawhero-iti Stream in the Waingongoro River Catchment (photo taken by TRC staff)
113 Waikato – Nutrient ‘bottom lines’ in the Waikato and Waipa Catchments 3.1 Initial Conclusions The National Policy Statement for Freshwater Management contains a proposal for nutrient attributes that include ‘national bottom lines’ for nitrogen and phosphorus. The proposal means that, at least in some parts of the catchment, the proposed nutrient limits can be expected to be considerable additional constraints on land use activities. For instance, initial modelling was only able to achieve the proposed nutrient limits if widespread afforestation occurred. Once the limits have been fully achieved, annual land use profitability is estimated to be 11% lower. Modelling suggests that the value derived from forest-based industries may eventually replace pastoral farming, but the transition period may see a small reduction in gross domestic product (up to 0.9%) in the interim. 3.2 Setting The Waikato and Waipā river catchments cover more than 11,000km2, or around 45% of the region. The Waikato River flows 425km from Lake Taupo through the territorial authorities of South Waikato, Waipā, Hamilton and Waikato, joining with the Waipā River at Ngāruawāhia before continuing on to Port Waikato. The Waipā River has its headwaters in the Waitomo District, flowing through Ōtorohanga and Waipa and Waikato Districts before flowing into the Waikato river. On their way to the Tasman Sea, the rivers traverse volcanic pumice, limestone and peat country. Land uses include dairy, drystock, forestry and horticulture, as well as urban centres including Hamilton City, Cambridge, Ngāruawāhia, Huntly, and Ōtorohanga. There are around 20 large municipal or industrial wastewater treatment plants along the river. The combined catchment is currently the subject of Waikato Regional Plan Change 1, which has been notified and submissions are being heard by commissioners. The objective for these catchments is set out in the Vision and Strategy for the Waikato and Waipa rivers, which was deemed into the Waikato Regional Policy Statement by Treaty Settlement legislation, and which takes precedence over a National Policy Statement. The Vision and Strategy aims to restore and protect the catchments so that they are enable safe swimming, gathering of mahinga kai, and healthy ecosystems. Plan Change 1 is seen as a first step in this process, focusing on nutrients, sediment and bacterial contaminants, and aiming to get 10% of the way to the objective in 10 years. 3.3 Methods and Results This case study focuses on the proposed bottom line nutrient attributes for dissolved nitrogen (DIN) and phosphorus (DRP), which would have to be achieved. It builds on earlier work done for this proposal by the Technical Leaders’ Group (TLG) that was established to inform the Healthy Rivers/Wai Ora project. Neither the cost of implementing and enforcing the policy, nor the benefits of the policy are considered here. 12
This modelling framework is used here to estimate the least-cost way of achieving the nutrient
limits. Sub-catchments were constrained so that if current monitoring data indicated they exceeded
the limits, mitigations would have to be put in place to reduce discharges; if they did not exceed the
limits, they were simply required to have no further degradation from current levels. There may be
exemptions for streams with naturally high levels of nutrients, for example, for phosphorus levels in
some of the pumice soils in the upper Waikato catchment. This was not taken into account in the
modelling, which may result in some over-estimation of the costs of meeting the limits.

Initial model runs (with fixed land use) did not find a feasible solution. There may be various reasons
for this result; one is that it is simply not possible, given the mitigations available (but also, this may
reflect the naturally high levels in some places). A subsequent run of the model, this time allowing
land use change, produced a result suggesting that widespread afforestation was the most cost-
effective approach to meeting the nutrient constraints. In particular, it found that, for the most part,
afforestation of drystock farms would be the most cost-effective, since the opportunity cost would
be lower than for converting dairy to forest. It also suggested a considerable amount of edge-of-
field mitigations (such as bunds, sediment traps, wetlands) would be required. Of course, this simply
implies that to be the cheapest approach, not that it would necessarily happen in reality. It is not
clear how such an approach could be practically implemented, nor is it certain whether decision-
makers in reality would choose to go down this path. Practicality and equity are also important
policy criteria to consider – not just financial cost.

While land use change may not happen in the way predicted by the model, it was used as an input to
the Waikato Economic Futures Model to provide estimates of what such changes might imply for the
wider economy. This ‘input-output’ model takes account of the flow-on effects to suppliers and
customers of different sectors. The results of this second phase of modelling suggests that, as well
as pastoral farming, there would be substantial impacts on dairy and meat manufacturing,
agricultural support services, and the finance industry in the Waikato region as land use changed. In
total, assuming that land use change takes place over the next 10 years, the Waikato Economic
Futures Model suggests that, by 2031, regional gross domestic product could be around 0.9% lower
than it would otherwise be. If we assume that all of the afforestation is for production forestry, then
ultimately, once the trees are established and harvesting and processing begin, the net effect on
regional GDP may actually be positive. However, the local economies may look very different, with
forest-based industries essentially replacing pastoral farming in some places.

3.4 Limitations
All models are simplifications of reality, and have limitations. The nutrient mitigation model may not
reflect the true variation of mitigation costs on individual farms, or the true effectiveness of those
mitigations. The economic model assumes static prices and does not allow for substitution of
technologies or inputs, which leads to over-estimation of economic effects. On the other hand, the
WEFM does not consider the costs of re-purposing human and technological capital for a large
structural change such as widespread afforestation.

                                                                                                        13
4 Greater Wellington – Review of Landcare report for the Ruamahanga Catchment (Wairarapa) 4.1 Initial Conclusions In developing the Essential Freshwater Package, the Ministry for the Environment commissioned Landcare Research to assess the economic impacts of nutrient and sediment reduction scenarios for the Ruamāhanga catchment. Landcare modelled practice-based and outcome-based scenarios across the catchment, including three nitrogen loss limits: 30kg, 50kg and 70kg N/ha/year. The two higher nitrogen loss limits did not affect many farms so had few benefits for nutrients or sediment. The 30kg nitrogen loss limit had a modest reduction in nitrogen (-6.7%) and a corresponding decrease in farm revenue. Most of the farms affected are dairy or mixed arable and, while mitigation achieves most of the gains, minor land retirement is needed. The whaitua committee process recommended a catchment reduction of 9% nitrogen (i.e. a greater reduction than modelled in the Landcare report). Their recommendation will be carried forward into the next plan change. A load reduction of 9% will achieve the dissolved inorganic nitrogen (DIN) ‘bottom line’ but several sub-catchments will need to have much higher reductions: Otukura requires a 19% reduction, Parkvale 13% and Kopuaranga 12%. The Parkvale sub-catchment is the only ‘Nitrogen-cap’ catchment under the government proposal in the Ruamahanga catchment. The impact on farmers from the government proposal is similar to what is being contemplated by the community at present. 4.2 Setting The Ruamāhanga Catchment lies in the Wairarapa, to the east of the Wellington Region. It is roughly 359,000 ha in size and the main land uses are sheep and beef (46%), native bush (24%), dairy (8%), mixed cropping (5%), dairy support (3%), and forestry (3%). There are 5 rural towns and approximately 45,000 people. The Ruamahanga whaitua is a special place for the iwi in the catchment, Kahungunu and Rangitane. Wairarapa Moana (the lakes) are of particular importance. Water quality in the Ruamāhanga Catchment ranges from very good in the Tararua headwaters to quite poor in the valley floor streams, and very poor in Lakes Wairarapa and Onoke. River, lake and wetland habitats are highly modified. The main water quality issues are E. coli, periphyton biomas, and phosphorous. Nitrogen is more of a localised issue and almost all farms in the catchment have nitrogen losses of less than 50kg N/ha/year. Greater Wellington Regional Council, through its whaitua committee process, is proposing to reduce the total catchment nitrogen load by 9%, phosphorous by 34% and sediment 28%. Reductions in E. coli are required almost everywhere. 14
4.3 Methods and Results
This case study reviewed the report produced by Landcare from a regional perspective. Landcare
used the same catchment economic model as that relied on for the whaitua process (2017-18) to
test a number of scenarios to manage nutrients and sediment. The scenarios were primarily
practice-based with some outcome-based options (i.e. nitrogen loss limits). The results from the
two modelling processes are comparable.

The scenarios included a ‘business as usual’ (BAU), which involved the existing policy approach
including new provisions in the regional plan, but not whaitua specific provisions. Practice based
scenarios included sets of mitigations and land use changes. Outcome based scenarios included
annual N loss rates not exceeding 30kg, 50kg, and 70kg N/ha/year. Several combination scenarios
were also considered to estimate maximum mitigation potential.

In terms of reducing nitrogen loads the modelling showed that the community’s expectations
through the whaitua process are similar to those in the Government proposal (i.e. the proposal does
not increase the expected nitrogen reductions). The existing policy approach (BAU) in the
catchment is more stringent than most of the stock exclusion mitigations modelled. Stock holding
areas for dairy and dairy support are cost effective for mitigating N, but do not reduce total N by
more than 7%. Other mitigations for sheep and beef farms are required to significantly reduce P and
sediment loads.

Combination scenarios produced noticeable reductions in net farm revenue, between 7% and 46%.
The benefits of multiple practices are significant with N losses reduced by 10 to 44%, while
phosphorus losses and sediment losses are reduced by 5 to 64% and 3 to 48% respectively.

                                                                                                15
5 West Coast – Stock Exclusion Regulations 5.1 Background The proposed Stock Exclusion Section 360 Regulations requires that land with a slope of 5 degrees or less requires fencing if it borders a river, lake or wetland. The timeframes for this to be completed depend on the farming activity, stocking rates and species, and water body type. Like many of the more remote, less populous parts of New Zealand, the West Coast has always been heavily reliant on primary industries to sustain its communities. Contraction of the mining and agricultural sectors in recent times has led to a regional economic decline, which is evident from a range of economic measures. While there is an increased focus on tourism as a significant source of income, agriculture (and predominantly dairying), remains the West Coast’s largest industry. The regions fame for rain is well deserved with 2.5 m to 12 m of rain per year. Such a climate can reduce farm productivity, particularly on soils with poor drainage and fertility. Major landscaping, using the formation of hump and hollows, has been widely used to improve drainage and productivity on farms. High rainfall, combined with these landscape features, can create a higher proportion of concentrated wet areas per farm. Image 2: ‘Humping and hollowing’ on the West Coast 16
5.2 Conclusions
Useful data was sourced from government organisations (e.g. Statistics NZ), open source GIS, and
industry representatives. A large proportion of agricultural activity occurs on land with a slope of 5
degrees or less. According to Westland Milk Products an estimated 73% of waterways that occur on
dairy farms are currently fenced, but a large number of these are unlikely to meet the proposed 5 m
average setback criteria. It is estimated that the majority of lowland agricultural waterways will
require fencing or fence repositioning. This work is likely to be spread over the next 16 years.

Benefits from increased stock exclusion include a boost for local providers of farm plans, fencing
labour, and materials. Stock exclusion will contribute to a reduction in faecal contamination and
improved swimmability in catchments that are dominated by agricultural landuse. While less
measureable, stock exclusion will assist with people’s perceptions of agricultural sustainability at a
local and national scale. This could benefit the West Coast’s two largest industries – tourism and
agriculture.

Burdens associated with stock exclusion start with the basic costs of fencing. Assuming all streams
on low slope land and over 1 m wide require fencing or re-fencing, total estimated capital costs
range from $16 to $33 million. This riparian area represents 1% of the West Coast’s productive
agricultural land.

A survey of farms indicated that most had hump and hollowed land, with a large proportion
occurring on some properties. Water in these hollows tends to be ephemeral and less than 1 m
wide, but initiatives for tackling contaminant migration from hollows might be an option via the farm
planning process. If fencing hollows was considered necessary it could require substantial fencing
and land retirement. Deprivation indices suggest that socioeconomic conditions are reasonable in
major agricultural areas. However, contractions in the agricultural sector and across the West Coast
as a whole raise concerns as to how sustainable these costs will be in an already struggling economy.
Farms most at risk include those in wetter areas with poorer drainage. This could include clusters of
farms and impact on certain communities more heavily than others.

                                                                                                   17
6 Hawke’s Bay – Water takes
Increasing demand for water by agriculture, industry, urban users,
and for recreation makes proper management and conservation of
water supplies more and more important. Proper management of
water use means understanding how much water is used for say,
irrigation or municipal and industrial uses. Properly selected and
maintained water meters can be the easiest and most accurate way
to measure water flow. Measuring and reporting of water use is
essential to inform decision making around regional water
management. It should also be considered a tool for water users to
have a better understanding of their own water use and system operation.
Between 2010-2016 consent holders were required to install water measurement devices in
accordance with the Measurement and Reporting of Water Takes regulations 2010. Hawke’s Bay
Regional Council envisage the process to install telemetry will be similar to this process, although the
detail will require consideration. The difference however is that of the 2,746 meters that have
already been installed in Hawke’s Bay, 48% of those are also telemetered. This means Hawke’s Bay
is starting from a good base by also having a good understanding of the technical detail regarding
equipment, installation, servicing and data management.
Table 1 breaks down the number consents in Hawke’s Bay and the corresponding number of water
meters installed. Some consents have multiple takes, each take point (meter) would require a
telemetry unit. To implement the proposed regulations in the Government’s recently released
Essential Freshwater Package, Hawke’s Bay Regional Council anticipate a further 1419 telemetry
units would need to be installed for current consented water takes.
Table 1: Water meter and telemetry installation in Hawke's Bay 2019
Rate of Consents Water Water Proportion Gap to fill to Estimated
water meters meters of meters proposed minimum
take telemetered telemetered Regulations installation
costs ($)*
> 20 l/s 1,082 1,789 1066 60% 723 $725,000
> 10 l/s 581 652 191 29% 461 $460,000
> 5 l/s 208 216 45 21% 171 $170,000
< 5 l/s 328 83 22 27% (61)
Unknown 10 6 3 50% (3)
TOTALS 2,209 2,746 1,327 48% 1355 (64) $1,355,000
*Figures are indicative only. Assumes costs are all for ‘simple’ installations. Additional costs not
included for complex installations, annual servicing, repairs, maintenance and general running
operations.
18Consented volume also needs to be a consideration. For Hawke’s Bay Regional Council, if all
consents 20L/second and over were telemetered and added to the existing telemetry, this would
cover 89% of the consented volume. The cost benefit of getting the remaining 11% of consented
volume telemetered warrants careful consideration.
Installation costs in the proposal are relatively accurate for a simple install. However not all sites are
simple and would incur considerable extra cost. In the council’s experience, a simple installation of
one site costs $1000-$1500 to install and $20-25/month for service provider costs. There are
additional costs such as a new battery every 3-5 years and maybe a refurbished unit at about $300-
$500. There is also an annual council charge of $200 per consent. For more than one meter or data
type, this costs a further $2200-$3000 for a base station or radio and $360-$850 per year for
monitoring. A recent difficult site with no cell phone reception cost $10,000 for the installation.
Service providers also charge year round regardless of the seasonal nature of the water use.
There is a perception that collecting data at 15 minute intervals will mean more accurate data. That
is not necessarily the case. Telemetry just allows for more frequent, real time collection and
reporting. If the data is not verified, the telemetry could be reporting incorrectly for a considerable
amount of time. This could render the incoming data unusable or unreliable for informed decision-
making.
It is critical that there are systems in place to compare what the water meter is reporting to that of
the telemetry unit, at a suitable frequency. In Hawke’s Bay Regional Council’s case, to achieve this
there will need to be additional staff dedicated to that role. For installation costs alone for over
1300 new telemetered sites, the cost is estimated as at least $1.35 million.
Overall there needs to be consideration of the installation, maintenance and service provider costs
on the consent holder for those with low volume takes. There also needs to be consideration on the
added costs on Councils for collecting and verifying the additional data.
197 Bay of Plenty – Nutrient ‘bottom lines’ and farming reulations 7.1 Initial conclusions The proposed DIN and DRP attributes are likely to have little impact in the Bay of Plenty. Although several sites (25 of 45) would fail the proposed bottom lines, most of these (20) have either naturally high nutrient levels (e.g. due to geothermal activity) and/or have sensitive receiving environments (e.g. estuaries, lakes or hard-substrate streams vulnerable to conspicuous periphyton growth) that are likely to require more stringent levels of nutrient reductions. At this stage, it is unclear what environmental benefits there would be (beyond the existing NPS-FM) for the remaining 5 sites (all in the Tarawera and Rangitāiki WMAs) that would fail the proposed DRP bottom lines, or if bottom lines would be achievable through mitigation or land use change. The proposed intensification rule is likely to restrict (or totally prohibit) large conversions to irrigated horticulture (e.g. kiwifruit), which is currently the predominant land use change trend in the Bay of Plenty. Although there are presently no available tools to accurately assess contaminant losses from horticulture (e.g. avocado and kiwifruit) at a property level, it is generally expected that irrigated horticulture would have lower contaminant losses than pastoral and arable land uses, under good management practice. Irrigated horticulture also has significant economic benefits. The proposal may result in these environmental and economic benefits being forgone, for no apparent environmental gain. The proposal would have environmental benefits for high risk land use changes. Farm Plans are expected to deliver significant benefits by tailoring mitigation practices to individual property circumstances, encouraging voluntary behaviour change and generating baseline information. While significant costs are anticipated in developing, auditing and implementing Farm Plans, these are considered to be justified for the expected environmental benefits. BOPRC estimates that at least 12 full time Farm Planners will be required to deliver these across the whole region by 2025. The choice of Upper Rangitāiki (upstream of confluence with Otangimoana Stream) as a high N catchment appears to ignore the natural nitrogen levels of the sub-catchment and receiving environments. The proposal would affect 5 pastoral landowners, including Rangitāiki Station (Landcorp/PAMU) and Lochinver Station. Application of the percentile based reduction approach is questionable given the small number of landowners, particularly for each pastoral land use. A Rangitāiki catchment model which is currently in development estimates that application of good management practice in the sub-catchment would result in a 4% reduction in total nitrogen load but a 23% reduction in baseline operating profit, with most impact falling on drystock farmers. The environmental benefits of stock exclusion are broadly understood around the country. While there will be costs for pastoral landowners in new or re-located fences and retired land in setbacks, these are able to be spread over several years and again are considered justified for the expected environmental benefits. 20
7.2 Setting
Relative to other regions, water quality in the Bay of Plenty is generally good, due largely to the
significant extent of native and exotic forestry in the region. However, there are water quality
issues, particularly in the Rotorua Lakes and in harbours and estuaries in the region, which are
particularly sensitive receiving environments.

The region covers a total area of 1.2 million hectares. Nearly half of this area is in native bush and
scrub (mostly within protected areas), and nearly one-quarter is in exotic forestry. The next most
common land uses are dairy, drystock and horticulture. About a third of the region is in Māori-
owned land under a range of forms of tenure; the vast majority of this land is currently in exotic or
native forestry.

There are a large proportion of small farms in the Bay of Plenty; most of these are dedicated to
horticulture (mainly kiwifruit and avocado). This is significant because many properties would fall
outside of the proposed NES-FW (clause 26) size thresholds.

In 2016/17, agriculture (including horticulture) was the third largest direct contributor to the
region’s GDP (7%), after rental/hiring/real estate and construction. Primary manufacturing was the
sixth largest contributor (6%). Horticulture, and particularly kiwifruit, is the most valuable industry
within the agriculture sector, accounting for the largest proportion of the agriculture GDP
contribution described above. The agriculture sector also has a significant indirect (through other
industries) and induced (through household income) impact on the regional economy. The primary
sector is also a significant employer in the region.

Given this context, a balanced and considered approach to improvements in water quality and
ecosystem health are required in the Bay of Plenty. It will be important to consider the required
extent of water quality improvements, whether they are realistic, how we achieve them
(effectiveness and efficiency of the proposals), and the pace at which we get there. The preliminary
assessment presented here may help with those considerations.

                                                                                                    21
7.3 Methods and Results
Proposal Method Results
The analysis relied on available monitoring
DIN & DRP
data and a qualitative assessment for each As reported above
attributes
site that failed the proposed bottom lines.
It is estimated that 192 properties covering
GIS analysis based on BOPRC land use
9,309 hectares across the region would be
Intensification dataset, land deemed suitable for
impacted by 2025. This is only a fraction of
rule horticulture conversions and LINZ property
all land that would be available for
boundary dataset.
horticulture conversions.
FP development & auditing costs:
~$3.6m/year
Analysis based on Agricultural Production GMP implementation costs: ~35m/year –
Census data on number of farms by size, spreadable over several years, equivalent
existing numbers of nutrient management to 5% in operating profit across BoP,
Farm Plans
documents, and GIS analysis. Drawing on although range from 2% for gold kiwifruit
GMP implementation costs as estimated by grower to 24% for low intensity sheep &
Matheson et al. 2018. beef farmer.
12+ full time Farm Planners estimated to
be required to cover whole region by 2025
High N GIS analysis and the results of an existing
As reported above.
catchment Rangitāiki WMA catchment model
Setbacks: ~1.1% of pastoral land (2,751 ha)
GIS analysis based on BOPRC waterbody and Fences: ~4,000 km (new or re-located)
Stock land use datasets, MFE low-slope dataset Fencing costs: ~39.2m (spreadable over
exclusion and estimates of stream width at MALF several years)
(Booker et al 2015). Lost profit in setbacks: ~2.9m/year
(spreadable over several years).
228 Southland – Nitrogen Cap in 5 ‘high nitrate-nitrogen’ catchments
8.1 Initial Conclusions
The Nitrogen Cap proposal (Option One) applies to 13 catchments where “nitrate-nitrogen levels are
in the highest 10 per cent of monitoring sites and regional rules implementing the NPS-FM are not
in place”. This N-Cap proposal sets a nitrogen loss threshold for catchments or sub-catchments,
distinguishing between areas with similar biophysical characteristics (e.g. poor soil drainage and high
rainfall). The Ministry for the Environment intends the proposal to target poor environmental
performance in pastoral farming (ahead of full implementation of the NPSFM in a region) and to be
achievable. The specific design of a region’s approach is up to each regional council.
In Southland, the N-Cap proposal is likely to be similar to the region’s current policy pathway – as
necessary under the existing National Policy Statement for Freshwater Management (2014 as
amended in 2017) – but it is likely to shorten the timeframes farmers have, to implement actions for
reducing their nitrogen losses – likely to be The proposal can reasonably be expected to have a wide
range of short to medium term benefits because the region generally has short transit times for
nitrogen as it travels through the land. Any improvements may show up earlier than elsewhere,
which is important in Southland where some waterbodies are degraded and may be approaching
ecological thresholds. The proposal may also have additional benefits by helping to avoid
remediation or restoration costs. It may create additional costs if farms invest in actions but are still
unable to meet nutrient limits (or targets) when they are set through the region’s NPSFM process to
come.
8.2 Setting
Under the N-Cap proposal, Southland has 5 N-Cap catchments: Matāura, Waihopai, Ōreti,
Waimatuku, and the Aparima. These catchments collectively cover all of the developed land in the
region (except for the Catlins, Waituna, and Waiau Catchments, and the Te Anau Basin). Since 1840,
the area of wetlands on land now in private ownership is estimated to have reduced from 220,000
ha to less than 9,000 ha by 2015 (3.2% of the original area). The drainage of wetlands, and lowland
soils more generally, has changed the hydrology across these areas so that there is comparatively
little time for excess nutrients to attenuate.
Between 1990 and 2014 there has been an estimated 30% decline in the total area of land for
drystock, from roughly 1.1 million ha to 795,000 ha, and an increase in the area for dairy from
16,000 ha to 255,000. Over a similar period, the total stock units in Southland has increased by
roughly 1.5 million to roughly 11 million. Agriculture’s share of the regional economy has generally
been increasing, although it fluctuates. Most dairy farms in Southland are within the 5 N-Cap
catchments. Almost all of Southlander’s drinking water is sourced from the surface and
groundwater in these catchments, and there are few alternate sources. Four of the five catchments
are connected to estuaries, which are highly valued as habitats for threatened species, mahinga kai,
amenity, and recreation.
23Figure 2: Land use map for the 5 Southland catchments identified in the N-Cap proposal This map is indicative only of the spatial coverage of the N-Cap proposal in Southland – actual catchment boundaries will need to be determined. 24
8.3 Methods and Results
This case study builds on earlier work done1 for the N-Cap proposal and continues to use the
Southland Economic Model, which focuses on the costs of actions to achieve a proposal. It assumed
all farms in the five catchments will have farm plans by June 2022 and tested 10% or 20% nitrogen
loss reductions to achieve thresholds set at 70%, 80%, or 90% (six scenarios in total). Few drystock
farms are likely to be captured by the proposal because they are unlikely to have nitrogen losses
equivalent to dairy with similar soils and rainfall. The results of the modelling were then considered
alongside possible avoided costs and non-market implications.

When complete, the modelling results will cover direct costs to the dairy industry and indirect costs
for the regional economy. These costs are likely to occur anyway (i.e. without the proposal) but at a
later date. There are likely to be implications for dairy support but they are difficult to capture.
Drystock farms that raise or graze dairy cows or supply dairy farms with supplementary feed may be
indirectly impacted. The proposal’s reliance on Overseer may constrain the use of the most cost-
effective mitigations. The requirement for farm plans across much of Southland will be challenging
and some non-dairy farms may be unable to accurately represent their farms in Overseer.

1
  Moran and Keenan (2019) Initial Economic Advisory Report on the Essential Freshwater Package. Local
Government New Zealand. This work draws on existing research from The Southland Economic Project
(https://www.es.govt.nz/council/major-projects/Pages/Southland-Economic-Project.aspx)

                                                                                                   25
9 Southland – Wastewater National Environmental Standard for
Gore District
9.1 Initial Conclusions
Central Government has signalled in its discussion document that they will be proposing a National
Environment Standard for Wastewater Discharges and Overflows (Wastewater NES). The new
standard would prescribe requirements for setting consent conditions on discharges from
wastewater treatment plants and engineered overflow points. The requirements could include
(among other things):
“minimum treatment standards or ‘limits’ for nationally-applicable wastewater quality
parameters, including biochemical oxygen demand, suspended solids and bacteria”; and
“approaches for incorporating culturally acceptable wastewater treatment processes.”
It is also noted in the discussion document that wastewater operators would be expected to
participate in nutrient allocation regimes that may be established in the future. Other proposals,
such as a higher standard for primary contact recreation, are also extremely relevant to wastewater.
Although the details about the specific requirements in the Wastewater NES are unknown, the focus
on the contaminants highlighted above may mean minimum treatment standards will be challenging
for any community with oxidation ponds. Existing research2 from The Southland Economic Project3
makes it is possible to draw some general conclusions about its implications for Southland’s towns.
In Southland, town wastewater treatment has usually been designed to reduce suspended solids and
biochemical oxygen demand. While some schemes have land-based discharges, many towns
discharge treated wastewater into the region’s rivers and streams. There is a wide range of
technologies used but, on a per household basis, the schemes were relatively consistent in their
performance for suspended solids and biochemical oxygen demand. The performance for E. coli was
variable across the towns, and even more so for nutrients, which are a more recent focus for
wastewater treatment. The water quality standards for stock drinking, contact recreation, shellfish
gathering and drinking water require lower concentrations than those generally achieved by the
treatment systems.
The location of a wastewater scheme is critical to what may be needed and what is possible. The
capacity to further remove contaminants depends on the contaminant and the design of the existing
wastewater treatment system. Upgrades designed for further treatment of a single contaminant
were lower cost whereas several contaminants were higher cost. Higher cost scenarios usually
involved sophisticated technology (mechanical and biological plants) that can mean increased risks
of failure. Key site conditions needed for land treatment are unlikely to exist within a 4km radius for
most towns. Treatment processes for reducing either phosphorus or E. coli were simpler and lower
cost than nitrogen.
2
Moran, McKay, Bennett, West, and Wilson (2018) The Southland Economic Project: Urban and Industry.
Technical Report. Publication no. 2018-17. Environment Southland.
3
https://www.es.govt.nz/council/major-projects/Pages/Southland-Economic-Project.aspx
269.2 Setting
This case study focuses on Gore District but the research it draws on is for towns across Southland.
Gore District lies roughly at the centre of the Matāura Freshwater Management Unit, which covers
around 640,000 hectares (or 20% of the region). Most of the land is developed and the economy is
based around primary industries and major manufacturing and processing industries for meat, milk
and timber. Gore is an important rural service town at a crossing of the Matāura River; Matāura is a
smaller rural service town located downstream of Gore at the Matāura Falls. Residents in Gore and
Matāura tend to have a lower socioeconomic status then in rural areas although all of the local
communities are strongly interconnected. The two towns are in the middle of a chain of towns that
runs along the Matāura River for roughly 240km.
The Matāura River and Fortrose/Toetoes Estuary are highly valued for mahinga kai and recreation
but are coming under increasing stress. There is a Water Conservation Order (1997) to protect
fisheries and angling amenity features and a freshwater mātaitai reserve at Matāura township to
recognise its importance for customary food gathering (kanakana and inanga). The Crown has
recognised the significance of the Matāura River to Ngāi Tahu, and it is linked to several important
Ngāti Māmoe and Ngāi Tahu tūpuna.
Image 3: Matāura township looking south across the Matāura River Mātaitai Reserve (photo taken by Emma Moran)
279.3 Methods and Results This case study draws on existing municipal wastewater research for Southland that is likely to be directly relevant to understanding the impacts of a Wastewater NES. The research was done within The Southland Economic Project by Southland’s four councils (Gore District Council, Invercargill City Council, Southland District Council, and Environment Southland). It investigated the existing performance of the wastewater schemes for eight Southland towns across the region, and the effectiveness and financial costs of upgrade scenarios. The upgrades looked across 5 contaminants: suspended solids, biochemical oxygen demand, total nitrogen, total phosphorus, and E. coli. In this case study results are reported specifically on suspended solids, biochemical oxygen demand and bacteria, for Gore and Matāura but the conclusions are drawn from the research in its entirety. In total, 8 upgrade scenarios were modelled for Gore and 4 upgrade scenarios for Matāura. For both towns, discharges to land scenarios were included. Each upgrade has strengths and weaknesses in its cost or treatment capabilities for each contaminant. The upgrades include options that are either additional or complementary to the existing base system and/or replace the existing base system. Gore’s wastewater treatment plant was built in 1973 and it has had significant upgrades over the years, including the installation of an Actiflo Plant to reduce phosphorus and suspended solids. The scheme has combined stormwater/wastewater over about 40% of the network, and it accepts tradewaste from meat and milk processing plants. For Gore, the capability of the existing system means that the upgrades generally provide a relatively small improvement in contaminant reduction. The upgrades have a wide range of annual costs per household and the costs did not necessarily relate to each upgrade’s capability to treat particular contaminants. Matāura’s wastewater treatment plant was built in 1982 and it consists of an oxidation pond and wetlands. For Matāura, using the existing system requires these processes to also be optimised and managed as effectively as possible. Most of the upgrades were not overly effective in further reducing the amount of E. coli in the discharge, as the existing system performs well for this contaminant. The land-based discharge scenarios gave the widest range of improvements for the contaminants and were also the most expensive, even before the full costs of purchasing suitable land are included. 28
10 Gisborne – Implications for whenua Māori

10.1 Initial Conclusions
The Essential Freshwater Package has economic implications, in terms of Maori rights and interests
in water and the mana of hapu4. The prioritisation articulated in Objective 2.1 of the proposed
National Policy Statement for Freshwater Management, which then flows through into the policies,
appears to be silent on the mana of hapu over freshwater. It separates cultural aspirations from
economic aspirations whereas the owners of Maori land see them as one- land utilisation is
kaitiakitanga. Other relevant proposals are those around intensification and the freshwater module
of farm plans in the National Environmental Standards for Freshwater.

To test these implications, a case was developed for whenua Māori across the Tairāwhiti region,
focussed on two key strands: the utilisation of whenua Māori, and owner aspirations. Maori land
(whenua Maori) includes freehold and customary land: customary land is land held by Maori in
accordance with tikanga Maori; freehold land is where the beneficial ownership has been
determined by the Maori Land Court to be freehold order. Most whenua Māori is concentrated in
Waiariki (Bay of Plenty), Tairāwhiti (East Coast), Aotea (Manawatu/Wanganui/Taranaki) and
Takitimu (Northland). There is immense potential for some of this land to be highly productive.
However, owners of whenua Māori experience significant challenges to land development.

Historical circumstances around Māori land ownership and development mean iwi and hapū have
ended up at the ‘back of the queue’ for access to water, which limits their ability to develop land.
Through careful review, our national and regional water management system could better deliver on
the mana of water at the same time as supporting an economy that maximises value from fresh
water through wise use and investment5.

10.2 Setting
Across New Zealand, 68% of all Māori freehold land is in Land Use Capability classes 6 and 7,
meaning that this land is fairly marginal for all uses except forestry and some grazing. In Tairāwhiti
163,614ha of whenua Māori is Land Use Capability Class 6, 7 or 8. That equates to 88% of all
whenua Māori in Tairāwhiti. In the case of the Waiapu catchment, whenua Māori is prone to
extensive erosion issues. As well, the bulk of our Māori freehold land is concentrated in the
northern / East Cape area of Tairāwhiti, which is approximately 46% whenua Māori. This also
happens to be an area of high deprivation for the District.

4
  The mana of hapu confers a larger capacity than kaitiakitanga and is the basic concept of giving expression to
Māori rights. Mana covers both ownership (the right to use and possess against others), and the over-riding
authority to control the use and management. In custom the hapu held mana over their territorial lands and
waters.
5
 Briefing for the incoming Minister- Water Issues, 2017 https://www.beehive.govt.nz/sites/default/files/2017-
12/Water.pdf

                                                                                                             29
You can also read