SUBWAY AND TRAIN-INDUCED VIBRATION CHARACTERISTICS IN BUILDINGS AND ADJACENT OPEN FIELDS IN THE BOSTON AREA
←
→
Page content transcription
If your browser does not render page correctly, please read the page content below
SUBWAY AND TRAIN-INDUCED VIBRATION CHARACTERISTICS

  IN BUILDINGS AND ADJACENT OPEN FIELDS IN THE BOSTON AREA

                                          A thesis

                                        submitted by

                                      Pradeep Maurya

                          In partial fulfillment of the requirements

                                      for the degree of

                                     Master of Science

                                             in

                            Civil and Environmental Engineering

                                   TUFTS UNIVERSITY

                                        August 2012

Thesis Committee:

Dr. Masoud Sanayei, Ph.D., Chair

Dr. James A. Moore

Dr. Laurie G. Baise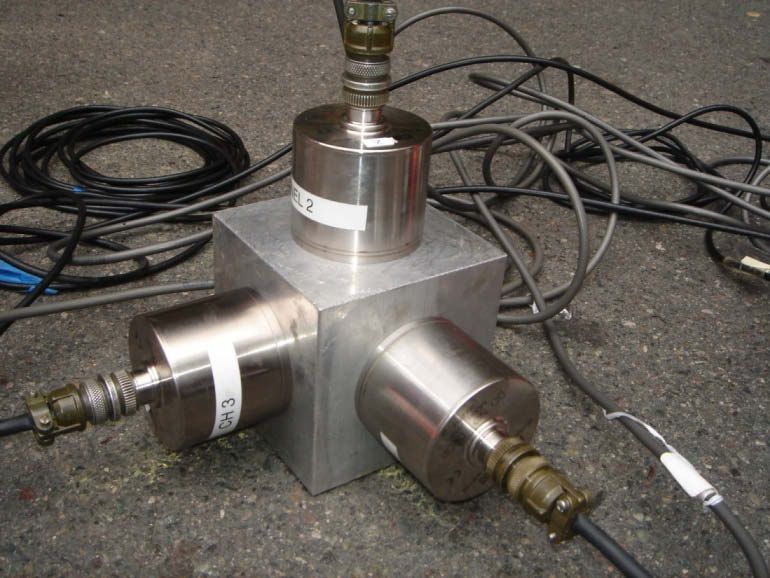
ACKNOWLEDGEMENTS

   I would like to express my heartfelt gratitude to all the individuals without whom this

research would not have been successful. Their invaluable contribution in one way or the other in

this research made this effort remarkable.

   My academic advisor, Dr. Masoud Sanayei, whose expertise and help gave new direction to

the research even at the difficult times. I can never forget the readiness of Professor Sanayei for

every morning rides to the vibration measurement sites even on Saturdays, Sundays and even

when he was not good at health. Also I can never forget his kindness and generosity which made

my existence at Tufts possible. His endless encouragement and appreciation of my every effort

kept me alive in this research. I will always be grateful to him.

   A deep and heartfelt respect to Dr. James A Moore of Acentech Inc. in Cambridge, MA,

whose contribution in this research cannot be described in a few words. His immense knowledge

and readiness to discuss every problem over email and conference call eased every task which

once looked like a hard nut to crack. His motivation, practical approach to every task and

ensuring my correct understanding about the topic was invaluable. I can never repay him for all

of the time and effort he volunteered in this research. Also, I would like to express my gratitude

to Gladys Unger from Acentech Inc. for coordination and lending equipment every time we

needed it.

   I would like to thank Dr. Laurie G. Baise and Dr. Eric Thompson whose contribution and

discussion gave me understanding about the interpretation of measured data associated with

                                                    1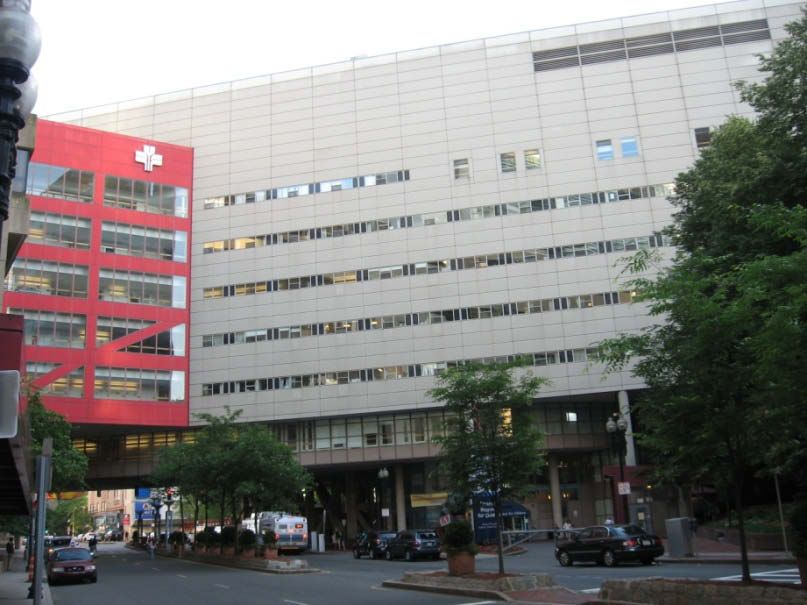
wave propagation in soil. Their insightful contribution was critical for completion of this

research.

   I am thankful to team from Massachusetts Bay Transportation Authority (MBTA), Claudia

Smith-Reid, Sorrenia Dillon, Debbie Miller and Paul Petruccelli for coordination and giving us

permission to measure subway-induced vibration inside Tufts Medical Center station and making

a dream come true.

   Also I would like to thank Dr. Gary Leisk and Micheal Doire at Tufts University, Gary

Desmond at MIT, Michelle D. Taylor at Park Street Apartment, Edward Pitts at Tufts Medical

Center, Ted O’Leary from Alexandria Properties and Dr. Sito Narcisse from English High

School, for giving us permission to measure vibration at the respective sites and help in the

completion of this research.

   “Friend in need is a friend indeed”. I can never forget invaluable assistance and time from

my friend Anish K.P., Merve Iplikcioglu and Sagar D. Shetty at critical times that I needed their

help in setups for field vibration measurements.

                                                                                   Pradeep Maurya
                                                                                   June 15, 2012

                                                   2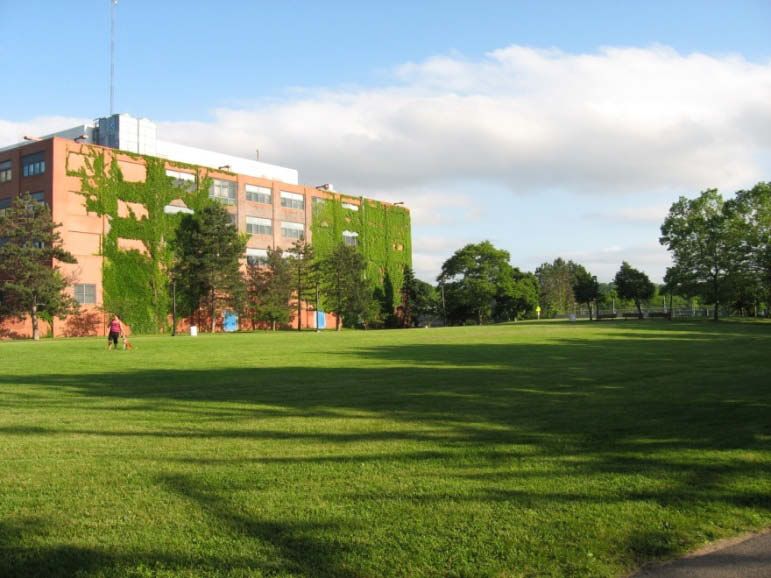
To my parents, Savitri and Shiv Shankar,

who taught me patience at difficult times

Thanks for your support and motivation

                   3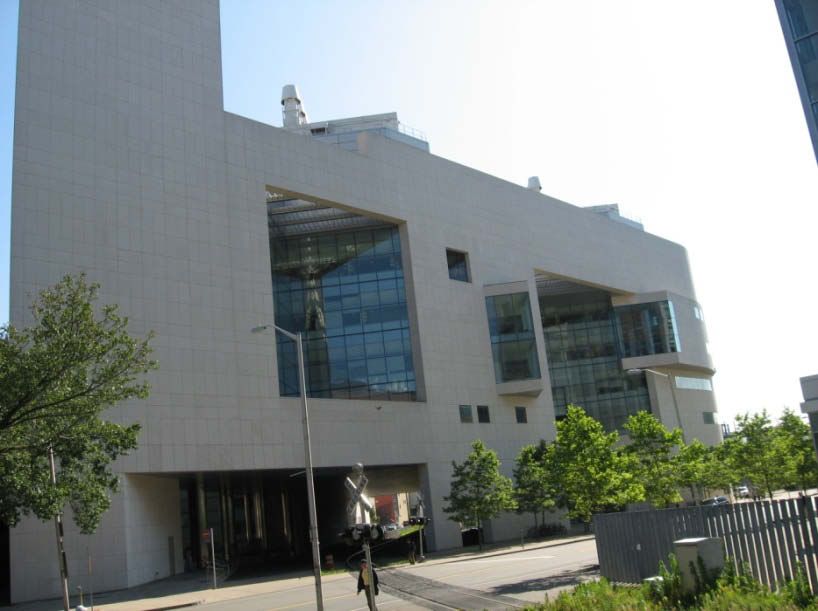
Table of Contents

List of Figures ........................................................................................................................... 6

List of Tables ............................................................................................................................ 9

CHAPTER 1 INTRODUCTION ............................................................................................ 11

CHAPTER 2 SUBWAY AND TRAIN-INDUCED BUILDING AND GROUND

VIBRATION IN BOSTON AREA ........................................................................................ 13

   2.1 Introduction ................................................................................................................... 13

   2.2 Vibration measurement sites in the Boston area ........................................................... 16

   2.3 Site instrumentation and vibration measurements ........................................................ 17

   2.4 Train-induced vibration measurement .......................................................................... 20

       2.4.1 Observations from train-induced vibration measurements .................................... 24

   2.5 Subway-induced vibration measurement ...................................................................... 30

       2.5.1 Observations from subway-induced vibration measurements ............................... 36

   2.6 Conclusions ................................................................................................................... 43

   2.7 Acknowledgements ....................................................................................................... 44

CHAPTER 3 ADDITIONAL TRAIN-INDUCED VIBRATION MEASUREMENTS ........ 46

   3.1 Vibration measurement site in Somerville, MA ........................................................... 46

       3.1.2 Observations from Somerville site: ....................................................................... 49

   3.2 Vibration measurement site in MIT-Cambridge, MA .................................................. 53

                                                                     4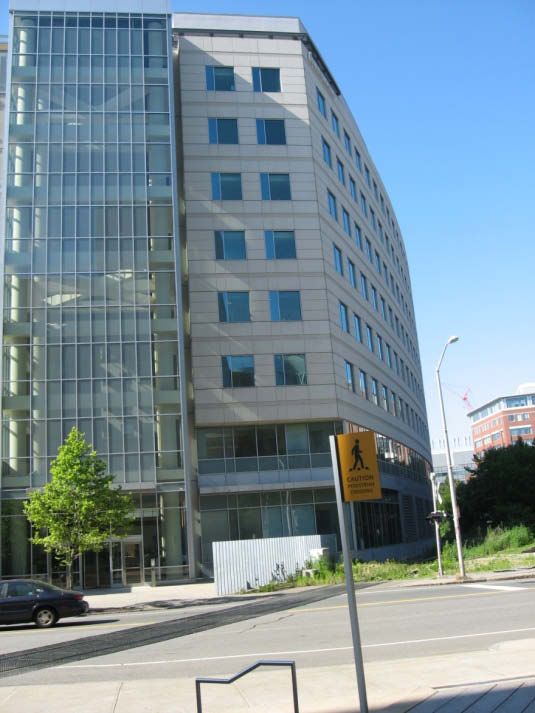
3.2.2 Observations from MIT-Cambridge site measurements ........................................ 55

CHAPTER 4 ADDITIONAL SUBWAY-INDUCED VIBRATION MEASUREMENTS ... 57

   4.1 Vibration measurement site in Jamaica Plain, MA ....................................................... 57

      4.1.2 Observations from Jamaica Plain measurement site:............................................. 59

   4.2 Vibration measurement site in Cambridge, MA ........................................................... 63

      4.2.2 Observations from Cambridge site measurements: ............................................... 64

CHAPTER 5 FUTURE WORK.............................................................................................. 70

CHAPTER 6 DATA ACQUISITION AND PROCESSING ................................................. 71

   6.1 Operational Instruction for RION DA20 data recorder ................................................ 71

   6.2 Data Extraction from wave file ..................................................................................... 74

   6.3 Data Processing and Peak hold analysis ....................................................................... 74

   6.4 One-third octave frequency band .................................................................................. 75

CHAPTER 7 SUPPLEMENTS TO TRAIN AND SUBWAY MEASUREMENT SETUP .. 78

   7.1 Measurement data in Medford, MA.............................................................................. 78

   7.2 Measurement data in Somerville, MA .......................................................................... 80

   7.3 Measurement data in MIT-Cambridge, MA ................................................................. 82

   7.4 Measurement data in Boston, MA ................................................................................ 82

   7.5 Measurement data in Cambridge, MA .......................................................................... 85

   7.6 Measurement data in Jamaica Plain, MA ..................................................................... 86

                                                              5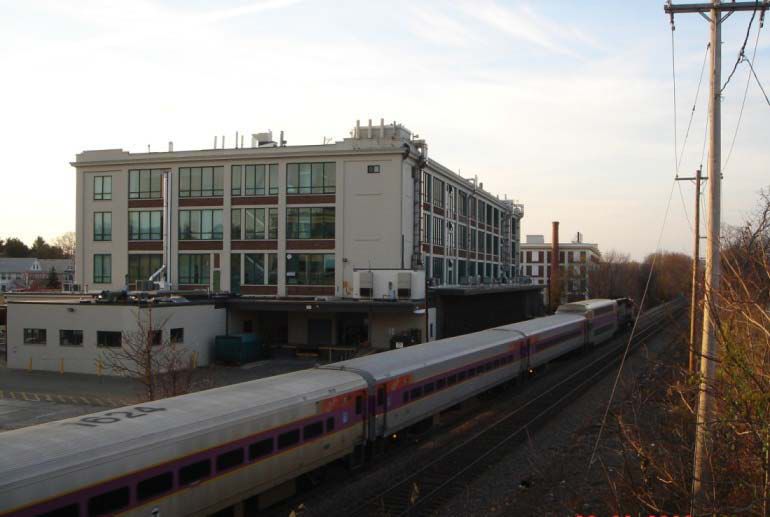
LIST OF FIGURES

Figure 2.3.1. Tri-axial accelerometer setup ............................................................................ 18

Figure 2.3.2. Train-induced vertical acceleration in Medford ................................................ 18

Figure 2.3.3. Subway-induced vertical acceleration in Boston .............................................. 19

Figure 2.4.1. Vibration measurement site in Medford, MA ................................................... 21

Figure 2.4.2. Vibration measurement site in Somerville, MA ................................................ 22

Figure 2.4.3. Vibration measurement site in MIT-Cambridge, MA ....................................... 22

Figure 2.4.4. Measurement setups A, B, and C in Medford ................................................... 23

Figure 2.4.5. Train-induced mean velocity components in open field, Medford ................... 24

Figure 2.4.6. Train-induced mean velocity components inside building, Medford ................ 26

Figure 2.4.7. Train-induced mean velocity components inside building, Somerville ............ 26

Figure 2.4.8. Train-induced mean velocity components inside building, MIT-Cambridge ... 27

Figure 2.4.9. Vertical velocity difference: Inside Building - Open Field ............................... 28

Figure 2.4.10. Train-induced mean vertical velocity in open field, Medford ......................... 29

Figure 2.4.11. Train-induced mean vertical velocity in open field ......................................... 30

Figure 2.5.1. Measurement site in Boston, MA ...................................................................... 31

Figure 2.5.2. Measurement setups in Boston: Plan................................................................. 31

Figure 2.5.3. Measurement setups in Boston: Elevation ........................................................ 32

Figure 2.5.4. Measurement site in Jamaica Plain, MA ........................................................... 32

Figure 2.5.5. Measurement setups in Jamaica Plain: Plan ...................................................... 33

Figure 2.5.6. Measurement setups in Jamaica Plain: Elevation .............................................. 33

                                                            6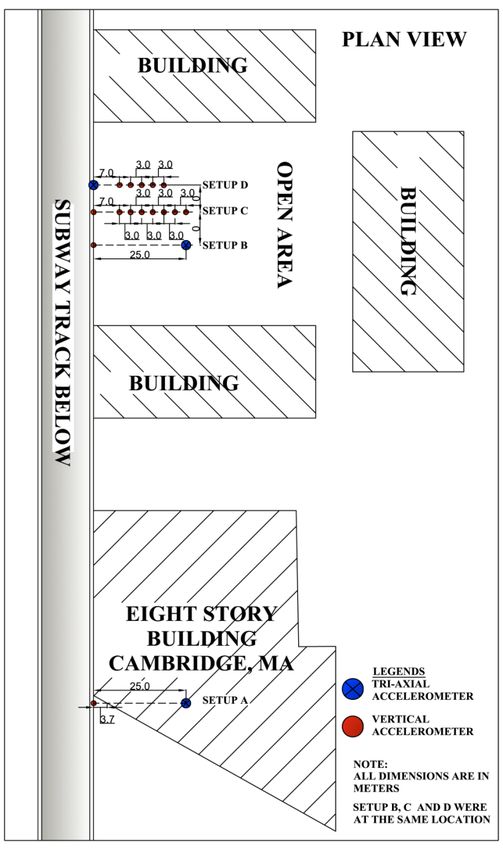
Figure 2.5.7. Measurement site in Cambridge, MA ............................................................... 34

Figure 2.5.8. Measurement setups in Cambridge: Plan .......................................................... 34

Figure 2.5.9. Measurement setups in Cambridge: Elevation .................................................. 35

Figure 2.5.10. Subway-induced mean vertical velocity inside MBTA station, Boston.......... 37

Figure 2.5.11. Subway-induced mean velocity in open field, Boston .................................... 38

Figure 2.5.12. Subway-induced mean velocity inside building, Boston ................................ 39

Figure 2.5.13. Subway-induced mean velocity inside building, Jamaica Plain ...................... 39

Figure 2.5.14. Subway-induced mean velocity inside building, Cambridge .......................... 40

Figure 2.5.15. Vertical velocity difference: inside building - open filed ................................ 41

Figure 2.5.16. Subway-induced vertical vibration in open field, Cambridge ......................... 42

Figure 2.5.17. Subway-induced vertical Velocity in open field ............................................. 42

Figure 3.1.1. Mean and absolute vertical velocity levels, Medford ........................................ 46

Figure 3.1.2. Measurement setup A, B, and C ........................................................................ 48

Figure 3.1.3. Tri-axial accelerometer setup in open field ....................................................... 49

Figure 3.1.4.Train-induced mean velocity components inside building ................................. 50

Figure 3.1.5.Train-induced mean velocity components in open field .................................... 50

Figure 3.1.6. Train-induced mean vertical velocity ................................................................ 51

Figure 3.1.7. Train-induced mean longitudinal velocity......................................................... 52

Figure 3.1.8. Train-induced mean transverse velocity ............................................................ 52

Figure 3.1.9. Train-induced open field mean vertical velocity ............................................... 53

Figure 3.2.1. Measurement setup A ........................................................................................ 55

Figure 3.2.2.Train-induced mean velocity components inside building ................................. 56

                                                             7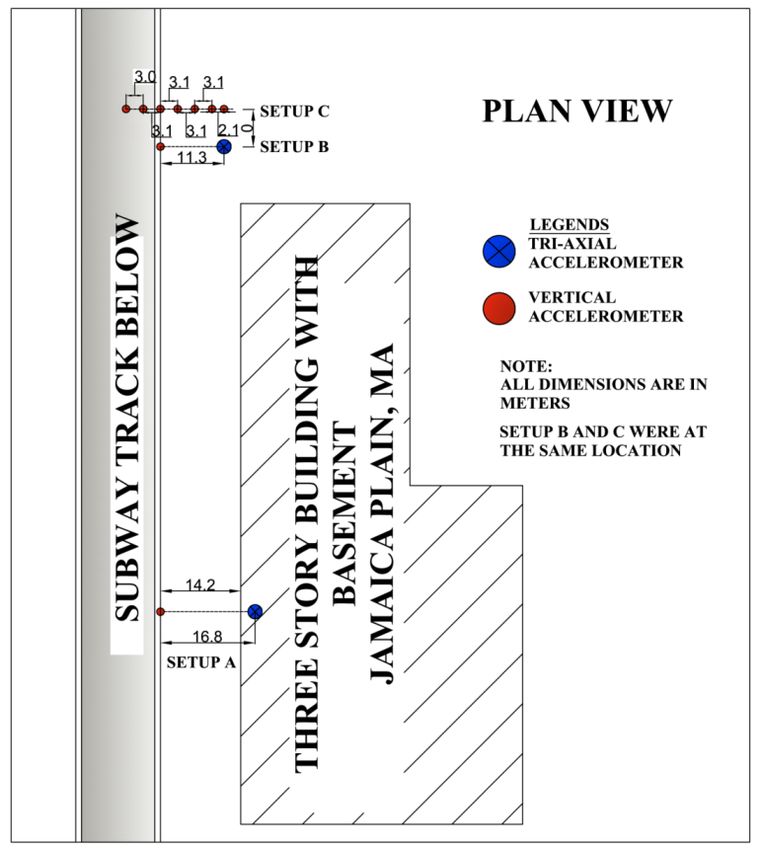
Figure 3.2.3.Train-induced mean velocity components inside building near column ............ 56

Figure 4.1.1. Mean and absolute vertical velocity levels, Cambridge .................................... 57

Figure 4.1.2. Measurement setup A, B, and C ........................................................................ 58

Figure 4.1.3. Subway-induced mean velocity components inside building ........................... 59

Figure 4.1.4. Subway-induced mean velocity components in open field ............................... 60

Figure 4.1.5. Subway-induced mean vertical velocity ............................................................ 61

Figure 4.1.6. Subway-induced mean longitudinal velocity .................................................... 61

Figure 4.1.7. Subway-induced mean transverse velocity ....................................................... 62

Figure 4.1.8. Subway-induced mean vertical velocity ............................................................ 62

Figure 4.2.1. Measurement setup A, B, C, and D ................................................................... 64

Figure 4.2.2. Subway-induced mean velocity inside building ................................................ 65

Figure 4.2.3. Subway-induced mean velocity in open field ................................................... 66

Figure 4.2.4. Subway-induced open field mean velocity near subway track ......................... 66

Figure 4.2.5. Subway-induced mean vertical velocity ............................................................ 67

Figure 4.2.6. Subway-induced mean vertical velocity near the subway line .......................... 68

Figure 4.2.7. Subway-induced mean longitudinal velocity .................................................... 69

Figure 4.2.8. Subway-induced mean transverse velocity ....................................................... 69

Figure 6.1.1. RION DA20 data recorder................................................................................. 71

Figure 6.1.2. RION DA20 screen output ................................................................................ 72

                                                           8
LIST OF TABLES
Table 2.2.1. Site details ........................................................................................................... 17
Table 7.1.1. Setup A: Accelerometers information, Medford ................................................ 78
Table 7.1.2. Setup A: Train data, Medford ............................................................................. 78
Table 7.1.3. Setup B: Accelerometers information, Medford................................................. 79
Table 7.1.4. Setup B: Train data, Medford ............................................................................. 79
Table 7.1.5. Setup C: Accelerometers information, Medford................................................. 79
Table 7.1.6. Setup C: Train data, Medford ............................................................................. 80
Table 7.2.1. Setup A: Accelerometer information, Somerville .............................................. 80
Table 7.2.2. Setup A: Train data, Somerville ......................................................................... 80
Table 7.2.3. Setup B: Accelerometer information, Somerville............................................... 81
Table 7.2.4. Setup B: Train data, Somerville .......................................................................... 81
Table 7.2.5. Setup C: Accelerometers information, Somerville ............................................. 81
Table 7.2.6. Setup C: Train data, Somerville .......................................................................... 82
Table 7.3.1. Setup A: Accelerometers information, MIT-Cambridge .................................... 82
Table 7.3.2. Setup A: Train data, MIT-Cambridge................................................................. 82
Table 7.4.1. Setup A: Accelerometers information, Boston ................................................... 83
Table 7.4.2. Setup B: Accelerometers information, Boston ................................................... 83
Table 7.4.3. Setup C: Accelerometers information, Boston ................................................... 83
Table 7.4.4. Setup C: Train data, Boston ................................................................................ 84
Table 7.5.1. Setup A: Accelerometers information, Cambridge............................................. 85
Table 7.5.2. Setup B: Accelerometers information, Cambridge ............................................. 85
9Table 7.5.3. Setup C: Accelerometers information, Cambridge ............................................. 86
Table 7.5.4. Setup D: Accelerometers information, Cambridge............................................. 86
Table 7.6.1. Setup A: Accelerometers information, Jamaica Plain ........................................ 87
Table 7.6.2. Setup B: Accelerometers information, Jamaica Plain ........................................ 87
Table 7.6.3. Setup C: Accelerometers information, Jamaica Plain ........................................ 87
10CHAPTER 1 INTRODUCTION
Urbanization in cities has compelled building developers to inhabit real estate available near
subway and railway lines. Subway and train-induced building vibrations are a consequence of
closeness of buildings to subway and railway tracks. Research laboratories and precision
manufacturing facilities quite often accommodate highly vibration-sensitive equipment.
Proximity to subways and railways affect proper operation of equipment due to building floor
vibration. In the field of Nano-technology where precision manufacturing becomes extremely
important, these vibrations have become a serious issue. Human comfort in residential and office
buildings is also affected.
Many researchers have developed possible techniques to mitigate floor vibrations to the level
at which proper functioning of vibration sensitive equipment and manufacturing at Nano-scale, is
not hampered. Additionally, vibration mitigation systems are also required for residential and
office buildings near subways and railways. The base isolation technique adopted at the structure
is popular in reducing the vibration level. Incorporation of this technique is expensive and there
is a need for a cost effective technique to mitigate vibrations in buildings. Sanayei et al. (2012)
proposed an approach to mitigate subway-induced vibrations in building by increasing the
thickness of a lower floor termed, “blocking floor”. In order to validate this approach, a four-
story scale model building had been subjected to shaker-induced vertical vibrations at the base of
center column. An impedance model for the prediction of vibration had also been developed and
validated by comparing predicted velocity levels to measured velocities at each floor level.
Predicted velocity levels for models using a “blocking floor” at the first floor indicated reduction
11in the vibration at the higher floor levels. However, this prediction model had assumed that
subway-induced vibrations have a stronger vertical vibration component than horizontal
components. It also assumed that contribution of significant vibration level which is associated
with subway-induced vibration is within the frequency range of 500Hz.
In this research, vibrations data from full-scale buildings subjected to train and floor
vibration in the foundation slab and in the adjacent open field have been measured. Three sites
have been selected for train-induced vibration measurements and another three have been
selected for subway-induced vibration study. Measurements from all six sites have been
considered for validation of the above assumptions. Other findings from the study have also been
discussed.
The main contribution of this thesis has been presented in Chapter 2, which will be submitted
as a journal paper. Chapter 3 presents additional data from train-induced vibration measurement
sites and Chapter 4 presents the results of additional information from subway-induced vibration
measurement sites. Chapter 5 concludes learning and findings from this research. Detailed
information about the data acquisition (DAQ) system and data processing have been presented in
Chapter 6. Additional details about the subway and train vibration measurement setups have
been detailed in Chapter 7.
12CHAPTER 2 SUBWAY AND TRAIN-INDUCED BUILDING AND
GROUND VIBRATION IN BOSTON AREA
The introduction of cutting edge technologies in laboratories and precision manufacturing
facilities quite often includes the operation of vibration sensitive equipment. When these
buildings are located near a railway track, the buildings are prone to subway and train-induced
floor vibration. Human comfort in the residential and office buildings near subway and railway
lines is also an issue of prime concern. It is thus imperative to mitigate these vibrations to the
acceptable levels with the design of an efficient vibration mitigation system for buildings. The
incorporation of a vibration mitigation system in a building in design phase requires
understanding and characterization of subway and train-induced vibration before and after
construction of a structure to meet serviceability criteria.
In this research, an exploration of vibration levels is performed on six sites in the Boston
area. Three sites are selected for measuring train-induced vibration and another three are
considered for subway-induced vibration study. Vibration measurements are performed on the
building grade slab as well as in open field adjacent to the building. Findings from the
comparison of the vibration characteristics are also concluded, revealing important information
for the design of vibration mitigation systems for new buildings.
2.1 Introduction
Technologically advanced precision manufacturing facilities and medical laboratories require
the uses of precision devices and equipment. Urbanization has often pushed construction of such
facilities in the vicinity of railway lines. Operation of vibration sensitive equipment in such
13buildings is interfered with due to subway and train-induced floor vibration. Human comfort is
also compromised in residential and office buildings. It is thus imperative to better understand,
quantify, and mitigate these vibrations to the level at which operations inside the building is not
affected.
Base isolation techniques are most widely adopted vibration mitigation systems in buildings
but have proved to be an expensive approach. Sanayei et al. (2012) developed a building
vibration prediction tool based on the impedance model and proposed a mitigation technique
based on “blocking floor theory”. Validation of the blocking floor theory was done through a
four-story scale model building. However, the validation of the model was based on the
assumption that the foundation of building columns subjected to subway-induced vibration has a
vertical vibration component stronger than horizontal components with main transmission mode
by axial waves through columns. It was also assumed that subway and train-induced vibrations
are significant in the frequency range of 10-500 Hz. In order to validate this prediction and
mitigation technique on full-scale building in design phase, there is a need to study the
characteristics of subway and train-induced building floor vibration at grade slab as input to the
building. This research is focused on understanding and quantification of subway and train-
induced vibrations.
Background. Train or subway-induced vibrations emanating from tunnels and at-grade
railway act as a transient line source. Hassan (2006) reported two patterns of propagation
depending on the location of railways: (1) propagation of vibration due to surface railways, and
(2) propagation as due to subways. The movement of train induces vibrations which were carried
mainly in the form of a) compression waves with particle motion in the direction of propagation,
14b) shear waves, with particle motion in a plane normal to the direction of propagation, c) Surface
waves, with the particle motion elliptical in the plane vertical to the direction of propagation.
Adam and Estroff (2005) stated that most of the vibration energy generated due to a surface
train passage is carried by Rayleigh waves that propagate close to the soil surface and transmit
the vibrations to the structures via their foundations. Yang and Hung (2008) reported that in the
case of subways, when the subway passes through a tunnel, vibrations of the tunnel structure are
produced due to a number of factors along the paths of wave propagation, including the load
generation mechanism of the train-track system, the geometry and location of the tunnel
structure, and the irregularity of soil layers. Hassan (2006) stated that vibrations propagate
through the ground and set the load bearing elements of the building into motion. These motions
spread through the building to upper structural elements producing vibrations.
Eitzenberger (2008) stated that the amount of vibrations transmitted into the building
depends on coupling between the ground and the foundation. Usually a reduction in the vibration
level occurs due to impedance mismatch when waves from soil impinge on the structure
foundation. This results in a reflection of a portion of energy at the interface and the loss in the
vibration level is termed as a coupling loss between soil and foundation. Remington et al. (1987)
reported that Grade slabs are in contact with the underlying soil and will be subjected to similar
vibrations as the ground, and the coupling loss is therefore determined to be 0 dB for frequencies
lower than the resonance frequency of the slab. Kurzweil (1979) determined that the coupling
loss for lightweight buildings is also 0. He also determined that for a building supported directly
on rock the coupling loss is 0. Remington, 1987 and Kurzweil, 1979) reported that for the other
foundations types, the coupling loss varies between 2 and 15 dB depending on frequency and
15foundation type. This explains the reason for lower vibration levels inside some buildings than in
open fields.
The discussion about significant component of subway and train-induced vibration has
been an important consideration in the design of building vibration mitigation system. Rainer et
al. (1988) investigated six one-story wooden houses in Kamloops, British Columbia, Canada and
reported that both horizontal as well as vertical components of train-induced vibration can be
significant. Chen et al. (2009) studied the characteristics of train-induced vibration acceleration
responses in the seasonally frozen region of Daqing, China to reveal that vertical vibrations were
prominent. Wei et al. (2011) measured subway-induced vibration in tunnels and a six-story
masonry building in Shanghai to conclude that subway-induced vibrations should primarily
focus on the vertical vibration control.
The objective of this research is to investigate which component of subway and train-
induced vibration is greatest inside the building on the grade slab as well as in open area adjacent
to the building. The vibration levels of inside these buildings on the grade slab are compared
with the adjacent open field vibration levels. The range of frequency for significant vibration
level is also explored through a set of experimental measurements made near MBTA commuter
rail and subway line around Boston area, MA. Lessons learned from the train-induced and
subway-induced vibration measurements are presented.
2.2 Vibration measurement sites in the Boston area
Six sites in for vibration measurements are identified around the Boston area. Site
classification is done depending on the location of railways i.e. (1) train-induced vibration, and
(2) subway-induced vibration. Selected sites for the train-induced vibration include building in
16Medford, Somerville and MIT-Cambridge. Sites for subway-induced building vibration include
buildings in Cambridge, Boston and Jamaica Plain. General information about each building site
is summarized in the Table 2.2.1.
Table 2.2.1. Site details
MIT- Jamaica
Site Medford Somerville Cambridge Boston
Cambridge Plain
Source Train Train Train Subway Subway Subway
Activities Research Residential Research Research Hospital Teaching
Floors B+4 B+6 8 8 8 B+3
Conc./
Const. Conc./steel Masonry Conc./ steel Conc. Conc.
steel
Surficial Glacial Glacial- Artificial Glacial- Glacial-
Artificial fill
Geology fluvial fluvial fill fluvial fluvial
Conc.: Concrete; B: Basement
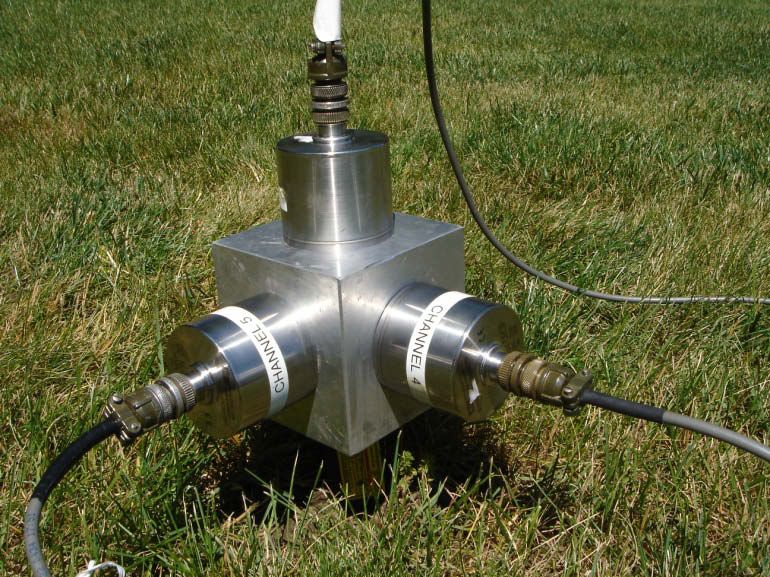
2.3 Site instrumentation and vibration measurements
The direction parallel to the track is labeled as longitudinal and that perpendicular to the
track is transverse. Figure 2.3.1 shows the instrumentation of a tri-axial accelerometer setup on
asphalt. Measurements are made at a sampling rate of 2,560 Hz. Figure 2.3.2 presents a sample
train-induced vertical vibration measurement at 6.9 m from the centerline of the track in
Medford. A typical train consisted of 5 to 6 cars and speed varied from 65 km/h to 96 km/h for
trains. Figure 2.3.3 presents a sample subway-induced vertical vibration measurement on the
ground surface above the tunnel in Cambridge. The measurements are presented as acceleration
(g) vs. time (seconds).
17Figure 2.3.1. Tri-axial accelerometer setup
Figure 2.3.2. Train-induced vertical acceleration in Medford
18Figure 2.3.3. Subway-induced vertical acceleration in Boston
Subway and train-induced vibrations are transient events. For detailed analysis, FTA (2006)
recommends expressing these vibrations in terms of one-third octave band velocity spectra
described in the terms of maximum root mean square (RMS) vibration velocity level with one-
second averaging time. This type of vibration analysis is termed as “Peak hold FFT spectrum”.
Peak hold FFT spectrums are generated by: (1) vibration data is divided into segments of 1
second time intervals, (2) each time domain segment is converted into RMS vibration level in
frequency domain, and (3) maximum magnitude associated with each frequency among all these
segments is stored.
The conversion of acceleration A to velocity V and further to velocity level in dB scale
VdB is done using (1) and (2) (FTA, 2006).
A
V (1)
i 2 f
19 V
VdB 20 log10 (2)
V
ref
where f is frequency, Vref is 10 6 in s as reference velocity, and V is the velocity in in/s. As
a reference, dB increases of 20, 10, 1, -1, -10, and -20 correspond to a multiplication by 10, 3.16,
1.12, 0.89, 0.32, and 0.10 on the linear scale, respectively.
Adjustments for the train speed in dB is incorporated using Equation (3) (FTA, 2006).
speed
adjustment dB 20 log10
speed (3)
ref
FTA (2006) illustrates some of the common vibration sources along with human and
structural response to the ground-borne vibration. The range of interest is approximately from 50
VdB to 100 VdB. It specifies 65 VdB as the threshold for the most of vibration sensitive
equipment and human perception of vibration. In the case of extremely sensitive equipment for
lithography in printed circuits and inspection activities 54 VdB is considered appropriate and for
the operation of electron microscopes, 48 VdB is considered. But in the most demanding
criterion for the extremely vibration sensitive equipment, 42 VdB is considered.
2.4 Train-induced vibration measurement
Figure 2.4.1, Figure 2.4.2 and Figure 2.4.3 show buildings identified for the train-induced
vibration measurements in Medford, Somerville and MIT-Cambridge.
Figure 2.4.4 shows different setups of measurements at Medford site. Measurements at train-
induced measurement sites are categorized in three setups A, B and C.
20In these vibration measurements, setup A is used for comparison of vertical vibrations in
open field near tracks with tri-axial measurements inside of the building at the lowest level on
the grade slab. Setup B is used for comparison of vertical vibrations in open field near tracks
with tri-axial measurements in open filed. Setup C is used for comparison of vertical vibrations
in open field near tracks with and array of vertical measurements in open field. All of these
accelerometers are aligned perpendicular to the tracks. Table 2.4.1 shows the measurement setup
and distances from the centerline of the tracks.
Figure 2.4.1. Vibration measurement site in Medford, MA
21Figure 2.4.2. Vibration measurement site in Somerville, MA
Figure 2.4.3. Vibration measurement site in MIT-Cambridge, MA
22Figure 2.4.4. Measurement setups A, B, and C in Medford
Table 2.4.1. Setup classifications and details (Train)
Site => Medford Somerville MIT-Cambridge
Location => Dist. (m) Surface Dist. (m) Surface Dist. (m) Surface
Setup Single 6.9 asphalt 7 soil 1.7 asphalt
A Tri-axial 29.4 concrete 14 concrete 13.9 concrete
Setup Single 6.9 asphalt 7 soil NA NA
B Tri-axial 29.4 asphalt 14 soil NA NA
6.9,13,19.1,
Setup Single 7,9,11,13,
25.2,29.4, asphalt soil NA NA
C vertical 15,17,22
30.3
The speed of the trains is monitored using a speed radar gun. In Medford site, speed of
the trains ranged from 65 km/h to 78 km/h and in Somerville, it was as high as 96 km/h.
Adjustment for speed in dB level is made using Equation (2) for the speed of 74 km/h. These
small adjustments ranged from 0.45 to 1.12 dB. Train-induced vibrations are measured from both
23the direction in both of the tracks. Mean of the train-induced vibration events obtained from each
accelerometer is used for the comparison in frequency domain.
2.4.1 Observations from train-induced vibration measurements
Figure 2.4.5 compares the mean velocity components in open field on asphalt in Medford at
29.4 m from the centerline of train track. Ambient velocity components are shown using dash
lines with the same markers. The train-induced vibrations are 10 to 30 VdB greater in magnitude
as compared to the ambient vibrations indicating low noise to signal ratio resulting in robust
measurements in robust measurements. It is observed that all the measured mean velocity
components in the open field on asphalt are comparable in magnitude between 20 to 100 Hz.
Above 100 Hz, vertical velocity component exhibit 10 to 15 VdB greater velocity level as
compared to horizontal velocity components. Horizontal components become greater than
vertical component by 10 to 15 VdB below 20 Hz.
Figure 2.4.5. Train-induced mean velocity components in open field, Medford
24Figure 2.4.6 compares the train-induced velocity components at Medford site shown in the
solid lines at 29.4 m from the centerline of track. It is observed that the vertical component is
greater than the horizontal (longitudinal and transverse) components by around 10 VdB in the
frequency range of 30 Hz to 200 Hz. Transverse and longitudinal velocity components show
comparable magnitude throughout the frequency spectrum.
It is also observed that the difference in vibration level between horizontal and vertical
components vary throughout the spectrum. The components become comparable in magnitude at
higher frequency ranges beyond 200 Hz. Horizontal components (transverse and longitudinal)
are greater than the vertical component below 25 Hz. This can be related to the contribution of
surface waves (Rayleigh waves) to the horizontal components of vibration at low frequencies.
Thus care shall be taken concerning the frequency range of interest, while designing building
vibration mitigation system for any particular component of vibration. The observations from
Somerville and MIT-Cambridge site inside the building are shown in Figure 2.4.7 and Figure
2.4.8. It is observed that the vertical velocity component is 5 to 15 VdB greater as compared to
horizontal velocity components below 300 Hz. Velocity level is observed significant within the
frequency range of 20 Hz to 200 Hz.
25Figure 2.4.6. Train-induced mean velocity components inside building, Medford
Figure 2.4.7. Train-induced mean velocity components inside building, Somerville
26Figure 2.4.8. Train-induced mean velocity components inside building, MIT-Cambridge
Velocities are induced by the mixture of surface and body waves. In the case of train-induced
vibration, surface and body waves were generated at the source. Eitzenberger (2008) stated that
the surface waves contain Rayleigh waves that it does not propagate far deeper into the medium,
since the velocity decreases with increased depth, and at a depth of 1 to 2 wavelengths, velocity
is negligible. The effect of Rayleigh waves is reduced in the building basement vibration
measurement at about 3 m depth as compared to the effect pronounced on the surface. In this
case, P-waves (body waves) contribute to the vertical component in the basement at lower
frequencies.
Most of the vibration sensitive equipment such as lithography and MRI has their sensitivities
defined between 8 to 100 Hz. Logarithmic differences of mean vertical velocity inside the
building and open field is compared in Figure 2.4.9. These vertical velocity levels are at 29.4 m
and 14 m away from the centerline of track in Medford and Somerville site, respectively. It is
observed that the responses in both the sites are similar in magnitude in the frequency range of
2730 to 100 Hz. Both graph lines show negative numbers in the range of 10 to 100 Hz indicating
that the vertical vibration measurements inside the building on the grade slab are smaller than the
open field levels ranging between 0 to -14 dB. Based on the observations from these two sites, it
can be inferred that perhaps train-induced open field ground vibration measurements can
conservatively be used for vibration mitigation system of a new building in the design phase
below 100 Hz. For this purpose, more measurements are recommended at desired new sites.
Figure 2.4.9. Vertical velocity difference: Inside Building - Open Field
In order to understand the behavior of train-induced open field vertical vibration levels,
responses from the accelerometers at the increasing distances from source is compared in Figure
2.4.10. It shows that with the increase in the distance from source of vibration, vibration level
decreases. At higher frequencies, a sudden increase in the velocity level is observed at some
points. This is probably due to the local site response. The peak in velocity level is observed at
50 Hz. In Figure 2.4.11, the peak vertical velocity attenuation with respect to distance is graphed.
It is observed that vertical velocity level reduces by around 25 VdB with the increase in distance
28of 25 m at 50 Hz. Similarly, a 15 VdB reduction over 15 m distance was observed in Somerville
site at 50 Hz which is a frequency associated with peak velocity level. Form these measurements,
it is observed that there is an attenuation of about 1 VdB per meter as distance from railway line.
However, the attenuation is not varying linearly with distance.
Figure 2.4.10. Train-induced mean vertical velocity in open field, Medford
29Figure 2.4.11. Train-induced mean vertical velocity in open field
2.5 Subway-induced vibration measurement
Subway-induced vibration measurements site in Boston, Jamaica Plain and Cambridge are
shown in Figure 2.5.1, Figure 2.5.4 and Figure 2.5.7, respectively. Figure 2.5.2 and Figure 2.5.3
show plan and elevation of different setup of measurements taken at the Boston site. Similarly,
Figure 2.5.5, Figure 2.5.6, and Figure 2.5.8, Figure 2.5.9 show plan and elevation sketches at
Jamaica Plain and Cambridge site, respectively. Measurements have been classified in three
setups A, B, and C.
30Figure 2.5.1. Measurement site in Boston, MA
Figure 2.5.2. Measurement setups in Boston: Plan
31Figure 2.5.3. Measurement setups in Boston: Elevation
Figure 2.5.4. Measurement site in Jamaica Plain, MA
32Figure 2.5.5. Measurement setups in Jamaica Plain: Plan
Figure 2.5.6. Measurement setups in Jamaica Plain: Elevation
33Figure 2.5.7. Measurement site in Cambridge, MA
Figure 2.5.8. Measurement setups in Cambridge: Plan
34Figure 2.5.9. Measurement setups in Cambridge: Elevation
In these vibration measurements, setup A is used for comparison of vertical vibrations in
open field near tracks with tri-axial measurements inside of the building at the lowest level on
the grade slab. Setup B is used for comparison of vertical vibrations in open field near tracks
with tri-axial measurements in open filed. Setup C is used for comparison of vertical vibrations
in open field near tracks with and array of vertical measurements in open field with the exception
at Boston site where setup C is used to measure tri-axial vibration inside MBTA station. All of
these accelerometers are aligned perpendicular to the tracks. Table 2.5.1 shows the measurement
setup and distances from the centerline of the tracks.
35Table 2.5.1. Setup classifications and details (Subway)
Site => Boston Jamaica Plain Cambridge
Location => Dist. (m) Surface Dist. (m) Surface Dist. (m) Surface
Setup Single 0 asphalt 0 soil 0 asphalt
A Tri-axial 12 concrete 16.8 concrete 25 concrete
Setup Single 0 asphalt 0 soil 0 concrete
B Tri-axial 12 asphalt 11.3 soil 25 soil
0,3,6.1,9, 0,7,10,13,
Single
Setup NA NA 12.1,15.2, soil 16,19,22, soil
vertical
C 17.4 25
Tri-axial 7.5 asphalt NA NA NA NA
Vibration measurements for subways on both the tracks are recorded. Speed measurement is
only done inside MBTA station at Boston site but not at other site due to inaccessibility. Thus,
adjustment due to speed in dB is not made in any of the subway sites due to consistency
2.5.1 Observations from subway-induced vibration measurements
Figure 2.5.10 compares subway-induced velocity components inside MBTA station. Ambient
velocity components have also been shown using dashed line with the same markers. Subway-
induced vibrations are 10 to 35 VdB larger in magnitude as compared to the ambient vibrations
indicating low noise to signal ratio resulting in robust measurements. It is important to note that
the vertical component is greater than horizontal components in the frequency range of 10 to 300
Hz.
36Figure 2.5.10. Subway-induced mean vertical velocity inside MBTA station, Boston
Figure 2.5.11 compares the subway-induced velocity in open field on asphalt, 12 m away
from the subway line. It is observed that vertical velocity component is greater than horizontal
components by 5 to 10 VdB within the frequency range of 10 to 300 Hz. Peak level of velocity
level is associated with 40 Hz.
37Figure 2.5.11. Subway-induced mean velocity in open field, Boston
For the Boston site, Figure 2.5.12 compares subway-induced vibration components inside the
building 12 m away from the subway track. It shows that the vertical velocity component is
greater than horizontal components by 10 to 15 VdB in the frequency range of 20 to 200 Hz
inside the building. Transverse and longitudinal components show comparable velocity levels.
For the Jamaica Plain site, Figure 2.5.13 shows the measurements from inside the building 16.8
m away from the subway track. It also shows that the vertical velocity component is greater than
horizontal components by 10 to 15 VdB in the frequency range of 20 to 200 Hz. But in case of
Cambridge site in Figure 2.5.14, transverse velocity component exhibited velocity magnitudes
comparable to vertical component. Both these components are measured 10 to 15 VdB higher
than longitudinal velocity component below 200 Hz.
38Figure 2.5.12. Subway-induced mean velocity inside building, Boston
Figure 2.5.13. Subway-induced mean velocity inside building, Jamaica Plain
39Figure 2.5.14. Subway-induced mean velocity inside building, Cambridge
Figure 2.5.15 compares the logarithmic differences in subway-induced mean vertical
velocities inside building and open field measured at Boston, Jamaica Plain, and Cambridge
sites. In Boston site, vertical velocity level inside the building is measured 10 dB lower than
open field vertical velocity level. Vertical velocities in Jamaica Plain as well as Cambridge show
0 to 15 dB greater velocity level inside the building compared to open field velocity
measurements.
It is evident from the observations made in these subway-induced vibration measurement
sites that velocity level after the construction of building can be greater that the measured before
the existence of building at site on ground surface. Open field vibration measurement may not
necessarily always be greater than the vibration level after the construction of building. Thus
care shall be taken while designing vibration mitigation system for buildings to be constructed at
site subjected to subway-induced vibration.
40Figure 2.5.15. Vertical velocity difference: inside building - open filed
Figure 2.5.16 shows variation of subway-induced vertical vibration with respect to distance
at Cambridge site. It can be observed that the peak of vibration is associated with 63 Hz. In
Figure 2.5.17, the peak vertical velocity attenuation with respect to distance is graphed. The
Cambridge site a drop of about 25 VdB is observed at 63 Hz as the distance from subway line
increases from 0 to 25 m. Similarly, in Jamaica Plain site, a decrease of about 18 VdB is
observed with the increase in distance of 17.4 m at 50 Hz associated with level of peak velocity
level. From these measurements, it is observed that there is an attenuation of about 1 VdB per
meter as distance from subway line. However, the attenuation is not varying linearly with
distance.
41Figure 2.5.16. Subway-induced vertical vibration in open field, Cambridge
Figure 2.5.17. Subway-induced vertical Velocity in open field
422.6 Conclusions
Subway and train-induced vibrations were successfully measured inside building on grade slab
and in the adjacent open field in different setups. Frequency range and magnitude of vibrations at
which operation of sensitive equipment is hampered should be the prime concern for vibration
mitigation system. Following conclusion can be drawn from the observations made from the
measurements.
Common to both subway and train-induced vibrations:
o For all six sites, the measured vertical velocity was higher than horizontal components
inside the building on grade slabs. On the buildings grade slabs, the maximum vertical
velocities ranged from 63 to 70 VdB and the horizontal velocities from 51 to 57 VdB.
Thus vertical components which are greater need to be considered while design of
vibration mitigation system for a building.
o Frequency range of significant velocity level on ground surface was contained was 10 to
250 Hz.
o Velocity level on ground surface at the frequency associated with peak velocity level
decreased by approximately 1 VdB per meter with the increase in distance perpendicular
from subway and railway tracks.
Specific to train-induced vibrations:
o The largest magnitude of vibration switched between the vertical and horizontal
components in various frequency ranges. Therefore, the mitigation system shall be
designed to mitigate the largest component of vibration which can be horizontal at lower
43frequencies and vertical at higher frequencies. Thus care shall be taken while designing
building vibration mitigation system of the building.
o Below 100 Hz, train-induced vibration sites showed greater vertical vibration in open
field than inside the building. Based on these two sites, open field vertical vibration
measurements can be used for the design of vibration mitigation system of buildings.
Specific to subway-induced vibrations:
o Vertical velocity components measured inside the building exhibited lower velocity
levels in Boston site but it was measured greater at Cambridge and Jamaica Plain site.
Open field vibration thus may not necessarily always be greater than vibration inside the
building. Thus care shall be taken in design of building vibration mitigation system for
sites subjected to subway-induced vibrations in concern with the depth of tunnel with
respect to the foundation of the building.
In the future, full-scale testing of buildings subjected to train and subway-induced vibrations
will be used for validation of impedance modeling of structures and “blocking floor theory”.
2.7 Acknowledgements
Authors would like to thank Dr. Laurie G. Baise and Dr. Eric Thompson at Tufts University
for reviewing this paper. This research would not have been successful without the coordination
and permission from Gladys Unger from Acentech Inc., Dr. Gary Leisk at Tufts University,
Gerry Desmond at MIT-Cambridge, Ted O’Leary at Alexandria properties, Edward Pitts at Tufts
Medical Center, Michele D. Taylor at Pearl Street Park, Dr. Sito Narcesse at English High
School, and Claudia Smith-Reid, Sorrenia Dillon from MBTA. Sincere thanks to graduate
44students K.P.Anish, Merve Iplickcioglu, and Sagar D. Shetty at Tufts University for their
significant contribution and help throughout the experimental process.
45CHAPTER 3 ADDITIONAL TRAIN-INDUCED VIBRATION
MEASUREMENT INFORMATION
3.1 Vibration measurement site in Somerville, MA
Vibration measurements at all sites are made using Wilcoxon seismic 731A accelerometers
and Data Acquisition system (RION DA20 data recorder). Speed monitoring of the trains is done
using Bushnell Speedster III speed radar gun. At each site 3 to 8 train events are measured in
each setup. Mean value of all train events is considered in representing data along each velocity
component. Figure 3.1.1 shows a sample mean vertical velocity plotline passing through the
mean values of absolute values of train events.
Figure 3.1.1. Mean and absolute vertical velocity levels, Medford
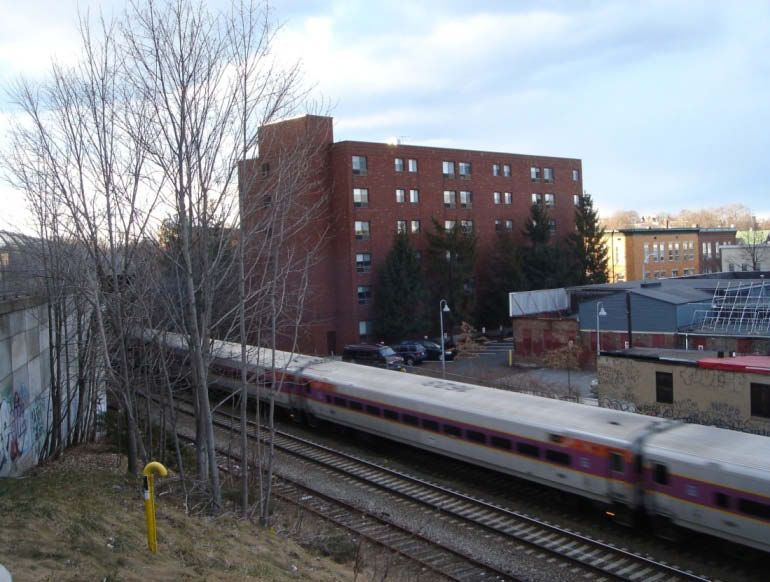
46Measurement site at Somerville is a residential apartment for elderly or disabled individuals.
It is a six story building with basement. Figure 2.4.2 presents a view of commuter train passing
near the site. Vibration measurement inside the building is taken on grade slab in the basement.
Figure 3.1.2 presents a plan view of measurement setups performed at the site. Setup A has a
tri-axial accelerometer placed in the building basement 14m away from the centerline of tracks
and a single vertical accelerometer outside the building 7m away from the centerline of tracks.
Grade slab in the building basement is 3m below the open filed ground surface. Both the
accelerometers are aligned in a straight line perpendicular to the tracks. Setup B has tri-axial as
well as single vertical accelerometer aligned in a straight line perpendicular to the track at the
same distance as in setup A but it is in the open field adjacent to the building. Setup C has an
array of seven single vertical accelerometers aligned in a direction perpendicular to the track.
These are placed at 7m, 9m, 11m, 13m, 15m, 17m and 22m from the centerline of tracks. Setup
A and B is performed at the same time and measured six trains. Setup C is performed at the same
location of setup B at different time and measured vibrations due to six trains. Trains events are
measured from both the directions and on both of the tracks.
47Figure 3.1.2. Measurement setup A, B, and C
Figure 3.1.3 shows the tri-axial accelerometer setup with aluminum block mounted over iron-
wedge in open field. The aluminum block with accelerometers on the iron wedge behaves like a
single degree of freedom structure on being subjected to train-induced vibrations. And due to
low contact stiffness of wedge with the soil, horizontal measurements are affected by resonance
of this setup in the lower frequency range. This phenomenon contaminates data obtained from
horizontal accelerometers. However, data from vertical accelerometer in this setup is not
affected. Locations where tri-axial accelerometer is setup either on asphalt or concrete,
measurements are not contaminated due to a strong contact provided by epoxy between the
aluminum block and asphalt/concrete. The resonance behavior was not observed inside the
building with tri-axial accelerometer setup on the grade slab.
48Figure 3.1.3. Tri-axial accelerometer setup in open field
3.1.2 Observations from Somerville site:
Comparison of mean velocity level components from the tri-axial accelerometer is presented
in Figure 3.1.4. It shows that the mean vertical velocity level is 5 to 15 VdB greater than
horizontal velocity components below 300 Hz. Longitudinal and transverse velocity components
exhibit comparable velocity levels and similar shapes to each other.
49Figure 3.1.4.Train-induced mean velocity components inside building
Figure 3.1.5.Train-induced mean velocity components in open field
Figure 3.1.5 compares velocity components measured in open field adjacent to the building.
It is observed that in the frequency range of 50 to 300 Hz, vertical velocity component is greater
50than the horizontal velocities (longitudinal and transverse) by 10 to 15 VdB. Greater value of
horizontal velocities than vertical velocity below 50 Hz is due to the resonance of horizontal
accelerometers on tri-axial setup over iron-wedge acting as single degree of freedom system.
Thus horizontal velocity levels below 50 Hz cannot be used for comparison purposes. An
alternative technique for horizontal vibration measurements shall be adopted for future
measurements in open field to avoid capturing data contaminated with resonance of the system.
Figure 3.1.6. Train-induced mean vertical velocity
It is observed from Figure 3.1.6 that the vertical velocity component in open area adjacent to
the building is 0 to 10 VdB greater than that observed inside building basement up to the
frequency of 150 Hz. Open field measurement drops sharply beyond 150Hz.
51Figure 3.1.7. Train-induced mean longitudinal velocity
Figure 3.1.8. Train-induced mean transverse velocity
Figure 3.1.7 and Figure 3.1.8 captures resonance in the longitudinal and transverse velocity
components measured in open field adjacent to building. It is thus difficult to comment on these
figures with certainty. It is observed that at the frequency above 100 Hz, horizontal velocities
52measured in open field drops below the measurements inside the building. This observation is
also made in Figure 3.1.6 for vertical velocity component.
Figure 3.1.9. Train-induced open field mean vertical velocity
From Figure 3.1.9 it is observed that in general, peak velocity level decreases with the
increase in distance from the track but at some point this observation differs probably due to
local site response. Peak level of vibration is associated with 50 Hz. It is observed that the
velocity levels at peak level of frequency dropped by 15 VdB over 15m distance. Thus it can be
said that a drop of 1 VdB per meter is approximately observed at the frequency associated with
peak velocity level.
3.2 Vibration measurement site in MIT-Cambridge, MA
Measurement site at MIT-Cambridge is research laboratory with sensitive equipment like
MRI machines. It is an eight story building with a skywalk. Cargo trains, usually three in a day,
passes through the building under the skywalk. Figure 2.4.3 presents a view of train passageway
53across the building. Vibration measurements inside the building are made on the grade slab in the
first floor. The site has only one railway track and trains come from either directions. Three
trains are measured at this site. Speed of only one train in the evening is recorded as the other
two trains were scheduled late night.
Figure 3.2.1 shows plan of measurement setup A performed at the site. Setup A has a tri-
axial accelerometer placed in the building 13.9m away from the centerline of track and a single
vertical accelerometer outside the building 1.7m away from the centerline of track. Both the
accelerometers are aligned in a straight line perpendicular to the track. Transverse direction
accelerometer malfunctioned and readings are not made for transverse direction in setup A.
Another tri-axial accelerometer is also setup near the column inside the building 13.9m away
from the centerline of track. This is set to measure vibration near the column. In this setup,
accelerometer in the longitudinal direction did not work properly and measurements are not
recorded. This site had only 3 trains per day due to which other setups in open field on asphalt
are not performed.
54You can also read