ADVICE ON CHATSWOOD CBD MIXED USE ZONE - FINAL FEBRUARY 2020 Prepared for Willoughby City Council
←
→
Page content transcription
If your browser does not render page correctly, please read the page content below
ADVICE ON CHATSWOOD CBD MIXED USE ZONE

FINAL           Prepared for
FEBRUARY 2020   Willoughby City Council
© SGS Economics and Planning Pty Ltd 2019
This report has been prepared for Willoughby City Council. SGS Economics and
Planning has taken all due care in the preparation of this report. However, SGS and
its associated consultants are not liable to any person or entity for any damage or
loss that has occurred, or may occur, in relation to that person or entity taking or
not taking action in respect of any representation, statement, opinion or advice
referred to herein.
SGS Economics and Planning Pty Ltd
ACN 007 437 729
www.sgsep.com.au
Offices in Canberra, Hobart, Melbourne, Sydney

                                                        190486 Report to client 200220.docx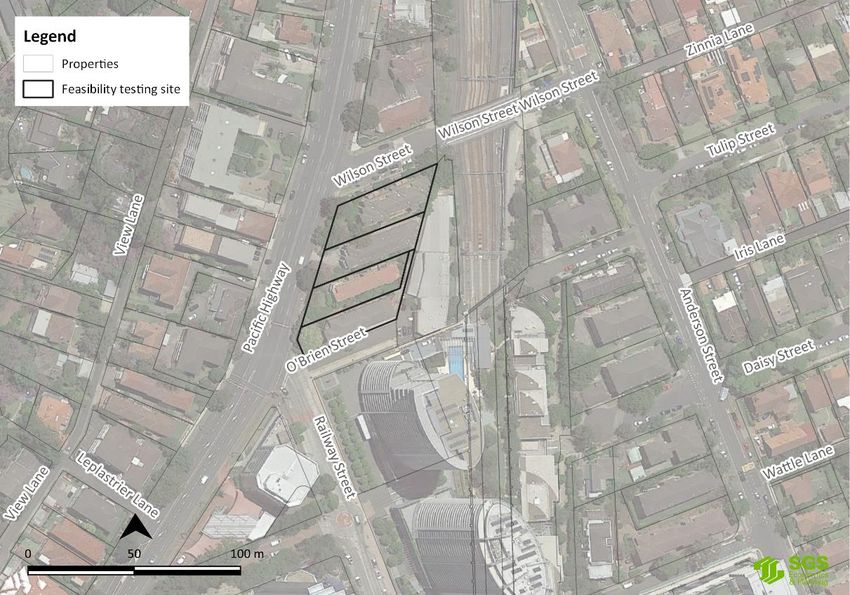
TABLE OF CONTENTS

   1. INTRODUCTION                                                                1

   1.1 Structure of this report                                                   1

   2. CONTEXT                                                                     2

   2.1 Policy context                                                             2
   2.2 Property market profile                                                    3
   2.3 Mixed use case studies                                                     6

   3. FEASIBILITY MODELLING                                                      14

   3.1 Feasibility methodology                                                   14
   3.2 Feasibility results                                                       19

   4. CAPACITY AND DEMAND                                                        22

   4.1 Floorspace demand                                                         22
   4.2 Development capacity                                                      25
   4.3 Gap analysis                                                              29

   5. DISCUSSION                                                                 32

   APPENDIX A: FULL DEVELOPMENT FEASIBILITY RESULTS                              35

   LIST OF FIGURES

   FIGURE 1: PROPOSED LAND USES IN THE EXPANDED CHATSWOOD CBD                     2
   FIGURE 2: THE EXISTING CHATSWOOD CBD INCLUDING THE MIXED USE AND
            COMMERCIAL CORE ZONES                                                 7
   FIGURE 3: THE NORTH SYDNEY CENTRE INCLUDING THE MIXED USE AND COMMERCIAL
            CORE ZONES                                                            8
   FIGURE 4: THE PARRAMATTA CENTRE INCLUDING THE MIXED USE AND COMMERCIAL
            CORE ZONES                                                           10
   FIGURE 5: MIXED USE DEVELOPMENTS WITH RESIDENTIAL AND COMMERCIAL
            COMPONENTS IN PARRAMATTA – (A) 29 CAMPBELL STREET AND (B) 8 COWPER
            STREET                                                               11
   FIGURE 6: THE BURWOOD TOWN CENTRE                                             12
   FIGURE 7: MIXED USE DEVELOPMENTS IN THE BURWOOD TOWN CENTRE                   13
   FIGURE 8: RESIDUAL LAND VALUE APPROACH TO FEASIBILITY ANALYSIS                14
   FIGURE 9: SITE 1 FOR FEASIBILITY TESTING                                      15
   FIGURE 10: SITE 2 FOR FEASIBILITY TESTING                                     16
   FIGURE 11: SITE 3 FOR FEASIBILITY TESTNIG                                     17
   FIGURE 12: SITE 4 FOR FEASIBILITY TESTING                                     18

Advice on Chatswood CBD mixed use zone                                            iii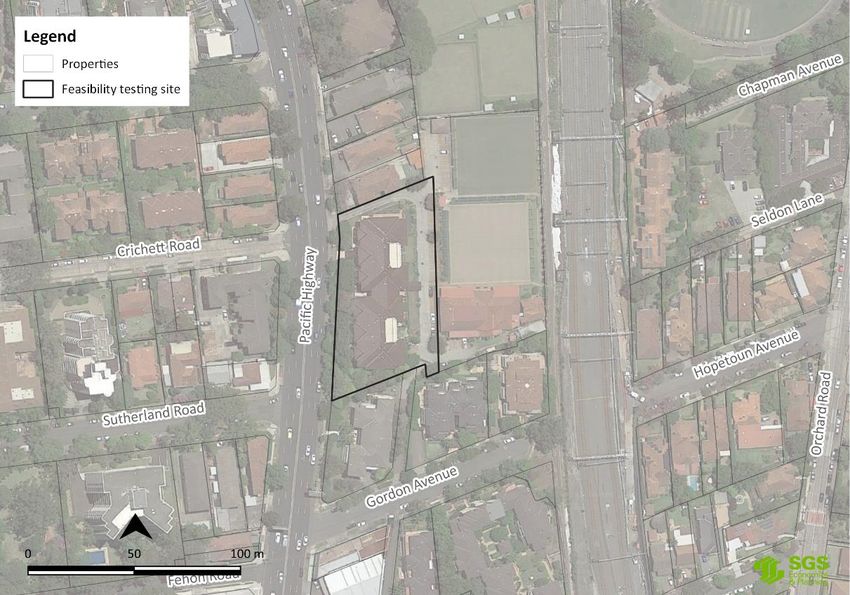
FIGURE 13: FORECAST EMPLOYMENT GROWTH RATES FOR THE CHATSWOOD CBD              23
   FIGURE 14: AVAILABLE LAND UNDER CURRENT PLANNING CONTROLS                      27
   FIGURE 15: AVAILABLE LAND UNDER PROPOSED PLANNING CONTROLS (HIGH
            DEVELOPMENT SCENARIO)                                                 28
   FIGURE 16: AVAILABLE LAND UNDER PROPOSED PLANNING CONTROLS (LOW
            DEVELOPMENT SCENARIO)                                                 29

   LIST OF TABLES

   TABLE 1: NORTH SHORE OFFICE MARKET INDICATORS AS AT JULY 2019                   4
   TABLE 2: COST INPUTS AND ASSUMPTIONS                                           18
   TABLE 3: FEASIBILITY RESULTS (RLV RATIO)                                       20
   TABLE 4: FEASIBILITY RESULTS (RLV RATIO) WITH A 25% REDUCTION IN COMMERCIAL AND
             RETAIL REVENUES                                                       21
   TABLE 5: FLOORSPACE BY BROAD LAND USE CATEGORY AND INDUSTRY IN THE
             CHATSWOOD CBD 2016 (SQM)                                              23
   TABLE 6: FORECAST ADDITIONAL FLOORSPACE DEMAND BY BROAD LAND USE CATEGORY
             IN THE CHATSWOOD CBD, 2016-2056                                 24
   TABLE 7: FORECAST ADDITIONAL FLOORSPACE DEMAND BY INDUSTRY IN THE
             CHATSWOOD CBD, 2016-2056                                             24
   TABLE 8: COMMERCIAL DEVELOPMENT CAPACITY (SQM) IN THE CHATSWOOD CBD            27
   TABLE 9: COMPARISON OF FLOORSPACE CAPACITY AND DEMAND                          30
   TABLE 10: FULL FEASIBILITY RESULTS FOR SITE 1                                  35
   TABLE 11: FULL FEASIBILITY RESULTS FOR SITE 2                                  35
   TABLE 12: FULL FEASIBILITY RESULTS FOR SITE 3                                  36
   TABLE 13: FULL FEASIBILITY RESULTS FOR SITE 4                                  36

Advice on Chatswood CBD mixed use zone                                             iv
1. INTRODUCTION

   Willoughby City Council (Council) are seeking to position the Chatswood CBD for employment
   and residential growth over the next 20 years, capitalising on the location and accessibility of
   the centre. To do this, Council has prepared and approved a Chatswood CBD Planning and
   Urban Design Strategy to 2036 that responds to changing market dynamics, including major
   residential development in commercial centres and the impact of commercial centres such as
   Macquarie Park and Sydney Olympic Park. The Strategy proposes the extension of the
   Chatswood CBD to the north and south along the North Shore railway line, as well as to
   change the allowable floor space and height controls applying to the B4 Mixed Use Zone.
   As part of the proposed changes to principal planning controls, a minimum 1:1 non-
   residential component would be required as part of any development in the B4 Mixed Use
   zone in Chatswood, including within the extensions of the CBD. Department of Planning,
   Industry and Environment (DPIE) have requested additional information regarding the
   feasibility of including extensive B4 Mixed Use areas with a minimum stipulated 1:1 FSR in an
   extension to the CBD.
   SGS Economics and Planning has been commissioned by Council to analyse the prospects of
   mixed use development in the B4 zone with a non-residential component in response to
   queries by the NSW Department of Planning, Industry and Environment. The scope of this
   study includes to:
   ▪     Deliver a report analysing the feasibility of a 1:1 FSR non-residential component for
         proposed B4 mixed use extensions, in the context of CBD strategy intention to extend the
         non-residential and commercial floorspace opportunities,
   ▪     Factor in the likely success of the commercial component throughout the extended CBD
         by reviewing the current and expected future commercial market conditions that are
         impacting Chatswood CBD,
   ▪     Assess whether the 1:1 FSR minimum control would have an adverse impact on the
         viability of the B3 commercial core to 2036, and
   ▪     Make recommendations and any suggested modifications to the proposed controls.

   1.1       Structure of this report
   This report contains the following sections:
   Chapter 2 contains an analysis of the property market in Chatswood and the policy context
   and assesses what kinds of businesses would be likely to move into small offices built as part
   of mixed use developments.
   Chapter 3 models the feasibility of mixed use development in the proposed extensions to the
   Chatswood CBD with varying amounts of commercial development.
   Chapter 4 estimates the floorspace capacity and likely future floorspace demand in the
   Chatswood CBD.
   Chapter 5 brings together conclusions from each of the previous chapters to comment on the
   suitability of a non-residential floorspace requirement in the proposed mixed use extensions
   of the Chatswood CBD.

Advice on Chatswood CBD mixed use zone                                                              1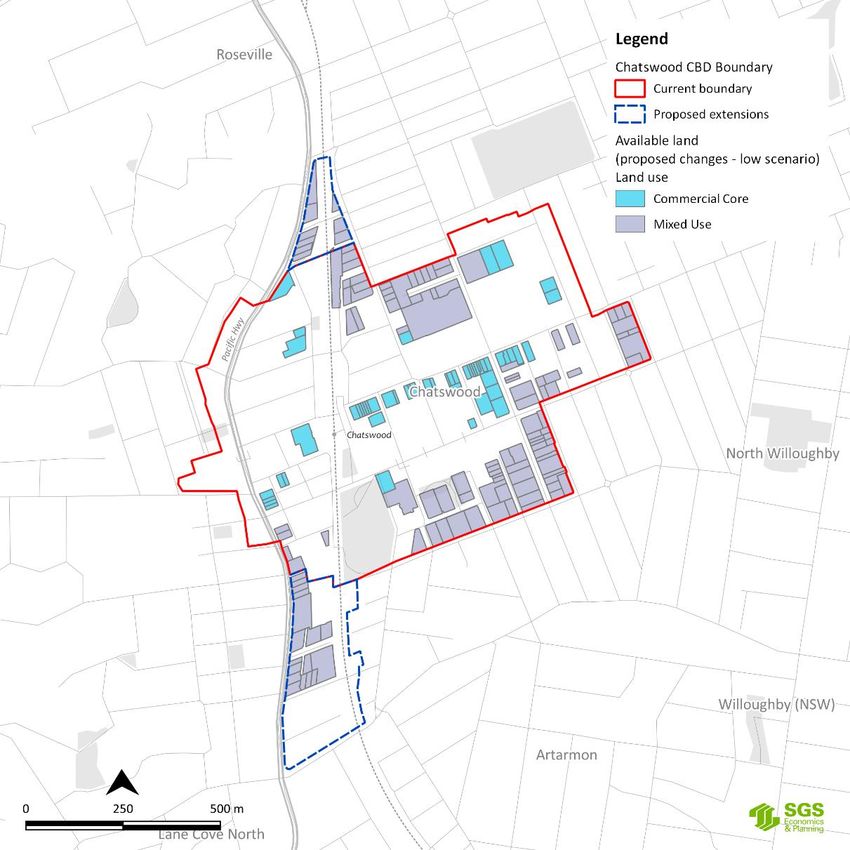
2. CONTEXT

   2.1       Policy context
   Chatswood CBD Planning and Urban Design Strategy
   The Chatswood CBD Planning and Urban Design Strategy aims to establish a strong
   framework to guide future development in the Chatswood CBD over the next 20 years. Its
   directions seek to facilitate office and residential growth as well as high quality urban design.
   Proposed changes to the planning framework for the Chatswood CBD under the Strategy
   include:
   ▪     An extension of the CBD to the north and south along the Pacific Highway and North
         Shore Railway Line, with the extension areas to be zoned B4,
   ▪     Rezoning portions of the land in the CBD boundaries zoned R2, R3 and R4 to B4,
   ▪     Removing the maximum FSR for commercial developments in the commercial core, with
         maximum height limits to apply,
   ▪     Increasing the maximum FSR in the B4 zone to generally 6:1 subject to other
         considerations, and
   ▪     Require a 1:1 non-residential component in large mixed use developments.

   FIGURE 1: PROPOSED LAND USES IN THE EXPANDED CHATSWOOD CBD

   Source: Architectus 2018, Chatswood CBD Planning and Urban Design Strategy

Advice on Chatswood CBD mixed use zone                                                                 2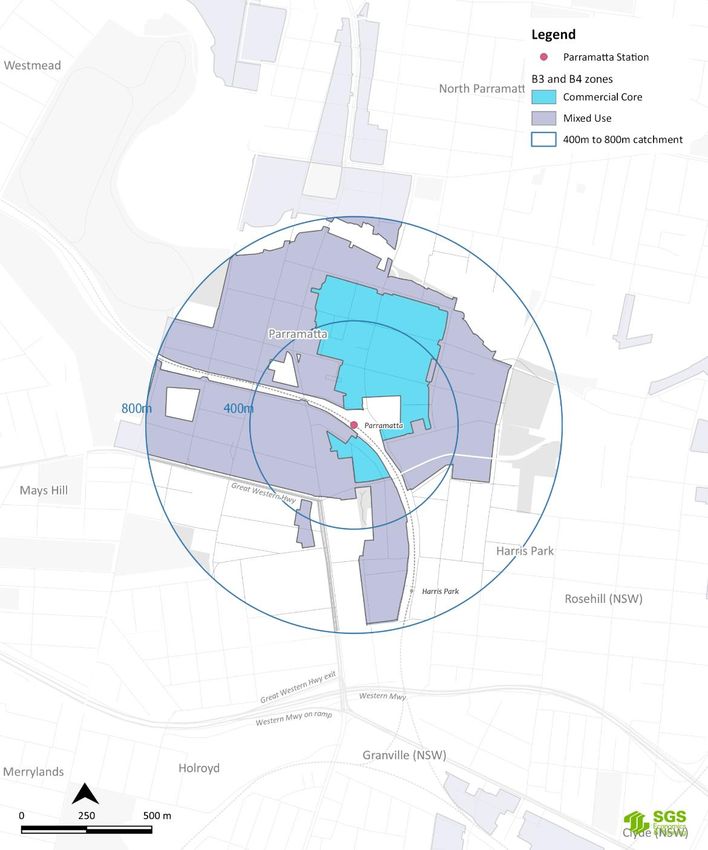
NSW Government strategic land use plans
   The high-level strategic planning context for the Chatswood CBD is provided by the NSW
   Government’s Greater Sydney Region Plan (GSRP) and North District Plan (NDP). The GSRP
   provides a 40-year vision for the development of Greater Sydney, which is aligned with long-
   term transport and infrastructure plans, while the NDP provides a bridge between the GSRP
   and local planning conducted by Councils. The NDP contains a series of planning priorities and
   actions which amendments to planning controls must be consistent with.
   Chatswood is identified as one of the major centres and office markets in the Eastern
   Economic Corridor, which stretches from Sydney Airport to Macquarie Park and includes the
   Sydney CBD. The NDP discusses the importance of this corridor to Greater Sydney’s global
   competitiveness and aims to continue to grow its economy.
   Chatswood is designated in the GSRP and NDP as a strategic centre. Under this designation,
   Chatswood is intended to continue to serve as a higher order employment and services
   centre and to host significant private sector investment and development. The strength of
   Chatswood’s retail and entertainment offering is also identified. A job target of between
   31,000-33,000 is identified for Chatswood by 2036, an increase from the 2016 baseline of
   24,700.
   The NDP contains several actions to facilitate continued employment growth in Chatswood
   including:
   ▪     Protect and grow the commercial core,
   ▪     Maximise the land use opportunities provided by Sydney Metro,
   ▪     Promote the role of the centre as a destination for cultural and leisure activities,
   ▪     Promote and encourage connectivity, and upgrade and increase public open spaces,
   ▪     Investigate interchange operations on both sides of the railway line to increase capacity
         and efficiency of modal changes, and
   ▪     Improve pedestrian connectivity between the eastern and western side of the rail line.

   Transport improvements
   Proposed NSW Government transport infrastructure and service investment would improve
   the public transport and road accessibility of Chatswood, increasing its commercial appeal.
   These investments include:
   ▪     The Northern Beaches Link, which would make Chatswood the large commercial office
         market most accessible to large parts of the Northern Beaches,
   ▪     The Sydney Metro City and South-West, which would directly connect Chatswood with
         the inner south and south-west of Sydney and improve travel times to the Sydney CBD,
         and
   ▪     The Western Harbour Tunnel and Beaches Link, which would provide a motorway
         connection between WestConnex and the Warringah Freeway, increasing the road
         accessibility of Chatswood to the southern and western suburbs of Sydney.

   2.2       Property market profile
   The performance of the commercial office market in Chatswood compared to other nearby
   centres was profiled based on the following published commercial office market research:
   ▪     Metro Office Second Half 2019, Colliers International,
   ▪     North Short Office Market Overview September 2019, Knight Frank, and
   ▪     Sydney’s North Shore Office Market Update March 2019, CI Australia.
   Indicators of the performance of commercial office markets in the North Shore region
   including the Chatswood CBD are shown in Table 1.

Advice on Chatswood CBD mixed use zone                                                               3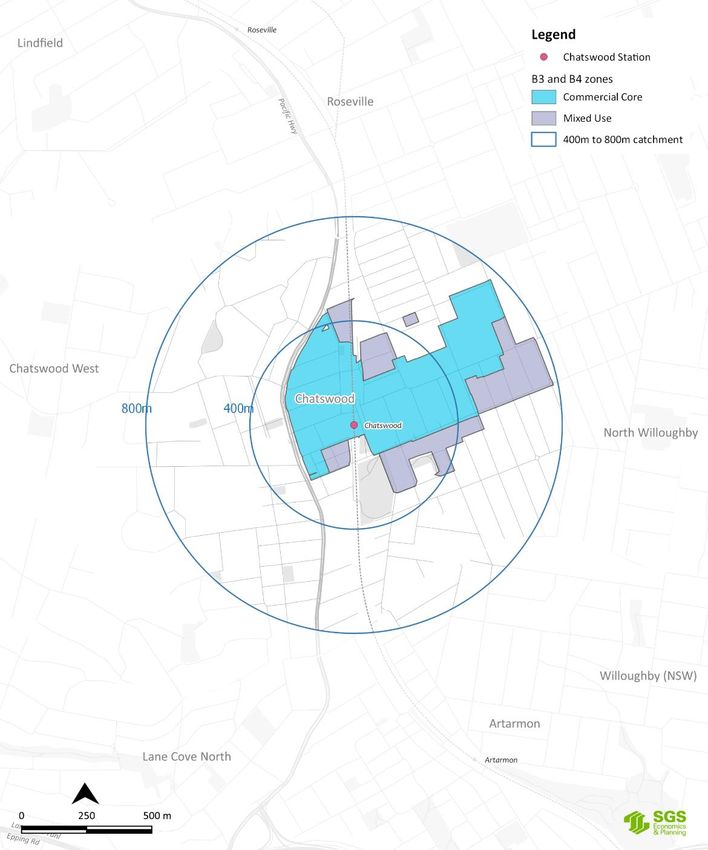
TABLE 1: NORTH SHORE OFFICE MARKET INDICATORS AS AT JULY 2019

                                                                     Annual net      Avg net            Outgoings   Average     Core
                                     Total Stock     Vacancy
  Market          Grade                                              absorption      face rent          ($/sqm)     incentive   market
                                     (sqm)           Rate (%)
                                                                     (sqm)           ($/sqm)                        (%)         yield (%)
  North
                  Prime              290,424         10.2            4,205           822                140         21.1        4.75 - 5.25
  Sydney
  North
                  Secondary          534,463         6.6             3,686           687                135         20.0        5.25 - 5.50
  Sydney
  North
                  Total market       832,887         7.9             7,891           750                137         20.5        4.75 - 5.50
  Sydney
  Crows
  Nest/St         Prime              102,699         1.8             13,302          608                130         21.0        5.25 - 5.75
  Leonards
  Crows
  Nest/St         Secondary          204,928         9.4             -3,388          548                105         21.5        5.25 – 6.25
  Leonards
  Crows
  Nest/St         Total market       307,627         6.9             9,914           575                120         21.2        5.50 – 6.00
  Leonards
  Chatswood       Prime              157,412         3.6             4,688           571                132         21.1        5.25 – 6.25
  Chatswood       Secondary          120,566         8.4             -3,330          488                114         21.7        5.50 – 6.00
  Chatswood       Total market       277,978         5.7             1,358           530                122         21.5        5.25 – 6.25
  Macquarie
                  Prime              644,824         3.8             -1,713          405                100         22.0        5.50 – 6.00
  Park
  Macquarie
                  Secondary          214,210         8.3             -,2209          335                100         24.0        6.00 – 6.50
  Park
  Macquarie
  Park/North      Total market       859,034         4.9             -3,922          385                100         23.0        5.50 – 6.50
  Ryde
Source: Knight Frank Research 2019

                          Chatswood has a comparatively low vacancy rate for its prime (premium and A) grade office
                          stocks (3.6% as of July 2019), and higher vacancy rate for secondary (B, C and D) grade office
                          stocks (8.4% as of July 2019). Leasing activity is reported to be strong, with shortages for
                          tenancies under 300 sqm, and an expectation that rents will increase in the near future as a
                          result. Incentives for B grade offices are approximately 15% Gross, with A grade incentives at
                          approximately 19% as of early 20191. Chatswood’s core market yield is competitive to other
                          centres in the North Shore office market at 5.25% to 6.25% for prime stocks and 5.5% to 6%
                          for secondary stocks.
                          The annual net absorption rate for secondary grade office stock is a decrease of 3,330 sqm,
                          this is consistent with most of the other places in the North Shore area, such as Macquarie
                          Park with a decrease of 2,209 sqm, and Crows Nest/ St Leonards with a decrease of 3,388
                          sqm. An exception to this decrease in the annual net absorption of secondary grade office
                          spaces is North Sydney. North Sydney has lower vacancy rate for secondary grade offices
                          (6.6%) and higher vacancy rates for prime grade offices (10.2%).
                          It is generally expected that office demand in Chatswood will remain strong. Some of the
                          locational drivers that have been cited in major tenant relocations were strong amenity, good
                          transport connections to Sydney CBD and other centres, and comprehensive retail offerings.

                          1   Sydney’s North Shore Office Market Update March 2019, CI Australia 2019

                    Advice on Chatswood CBD mixed use zone                                                                                    4
Real estate agent consultation
   Commercial real estate agents active in the Chatswood area from the following agencies were
   interviewed regarding the current and likely future performance of the Chatswood office
   market:
   ▪    CBRE,
   ▪    Colliers International, and
   ▪    Knight Frank.

   The following themes emerged from this consultation.
   Chatswood’s commercial market
   Chatswood’s commercial property market is tightly held with relatively low vacancy rates.
   Rents are slightly lower than those in North Sydney or St Leonards, making Chatswood slightly
   more affordable and reflecting its increased distance from the Sydney CBD and slightly older
   building stock.
   Commercial floorspace is highly concentrated, and the commercial core area is performing
   particularly well. These is a shortage of A grade commercial office space, partly as a result of
   the very limited commercial development over the past 30 years. Commercial and retail
   floorspace further from the Chatswood train station and away from the main centre of
   activity on Victoria Avenue is more difficult to find tenants for.
   Chatswood was generally seen to attract different kinds of tenants than other nearby centres.
   St Leonards has a strong focus on health, and large medical businesses were stated to be
   likely to stay in St Leonards. North Sydney currently has a stronger offering for large corporate
   businesses than Chatswood, partly as a result of the lack of recent A grade office
   development in Chatswood, although Chatswood does accommodate some large commercial
   tenants. There are a large number of smaller strata office suites in Chatswood, which house
   population-serving businesses.
   Locational drivers of smaller firms
   Several locational drivers leading businesses to locate in Chatswood were identified. These
   include:
   ▪    Good public transport connectivity,
   ▪    Cheaper rent than some other large office markets including North Sydney, St Leonards
        and the Sydney CBD,
   ▪    Proximity to where workers and business owners live on the North Shore,
   ▪    Proximity to other commercial tenancies and uses, and
   ▪    A vibrant retail offering and good amenities, making Chatswood an attractive location to
        work.
   Opportunities
   While some agents’ advice was that large commercial businesses could be reluctant to shift
   from North Sydney or similar locations to Chatswood, an unmet demand was identified for
   premium or A-grade office space within the commercial core. This was seen to present an
   opportunity for expansion of employment, with Chatswood identified as a popular location
   for work for people living in the North Shore area.
   Chatswood was also identified as a good location to build hotels for business travellers given
   its large office market, amenity and public transport proximity to other large office markets
   including Macquarie Park, North Sydney, St Leonards and the Sydney CBD.
   Population growth was highlighted as a potential opportunity, with growth expected in small
   firms and population serving industries to cater to people moving to the area. This will create
   demand for more small office spaces.

Advice on Chatswood CBD mixed use zone                                                                5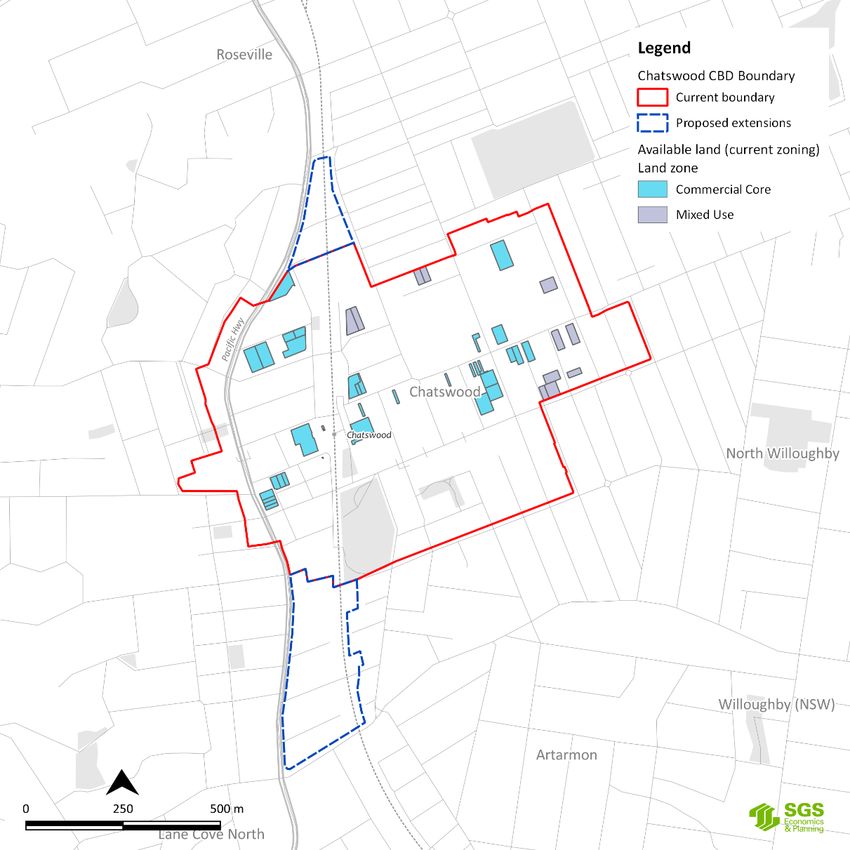
Challenges
   Agents highlighted potential challenges to leasing out commercial tenancies in proposed
   mixed use developments. Businesses prefer to co-locate with other businesses so the
   presence of significant amounts of residential development could constrain the attraction of
   large corporate tenants if the residential development is not well designed. There is a need
   for a commercial atmosphere and sense of address, particularly for larger corporate clients.
   Businesses are also reluctant to deal with strata committees composed primarily of
   residential apartment owners.
   Recommended uses for B4: Mixed Use zone
   Agents highlighted the following examples of businesses which could be appropriate for
   mixed use developments in the B4 zone:
   ▪     Hotels,
   ▪     Gyms and other leisure facilities,
   ▪     Population services like childcare centres, medical clinics and tuition services,
   ▪     Retail spaces
   ▪     Offices for small and population serving businesses

   2.3       Mixed use case studies
   Several centres with both commercial core and mixed use zones were profiled to determine
   what kinds of businesses and uses tend to locate in the commercial core area, and what kind
   tend to locate in the mixed use area. This provides a guide to how mixed use developments in
   the proposed extensions to the mixed use zone in Chatswood could perform.

   Chatswood
   The existing Chatswood CBD is shown in Figure 2. The B4 zone is smaller than the B3 zone and
   is located between it and the surrounding residential areas.
   There are a variety of current uses in the B3 zone including:
   ▪     Professional services: Lbh Australia (shipping service), Ventia (infrastructure service
         provider),
   ▪     Corporate headquarters: Huawei Technologies, AARNet, PepsiCo Australia & New
         Zealand, The Smith's Snackfood Company,
   ▪     Peak industrial bodies: Engineers Australia Sydney,
   ▪     Hotels: Mantra Chatswood, the Sebel Sydney Chatswood, Silkari Suites at Chatswood, and
   ▪     Shopping centres: Mandarin Centre, Westfield Chatswood, Chatswood Chase.
   Current uses in the B4 zone are predominately smaller businesses including many that cater
   to the local population, however there are also large stand-alone premises. Examples of
   businesses in the B4 zone are:
   ▪     Smaller professional services: Valiant Real Estate
   ▪     Smaller financial services: Travelex, HSBC Bank Australia
   ▪     Hotels: Quest Chatswood, Meriton Suites
   ▪     Student accommodation: Iglu Chatswood
   ▪     Tuition services: Alliance Française de Sydney, Pre-Uni New College Chatswood, Universal
         KIDS, NumberWorks'nWords Chatswood
   ▪     Community facilities and services: Community centre, Baptist Church
   ▪     Child care centres: CMA Mental Arithmetic Chatswood, Swan Academy
   ▪     Medical services: Douglass Hanly Moir Collection Centre, Laverty Pathology, Hearing
         Australia Chatswood, Infinite Health. Anderson & Partners
   ▪     Residential developments: Dougherty Apartments, Chatswood Place (225 apartment
         units, 4,000 sqm of retail, dining and child care centre)

Advice on Chatswood CBD mixed use zone                                                            6
FIGURE 2: THE EXISTING CHATSWOOD CBD INCLUDING THE MIXED USE AND COMMERCIAL CORE ZONES Source: SGS 2020 North Sydney The North Sydney centre is shown in Figure 3. Similarly to Chatswood, North Sydney has a large B3 zone close to the Train Station, with the B4 zone is mostly located further from the train station. Clause 4.4A of the North Sydney LEP 2013 applies to the B4 zones around North Sydney and requires a minimum non-residential floor space ratio and active street frontages in new developments. Most sites have a 0.5:1 requirement for non-residential floor space, including those which are relatively far from the North Sydney Station and commercial core. Advice on Chatswood CBD mixed use zone 7
FIGURE 3: THE NORTH SYDNEY CENTRE INCLUDING THE MIXED USE AND COMMERCIAL CORE ZONES

   Source: SGS 2020

   Examples of current uses in B3 zone include:
   ▪    Professional services: Achieving Acumen (business management consultant), My Business
        Plus (marketing agency), Grange Business Partners (accounting firm), Learn to Trade
        Australia (educational consultant)
   ▪    Corporate headquarters: Nokia Solutions and Networks, BT Australasia, OncoSil Medical
        Limited,
   ▪    Peak industrial bodies: NSW Business Chamber
   ▪    Hotels: Meriton Suites, Harbourview Hotel, Vibe Hotel, Quest North Sydney
   Current uses in the B4 zone include:
   ▪    Smaller professional services: Robertson Jim (Financial consultant), I-View (Market
        researcher), IPSOS Australia (Market Research), Cockram (construction company)
   ▪    Hotels: Rydges North Sydney, Astra Apartments
   ▪    Apartments with ground floor retail outlets and childcare centres

Advice on Chatswood CBD mixed use zone                                                        8
There are several examples of recent and proposed mixed use developments in North Sydney
including:
▪ SKYE, 211-223 Pacific Highway, North Sydney
An 18 storey mixed use development with two ground floor retail premises, some
commercial premises on part of the first floor and residential development otherwise. It
has a non-residential FSR of 0.5:1. The development has been completed and contains a
café, boat hire office and gym.
▪ The Miller, 221 Miller Street, North Sydney
A 22 storey mixed uses development including a large consolidated retail space on the
ground floor, along with 100 serviced and 183 residential apartments. It replaces a
15storey commercial building. There is a 3:1 non-residential development requirement
for this site (the provisions applying to this site differ from those applying to surrounding
sites, which have a 0.5:1 non-residential FSR requirement), which the development
satisfies with the serviced apartment component. The retail component of the
development has an FSR of approximately 0.35 when the site’s access handle is excluded.
▪ 231 Miller Street, North Sydney
A mixed use development containing a large ground floor retail space and 61 residential
apartments. The retail space of 268sqm proves a non-residential FSR of approximately
0.51:1.
▪ 229 Miller Street, North Sydney
A mixed use development containing one level of commercial offices, an additional
commercial/retail premise on the ground level and residential apartments. In the
application documents the commercial offices are noted to be intended to be used as a
childcare centre. The proposal provides 0.69:1 of non-residential floorspace in total.
▪ 168 Walker Street, North Sydney
A mixed use development with 440 residential units, as well as retail spaces on the
ground floor and commercial office suites on the first floor. This proposal has a relatively
large site area (4,898 sqm), and so the proposed retail and commercial premises provide
a total non-residential FSR of 0.51:1.
There are some examples in North Sydney of horizontal mixed use across multiple different
sites, with exclusively residential and commercial buildings located side by side. For example,
a residential building at 2 Mount Street is located next to offices at 16 Mount Street and the
Coca-Cola Amatil building on the intersection of Mount Street and William Street. While this
does not provide a guide for potential development outcomes on a single site, it does indicate
that this kind of proximity of commercial offices and residential uses is possible.
Parramatta
Parramatta’s centre is shown in Figure 4. There is a much larger area covered by commercial
zones than in North Sydney or Chatswood, with a smaller B3 zone covering the area
immediately north and south-east of Parramatta Station and a large B4 zone surrounding it.
Advice on Chatswood CBD mixed use zone 9FIGURE 4: THE PARRAMATTA CENTRE INCLUDING THE MIXED USE AND COMMERCIAL CORE ZONES Source: SGS 2020 The B3 zone is predominately composed of large commercial premises including government agencies in the Parramatta Place development. There are a wide variety of uses in the B4 zone, including many in office buildings with no residential component. The uses in these locations do not reflect the possible uses in new mixed use developments. There are also parts of the mixed use zone that are almost exclusively residential. Commercial uses in mixed use developments include music academies, small offices, local services (hair dressing, dry cleaning, gyms, accounting firms and medical centres), cafes and restaurants. These mixed use developments generally comprise ground floor non-residential uses with residential apartments above. Examples of mixed use developments are shown in Figure 5. Advice on Chatswood CBD mixed use zone 10
FIGURE 5: MIXED USE DEVELOPMENTS WITH RESIDENTIAL AND COMMERCIAL COMPONENTS IN
   PARRAMATTA – (A) 29 CAMPBELL STREET AND (B) 8 COWPER STREET

                      29 Campbell Street                              8 Cowper Street
   Source: Google street view

   Burwood
   The Burwood Town Centre is shown in Figure 6. The centre contains only a mixed use zone
   and no commercial core. Nonetheless, there are large commercial developments and a
   variety of mixed use developments within the Burwood Town Centre and so it provides an
   example of the kinds of commercial uses that could locate in a mixed use zone. The Burwood
   LEP sets a maximum residential FSR which is less than the maximum allowable FSR, and so
   mixed use developments in the Burwood Town Centre need to provide commercial
   floorspace to achieve the maximum available FSR.
   Mixed use developments in the Burwood Town Centre include:
   ▪    27 Belmore Street, a residential apartment development containing restaurants, a
        supermarket, retail shops and entertainment services such as karaoke,
   ▪    1 Railway Parade: A residential apartment development with ground floor retail tenancies
        and first floor strata offices, including a travel agency, beauty clinic, architectural design
        consultancy, real estate services and law firm,
   ▪    3 Railway Parade: a residential apartment development with retail tenancies on the
        ground floor and some other commercial premises including a hairdresser, gym, medical
        centre and Navitas English education centre, and
   ▪    266-274 Burwood Road, a shop-top housing development at the southern end of the
        Burwood Town Centre containing an education centre, dentist, restaurant, real estate
        service and physiotherapist.
   Mixed use developments generally have ground floor non-residential uses with one or more
   other floors of non-residential uses above the ground level. Examples of mixed use
   developments are shown in Figure 7.

Advice on Chatswood CBD mixed use zone                                                              11
FIGURE 6: THE BURWOOD TOWN CENTRE Source: SGS 2020 Advice on Chatswood CBD mixed use zone 12
FIGURE 7: MIXED USE DEVELOPMENTS IN THE BURWOOD TOWN CENTRE

                   27 Belmore Street                              Railway Parade

                266-274 Burwood Road                       18-20 George Street Burwood

   Findings
   These case studies show that there is a diverse range of uses in mixed use zones throughout
   Sydney. In some cases, this is a result of the mixed use zone being created in an area which
   already contains large commercial buildings. However, more modern mixed use
   developments demonstrate that a range of retail, hospitality, small offices and local services
   are likely to locate in mixed use developments which contain substantial residential
   components.
   There are relatively few examples of mixed use developments which contain large premium
   office floorspace in the same building as residential apartments. As noted by estate agents
   consulted for this study, large corporate tenants prefer to be located in exclusive commercial
   developments with a strong sense of address. However, there are some examples of
   horizontal separation of commercial and residential developments, with an example in the
   North Sydney case study.

Advice on Chatswood CBD mixed use zone                                                              13
3. FEASIBILITY MODELLING This section contains the results of high-level modelling of the impact of non-residential floorspace on the development feasibility of a mixed use development. This is different to the market feasibility (otherwise known as the market depth), which is discussed in Sections 2 and 4. 3.1 Feasibility methodology Development feasibility is typically assessed by comparing the residual land value (RLV) to the existing use value for a site. The RLV can be thought of as the maximum amount a rational developer would pay for a development site. RLV is estimated by deducting all development costs, including profit mark and a risk contingency, from anticipated development revenue. The amount leftover – the residual – could be capitalised into the value of the land. This is shown conceptually in Figure 8. FIGURE 8: RESIDUAL LAND VALUE APPROACH TO FEASIBILITY ANALYSIS Source: SGS 2020 A hypothetical development is considered to be feasible if the RLV is sufficient to entice a landowner to sell their site for redevelopment. Feasibility under an RLV model is usually reported with a ratio of RLV to current land value. If this ratio is 1.25 or greater, a developer could afford to pay a 25% premium on the existing land value to acquire a site for development. This means that a developer could afford to pay a premium to entice a landowner to sell a site for development and so development is reported to be feasible. The price premium would facilitate the amalgamation of sites for development. A feasibility ratio of between 1 - 1.25 indicates that development may be feasible. At this feasibility ratio a developer would be able to make enough profit from a development to cover the cost of acquisition of the land if a landowner is willing to sell their land for a smaller price margin than 25%. However, as there is less room for a price premium in the event of an increase in land value, and developers may have difficulty amalgamating multiple sites. In this case, development is reported to be marginally feasible. A feasibility ratio of less than 1 indicates that a developer would not make enough profit to make development viable. Advice on Chatswood CBD mixed use zone 14
Feasibility testing sites
Development feasibility was tested on four sites in the Chatswood CBD intended to represent
a range of potential development site types and locations. In each case the sites are within
the area proposed to be zoned for mixed use and to have a maximum FSR of 6:1 with a 1:1
non-residential development requirement.
The selected sites are listed below. The feasibility of mixed use development has been tested
in each case assuming that development sites can be amalgamated where necessary and
using the following development scenarios:
▪ No commercial development and 6:1 residential development,
▪ 0.5:1 ground floor retail development and 5.5:1 residential development,
▪ 1:1 non-residential development (comprising 0.3:1 retail and 0.7:1 office/services) and
5:1 residential development, and
▪ 1.5:1 non-residential development (comprising 0.3:1 retail and 1.2:1 office/services) and
4.5:1 residential development.
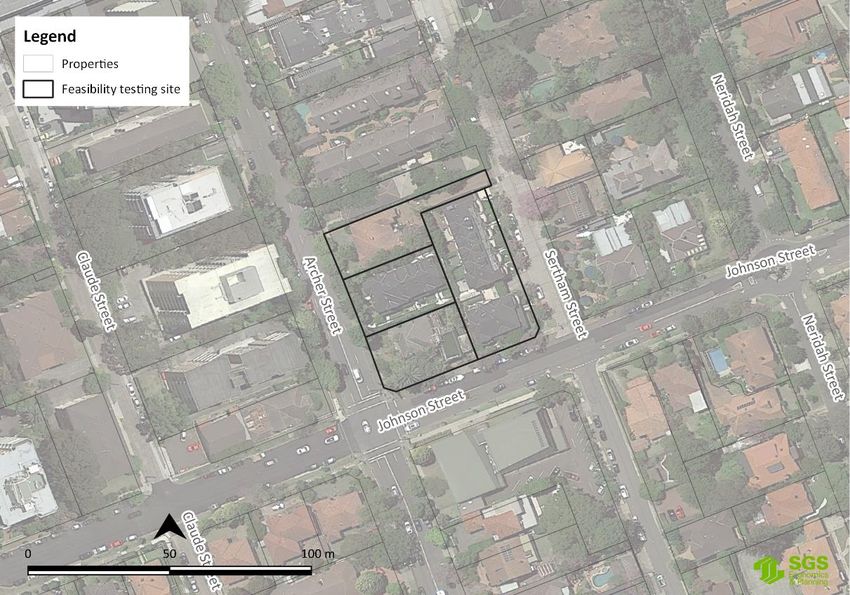
Site 1: Archer Street, Johnson Street and Bertram Street
This site is comprised of four properties which would need to be amalgamated to produce a
large development site. Two of these properties contain detached residential dwellings and
the other two contain 2-3 storey residential flat buildings.
The feasibility of development on this site illustrates the feasibility of mixed use development
where the amalgamation of multiple residential properties with relatively low existing density
is proposed.
FIGURE 9: SITE 1 FOR FEASIBILITY TESTING
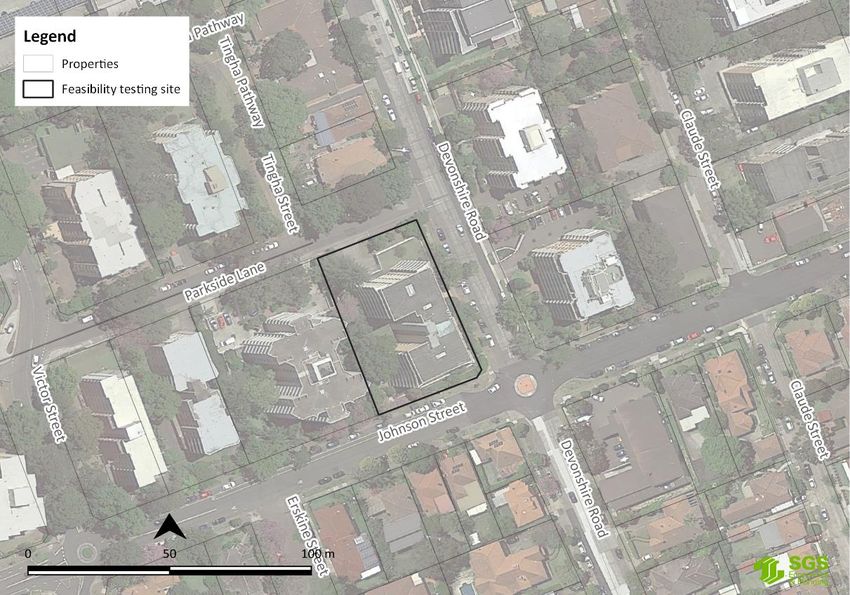
Site 2: 16-22 Devonshire Street
This site contains a single large residential flat building which is strata subdivided and which
contains 44 apartments. This building is nine storeys high and is characteristic of the existing
large and relatively old residential flat buildings in the southern part of the Chatswood CBD.
Advice on Chatswood CBD mixed use zone 15The feasibility of development of this site provides an indication of whether these residential flat buildings would be feasible to be redeveloped. Development feasibility will be hampered by the high land price associated with the existing high density development of the site. FIGURE 10: SITE 2 FOR FEASIBILITY TESTING Site 3: 655A Pacific Highway This site contains a three-storey residential flat building which is strata-subdivided and which accommodates 34 residential units. It is bounded by the Pacific Highway and the Chatswood Bowling Club. A frontage to the Pacific Highway would reduce the amenity of any residential or commercial development on this site. There are several low-rise residential flat buildings in the proposed southern extension to the Chatswood CBD, which contains Site 3. The feasibility of development on this site provides an indication of feasibility in the southern extension area more broadly. Advice on Chatswood CBD mixed use zone 16
FIGURE 11: SITE 3 FOR FEASIBILITY TESTNIG

   Site 4: 849-859 Pacific Highway and 2 Wilson Street
   This site contains four walk-up style residential flat buildings accommodating a total of 36
   apartments. As with Site 3, it is located on the Pacific Highway which would lower the amenity
   of a resulting development. However, this site is less isolated from commercial development
   than Site 3 as it is located immediately north of the developed commercial core of the
   Chatswood CBD (to the west of the railway line).
   Assembling Site 4 for development would be relatively difficult as it contains multiple strata-
   subdivided residential flat buildings. However, the density of development is lower than on
   some of the other sites.

Advice on Chatswood CBD mixed use zone                                                               17
FIGURE 12: SITE 4 FOR FEASIBILITY TESTING

   Assumptions
   Table 2 below shows the cost inputs and assumptions used in the feasibility modelling.

   TABLE 2: COST INPUTS AND ASSUMPTIONS

    Input                                Source                                      Value

    Construction and demolition          Rawlinson’s Construction Handbook
                                                                                     Varies
    costs                                2018
                                         Profiling of recent nearby sales,
                                                                                     Site 1: $42,800,000
                                         including 25% premium for acquisition
                                                                                     Site 2: $56,100,000
    Property acquisition rate            of strata subdivided sites reflecting the
                                                                                     Site 3: $41,650,000
                                         difficulty in acquiring all units in a
                                                                                     Site 4: $42,375,000
                                         strata development
                                         Various sources using industry
    Construction contingency                                                         10% of base construction costs
                                         standards
                                         Various sources using industry              10% of base construction costs
    Professional fees
                                         standards                                   and contingency
                                                                                     1% of construction costs or s7.11
                                         Willoughby Local Infrastructure             contribution on residential
    Development contributions
                                         Contributions Plan 2019                     component of development
                                                                                     (whichever is less)
                                         EP&A regulations (marginal fee only –
    DA Fees                              does not account for other fees and         Varies
                                         charges)
                                         Various sources using industry              6% of construction costs, land
    Finance costs
                                         standards                                   costs and fees & charges
                                         Various sources using industry              20% of all other development
    Developer profit and risk
                                         standards                                   costs
    Sales commission, marketing and      Various sources using industry
                                                                                     4% of sales revenues
    legal fees                           standards

Advice on Chatswood CBD mixed use zone                                                                                18
Residential revenue assumptions
Residential sale prices were calculated from the median of prices achieved by the recent
development in the Chatswood CBD bounded by Victoria Avenue, Hercules Street, Albert
Avenue and Oscar Street. Following consultation with local real estate agents and profiling of
sales, these prices were reduced by 10% to reflect the distance of the feasibility testing sites
from Chatswood Station and from shopping centres and other amenities giving the following
sale prices:
▪ One bedroom: $857,250 +GST
▪ Two bedrooms: $1,396,350 +GST
▪ Three bedrooms: $2,115,000 +GST
A further 10% reduction was applied to properties on the western side of the railway line
which have a frontage to the Pacific Highway, as amenity is reduced by the highway frontage
and by this location.
Office and retail revenue assumptions
The average price for retail and office space for the Chatswood CBD was used to estimate
likely office and retail development revenue2:
▪ Retail: $8,241/sqm
▪ Office: $6,754/sqm
Following consultation with real estate agents, the following reductions to the office sales
values were applied to reflect the reduced office amenity of some of the sites:
▪ A 10% reduction was applied for Site 1 given its distance from Chatswood Station
▪ A 15% reduction was applied for Site 3 given its relative isolation from other commercial
premises and distance from Chatswood Station
Following consultation with real estate agents, the following reductions to the retail sales
values were applied to reflect the reduced retail amenity of some of the sites and the desire
for retailers to be near Victoria Avenue, Chatswood’s main retail artery:
▪ A 25% reduction for Site 1, Site 2 and Site 4
▪ A 50% reduction for site 3 given its reduced amenity due to its frontage to the Pacific
Highway and its greater isolation from other retail premises
3.2 Feasibility results
RLV ratio results are shown in Table 3 for each development site and development scenario.
In all cases the highest RLV ratios are provided by the scenarios in which no commercial
development occurs, with lower ratios as the amount of commercial floorspace required
increases. This reflects that residential development has the highest returns per square metre
(assumed to be between $13,800 and $17,000 per square metre in the Chatswood CBD).
As noted above, an RLV ratio of 1.25 or higher is usually regarded as necessary for
development to be feasible, reflecting the need for a premium to be paid to assemble a
development site. As a 25% premium is already included in the land acquisition cost for strata
units in the calculations underlying Table 3, a ratio of less than 1.25 may reflect a feasible
development. An RLV ratio of less than 1 would represent a marginally feasible development
if strata apartments could be quickly acquired for their market price.
2 Average prices were sourced from www.commercialpropertyguide.com.au/
Advice on Chatswood CBD mixed use zone 19TABLE 3: FEASIBILITY RESULTS (RLV RATIO)
Commercial
Site 1 Site 2 Site 3 Site 4
development amount
No commercial
2.19 1.08 2.02 1.42
development
0.5:1 commercial
development, exclusively 2.09 1.03 2.02 1.38
retail
1:1 commercial
development, mix of 1.92 0.96 1.87 1.30
retail and office
1.5:1 commercial
development, mix of 1.76 0.91 1.74 1.24
retail and office
Feasible May be Unfeasible
feasible
Source: SGS 2020
Development of sites 1 and 3 were found to be feasible under every development scenario.
Site 4 was found to be feasible under all scenarios except for a 1.5:1 commercial development
requirement, which would be marginally feasible. The high RLV ratios reflect the large uplift
which a 6:1 FSR would provide. Under the no commercial development scenario, the ratio of
new dwellings to existing dwellings would be 15 and 8 on sites 1 and 3 respectively.
Site 2 is likely to be marginally feasible to develop if no commercial development or a minimal
amount of commercial development is included. However, requiring commercial components
of 1:1 or 1.5:1 would make development unfeasible. This unfeasibility reflects the high
acquisition price for Site 2, which contains a large existing apartment building. Even with this
high acquisition price, the feasibility ratio for a 1:1 commercial development requirement is
only slightly less than 1, meaning that development may become feasible if a developer is
willing to accept a smaller profit margin or as market cycles occur in the future, particularly if
the value of the apartments on this site decrease as they age.
A sensitivity analysis is presented in Table 4 in which commercial and retail revenues are
decreased by 25%. This decreases development feasibility slightly, but does not change the
overall feasibility results, indicating that whether development is feasible or not is most
strongly influenced by the proportion of residential development and by the residential sale
prices rather than by commercial or retail revenues.
Advice on Chatswood CBD mixed use zone 20TABLE 4: FEASIBILITY RESULTS (RLV RATIO) WITH A 25% REDUCTION IN COMMERCIAL AND RETAIL REVENUES
Commercial
Site 1 Site 2 Site 3 Site 4
development amount
No commercial
2.19 1.08 2.02 1.42
development
0.5:1 commercial
development, exclusively 2.05 1.02 1.99 1.35
retail
1:1 commercial
development, mix of 1.85 0.93 1.80 1.24
retail and office
1.5:1 commercial
development, mix of 1.65 0.85 1.63 1.15
retail and office
Feasible May be Unfeasible
feasible
Source: SGS 2020
Advice on Chatswood CBD mixed use zone 214. CAPACITY AND DEMAND
This section discusses the implications of the proposed amendments to planning controls on
Chatswood’s floorspace capacity, and compares this to the floorspace demand indicated by
population projections. When considered with potential tenants illustrated by real estate
agent consultation and case studies in Chapter 2, this provides an indication of whether there
is likely to be enough demand to justify a non-residential floorspace requirement.
4.1 Floorspace demand
Demand modelling method
Floorspace demand was forecast by matching forecast employment growth in the Chatswood
CBD with current floorspace data. A floorspace audit was conducted by SGS in 2014 as part of
the Willoughby City Council Economic Development Study. The Cordell Connect database was
used to add floorspace in developments completed between 2014 and 2016. The resulting
floorspace estimates are shown in Table 5. These results are broken down by industry as
categorised by the Australian Bureau of Statistics as well as by the broad land use of each
building, including the following categories:
▪ Services, including local health and education facilities and other buildings predominately
associated with services for the local population,
▪ Offices,
▪ Retail and hospitality, including buildings predominately used as shops or restaurants,
and
▪ Other, predominately large format premises situated along the Hume Highway and
automotive retail.
Note that these categories refer to the broad land use of each building, which may differ from
the individual businesses operating within it. For example, while most retail premises are
contained in retail and hospitality buildings, an office or services building may contain retail
premises.
Floorspace projections were created by growing 2016 floorspace amounts for each industry
and broad land use category in line with forecast employment by industry growth rates from
the TZP v1.51 employment projections produced by Transport for NSW. Projected
employment growth rates for the Chatswood CBD are shown in Figure 13.
The highest growth rates are predicted to occur in industries typically regarded as knowledge
intensive or associated with health or education, including financial and professional services,
rental and real estate services, education and training, health care and social assistance and
arts and recreation services. Of these, professional services and health care and social
assistance are two of the largest industries of employment in the Chatswood CBD.
Substantial growth is also forecast in population-serving industries like retail trade and
accommodation and food services industries, catering to the expanding population. These are
also large industries of employment in the Chatswood CBD.
Advice on Chatswood CBD mixed use zone 22TABLE 5: FLOORSPACE BY BROAD LAND USE CATEGORY AND INDUSTRY IN THE CHATSWOOD CBD 2016 (SQM)
Retail and
Industry Services hospitality Other Office Total
Manufacturing 152 490 0 1,998 2,640
Construction 0 204 0 0 204
Wholesale Trade 0 472 413 0 886
Retail Trade 643 158,290 7,674 2,110 168,716
Accomm & Food
Services 37,794 46,142 0 7,138 91,074
Transport &
Warehousing 0 1,543 0 2,482 4,025
Media & Telecomm 990 6,687 0 44,268 51,944
Financial &
Insurance Services 654 4,218 0 26,882 31,754
Rental & Real
Estate Services 134 3,399 471 4,214 8,218
Professional
Services 991 3,712 0 92,031 96,734
Admin Services 469 6,152 677 108,553 115,851
Public Admin &
Safety 10,858 987 0 17,335 29,179
Education &
Training 2,192 2,889 0 7,746 12,827
Health Care &
Social Assistance 35,956 10,696 169 22,444 69,265
Arts & Recreation
Services 12,533 8,203 0 1,789 22,526
Other Services 4,518 14,902 469 5,152 25,041
Total 107,885 268,986 9,872 344,141 730,884
Source: SGS 2020
FIGURE 13: FORECAST EMPLOYMENT GROWTH RATES FOR THE CHATSWOOD CBD
Source: SGS 2020, Transport for NSW 2019 TZP v1.51 forecast
Advice on Chatswood CBD mixed use zone 23Future demand results
The estimated future demand for additional floorspace in the Chatswood CBD is shown in
Table 6 broken down by broad land use category and Table 7 broken down by industry. A
substantial amount of additional floorspace is estimated to be required between 2016-2036
and 2036-2056.
TABLE 6: FORECAST ADDITIONAL FLOORSPACE DEMAND BY BROAD LAND USE CATEGORY IN THE
CHATSWOOD CBD, 2016-2056
Floorspace demand Floorspace demand
BLC Type 2016-2036 2036-2056 Total demand 2016-2056
Services 28,683 34,145 62,828
Retail and hospitality 52,242 68,157 120,398
Office 84,185 81,409 165,594
Other 1,614 2,326 3,939
Total 166,724 186,037 352,760
Source: SGS 2020
TABLE 7: FORECAST ADDITIONAL FLOORSPACE DEMAND BY INDUSTRY IN THE CHATSWOOD CBD, 2016-2056
Floorspace demand Floorspace demand
Industry 2016-2036 2036-2056 Total demand 2016-2056
Manufacturing 747 1,350 2,098
Construction 51 59 110
Wholesale Trade 36 29 65
Retail Trade 24,472 39,135 63,607
Accomm & Food Services 23,637 24,203 47,840
Transport & Warehousing 110 165 276
Media & Telecomm 9,871 9,391 19,262
Financial & Insurance
Services 7,895 6,042 13,937
Rental & Real Estate
Services 2,689 2,982 5,671
Professional Services 26,247 19,298 45,545
Admin Services 27,988 29,908 57,896
Public Admin & Safety 5,756 3,929 9,684
Education & Training 4,553 6,194 10,746
Health Care & Social
Assistance 16,829 26,697 43,525
Arts & Recreation
Services 9,169 10,158 19,327
Other Services 6,674 6,497 13,171
Total 166,724 186,037 352,760
Source: SGS 2020
The greatest demand by land use category is for additional office floorspace, followed by
retail and hospitality and then services. The office floorspace demand would be split between
A-grade and premium offices with large floorplates and smaller offices suitable for businesses
providing local services. A more accurate estimate of future retail floorspace demand would
Advice on Chatswood CBD mixed use zone 24be given by retail modelling, but the estimates below suffice to provide a high-level estimate
of future floorspace demand for the purposes of strategic planning.
There is forecast demand for additional floorspace to accommodate a wide variety of
industries, with the highest demand from the retail trade, accommodation and food services,
professional services, administrative services and health care and social assistance industries.
The case studies in Section 2.3 show the type of non-residential land uses that would seek to
locate in a B4 mixed use zone, and the demand results show that there is anticipated to be
increased demand for these uses.
4.2 Development capacity
Capacity method
SGS has assessed the theoretical yield for retail and commercial development in the
Chatswood Town Centre under the current planning framework and the proposed changes.
This notional floorspace capacity identifies the total floorspace that would be realised if all
available sites were developed under various assumptions. This is an analysis undertaken to
inform a broad discussion of strategy for the centre and potential opportunities for additional
supply under planning controls, and as such a testing of low and high scenarios (and changes
in assumptions have been considered.
The following two development scenarios were calculated for development capacity under
the proposed changes to planning controls, reflecting the different assumptions which could
be made about which sites are likely to redevelop:
▪ A high scenario showing development capacity if significant redevelopment occurs
including on sites with substantial existing commercial development, and
▪ A low scenario showing a more constrained outcome where existing large commercial
buildings are not redeveloped.
Development feasibility analysis in Chapter 3 shows that even larger residential flat buildings
may be feasible to redevelop in the future under the proposed changes to planning controls.
The proposed mixed use zone does not include large existing commercial development so the
capacity calculation in the proposed mixed-use zone has not been varied between the two
scenarios.
This analysis took place in the following stages:
1. Available land was first determined. Available land represents all land where
commercial development is permissible and reasonable likely to occur.
2. The potential yield calculation was conducted, in which the yield of all available sites
if they were to be developed is calculated. Development assumptions are listed
below.
3. The net yield calculation was conducted, in which the existing commercial floorspace
on each site is subtracted from the potential yield to generate the amount of
additional floorspace, known as the ‘net yield’.
Potential development yield has been assessed on a site by site basis using high level
assumptions. This analysis is intended to provide a high-level overview of how proposed
changes in planning controls impact on development capacity rather than to model on a site-
specific basis where development is likely to occur. Site-specific constraints in combination
with design standards may mean that the possible yield of some sites is less than the
maximum permissible floor space, but in most cases appropriate design responses should
ensure that this does not occur. Site amalgamation would be required to allow some
properties to be redeveloped.
Advice on Chatswood CBD mixed use zone 25Exclusions
A series of exclusions are used to determine whether sites are likely to be redeveloped. These
exclusions are discussed below.
Public domain
Elements of the public domain are unlikely to be redeveloped and are manually excluded in all
scenarios.
Uplift exclusion
Sites on which current floorspace is 40% or more of the allowable gross floor area under
current planning controls have been assumed to be unfeasible to redevelop as the available
uplift is not considered large enough when compared with current development.
GFA and FSR exclusions – proposed controls low scenario
Sites in the proposed commercial core zone which have a developed notional FSR of 2:1 or
greater, or which contain 10,000sqm or more of GFA are already intensively developed and
are relatively unlikely to be redeveloped in the future. This is a stricter exclusion than the
uplift exclusion on sites where development is likely to be unfeasible or unlikely due to the
prohibitive cost of site acquisition. This exclusion has only been applied in the low scenario for
the proposed changes to planning controls.
Development yield under current planning controls
Development yields under current planning controls were calculated using the following
assumptions:
▪ Developments will achieve the maximum possible floor space ratio, with total floor area
determined by multiplying property size by the floor space ratio.
▪ In the B4 zone, developments will have a residential component with a notional FSR of
1:1. This is the maximum allowed under clause 4.4A (14) of the Willoughby LEP 2012.
▪ Where provisions permit increased FSRs in particular areas under clause 4.4A of the
Willoughby LEP 2012, all necessary conditions will be met and the maximum FSR
allowable under these provisions will be achieved.
Development yield under proposed planning controls
Development yields under the proposed planning controls were calculated using the lesser of
the following results:
▪ The maximum available floor space ratio, including any bonus provisions, multiplied by
the property area, and
▪ The floor area within a building envelope formed by a 50% site coverage and the
proposed maximum building heights, with a 4m floor to floor height and 90% building
efficiency used to convert building envelope volume to floor area.
In the mixed use zone, developments are assumed to have a notional commercial FSR of 1:1,
with the remainder of each development comprised of residential accommodation. In the
commercial area, all floorspace is assumed to be commercial.
Capacity results
Capacity results are shown in Table 8 under both current and proposed planning controls. The
proposed controls provide a substantial increase on current capacity, which is relatively
limited when compared with the estimated current floorspace supply (730,884 sqm).
The Chatswood CBD Planning and Urban Design Strategy estimated that under current
planning controls there is capacity for 245,000 sqm of floorspace (180,000 commercial and
Advice on Chatswood CBD mixed use zone 2665,000 residential) and capacity for 1,345,000sqm of floorspace under the proposed controls
(705,000 sqm residential and 640,000 commercial).
TABLE 8: COMMERCIAL DEVELOPMENT CAPACITY (SQM) IN THE CHATSWOOD CBD
Zone Current controls Proposed controls
Low scenario High scenario
B3 Commercial Core 175,090 (89%) 360,957 (69%) 1,199,768 (88%)
B4 Mixed Use 20,851 (11%) 163,195 (31%) 163,195 (12%)
Total 195,941 524,152 1,362,963
Source: SGS 2020
Available land for development under current planning controls is shown in Figure 14, while
available land under proposed planning controls is shown in Figure 15 for the high
development scenario and Figure 16 for the low development scenario.
The implications of these results and their alignment with demand is discussed below in
Section 4.3.
FIGURE 14: AVAILABLE LAND UNDER CURRENT PLANNING CONTROLS
Advice on Chatswood CBD mixed use zone 27Source: SGS 2020 FIGURE 15: AVAILABLE LAND UNDER PROPOSED PLANNING CONTROLS (HIGH DEVELOPMENT SCENARIO) Source: SGS 2020 Advice on Chatswood CBD mixed use zone 28
FIGURE 16: AVAILABLE LAND UNDER PROPOSED PLANNING CONTROLS (LOW DEVELOPMENT SCENARIO)

   Source: SGS 2020

   4.3        Gap analysis
   Two things are necessary to ensure that development can respond to increasing floorspace
   demand and that a healthy development pipeline is possible:
         1.   Development capacity which is substantially greater than expected demand, to
              reflect that capacity results show what would happen if all available sites were
              redeveloped but in reality only a proportion of sites are likely to be redeveloped and
              some may be developed to less than their maximum capacity. Some of the sites
              designated as being available may have site-specific constraints preventing
              redevelopment altogether.
         2.   A large number of available development sites, as only a small proportion of sites are
              likely to be within the development pipeline at any one time and development may
              take some time from inception to completion. Some sites may be difficult to develop,
              which means that more sites must be available.
   A comparison of the floorspace capacity and demand results from the previous sections is
   shown in Table 9. As noted above, capacity should ideally be much larger than likely demand
   to ensure that economic growth is not constrained.

Advice on Chatswood CBD mixed use zone                                                            29
TABLE 9: COMPARISON OF FLOORSPACE CAPACITY AND DEMAND
Capacity
Zone Commercial core – B3 Mixed use – B4 Total
Current
controls 179,738 23,882 203,619
Proposed
controls – low 360,957 163,195 524,152
Proposed
controls -
high 1,199,768 163,195 1,362,963
Demand
Broad land Retail and
use category Services hospitality Office Other Total
Demand
2016-2036 28,683 52,242 84,185 1,614 166,724
Demand
2036-2056 34,145 68,157 81,409 2,326 186,037
Total demand
2016-2056 62,828 120,398 165,594 3,939 352,760
Source: SGS 2020
Current planning controls
Under current planning controls there are few undeveloped sites where development is likely,
as shown by the relatively few sites highlighted in Figure 14. Some of these sites are along
Victoria Avenue where significant site amalgamation is required. The small number of
currently available sites is likely to constrain development and overcome the risk that future
supply will exceed potential demand.
Development capacity under current planning control is slightly larger than likely demand
between 2016-2036, and lower than demand between 2016-2056. As some sites may not be
redeveloped, this means that capacity is not large enough to accommodate likely demand
until 2036 or between 2036-2056. Without changes to planning controls, economic
development in Chatswood would be constrained in the medium and long term.
Proposed controls – low scenario
There are many more sites estimated to be available for development under the proposed
changes to the planning controls (as shown in Figure 15) even if more conservative
development assumptions are made (as shown in Figure 16). The increased maximum FSR
causes more sites to be included west of the North Shore Line, and on the southern side of
Victoria Avenue.
The current intensive development of many of the sites in Chatswood’s commercial core
means that under the low development scenario, there are still relatively few sites proposed
to be zoned B3 which are likely to be redeveloped and where significant site amalgamation is
not required. Commercial floorspace must be provided in the B4 zone to provide a healthy
pipeline of developable sites in the short-long term.
Capacity under the low scenario is somewhat higher than modelled floorspace demand
between 2016-2056. However, the capacity in the proposed B3 zone is only slightly higher
than the total 2016-2056 demand. As this total capacity is unlikely to be realised, the capacity
created in the B4 zone is needed to ensure that planning controls provide enough capacity to
meet long-term demand.
Advice on Chatswood CBD mixed use zone 30You can also read