Spatial transcriptome profiling by MERFISH reveals fetal liver hematopoietic stem cell niche architecture - Nature
←
→
Page content transcription
If your browser does not render page correctly, please read the page content below
Lu et al. Cell Discovery (2021)7:47
                                    https://doi.org/10.1038/s41421-021-00266-1
                                                                                                                                                                                                        Cell Discovery
                                                                                                                                                                                                     www.nature.com/celldisc

                                     ARTICLE                                                                                                                                                    Open Access

                                    Spatial transcriptome profiling by MERFISH reveals
                                    fetal liver hematopoietic stem cell niche
                                    architecture
                                    Yanfang Lu 1,2,3, Miao Liu1, Jennifer Yang1, Sherman M. Weissman1, Xinghua Pan2,3, Samuel G. Katz4 and
                                    Siyuan Wang 1,5

                                      Abstract
                                      The hematopoietic stem cell (HSC) niche has been extensively studied in bone marrow, yet a more systematic
                                      investigation into the microenvironment regulation of hematopoiesis in fetal liver is necessary. Here we investigate the
                                      spatial organization and transcriptional profile of individual cells in both wild type (WT) and Tet2−/− fetal livers, by
                                      multiplexed error robust fluorescence in situ hybridization. We find that specific pairs of fetal liver cell types are
                                      preferentially positioned next to each other. Ligand-receptor signaling molecule pairs such as Kitl and Kit are enriched
                                      in neighboring cell types. The majority of HSCs are in direct contact with endothelial cells (ECs) in both WT and Tet2−/−
                                      fetal livers. Loss of Tet2 increases the number of HSCs, and upregulates Wnt and Notch signaling genes in the HSC
                                      niche. Two subtypes of ECs, arterial ECs and sinusoidal ECs, and other cell types contribute distinct signaling molecules
                                      to the HSC niche. Collectively, this study provides a comprehensive picture and bioinformatic foundation for HSC
                                      spatial regulation in fetal liver.
                  1234567890():,;
1234567890():,;
                  1234567890():,;
1234567890():,;

                                    Introduction                                                                                          The microenvironment of HSCs, termed the “HSC
                                      Hematopoietic stem cells (HSCs) retain the potential to                                           niche”, influences fundamental properties of the HSCs,
                                    generate all lineages of blood cells throughout the life of                                         including proliferation, self-renewal, differentiation, and
                                    the organism. Long-term HSCs arise first in the dorsal                                               migration3. Various niches are present in different stages
                                    aorta of aorta–gonad–mesonephros region of mouse                                                    of development given the diversity of tissues where HSCs
                                    embryos around embryonic day 10.5 (E10.5) through an                                                reside, including the yolk sac, aorta–gonad–mesonephros
                                    endothelial-to-hematopoietic transition1. On day 12 of                                              region, placenta, fetal liver, spleen, and bone marrow4–6.
                                    gestation, HSCs migrate to the fetal liver through the                                              Distinct niches may have diverse responsibilities to meet
                                    blood circulation via the umbilical vein from the placenta.                                         the demand of hematopoietic cells during homeostasis
                                    In the fetal liver, HSCs undergo a 38-fold expansion until                                          and stress7. For example, fetal HSCs are more efficient in
                                    E162. Finally, HSCs migrate from the liver to the bone                                              regenerating certain cell populations such as CD5+ B cells
                                    marrow where they maintain life-long hematopoiesis.                                                 than adult HSCs8. Another difference is that HSCs are
                                                                                                                                        mostly quiescent in bone marrow9, whereas they actively
                                                                                                                                        proliferate in fetal liver2. However, in both settings the
                                                                                                                                        HSC niche tends to include endothelial cells (ECs), either
                                    Correspondence: Xinghua Pan (PanVictor@smu.edu.cn) or
                                                                                                                                        as part of portal vessels in the fetal liver or arterioles in the
                                    Samuel G. Katz (Samuel.Katz@yale.edu) or Siyuan Wang (Siyuan.Wang@yale.
                                    edu)                                                                                                bone marrow10,11. How prevalent HSCs are in direct
                                    1
                                    2
                                     Department of Genetics, Yale School of Medicine, New Haven, USA                                    contact with ECs is unknown. The study of HSC niches
                                     Department of Biochemistry and Molecular Biology, School of Basic Medical
                                                                                                                                        will further our understanding and treatment of various
                                    Sciences, Southern Medical University, Guangzhou, Guangdong, China
                                    Full list of author information is available at the end of the article                              hematopoietic diseases. Because it is difficult to attain
                                    These authors contributed equally: Yanfang Lu, Miao Liu.

                                    © The Author(s) 2021
                                                        Open Access This article is licensed under a Creative Commons Attribution 4.0 International License, which permits use, sharing, adaptation, distribution and reproduction
                                                        in any medium or format, as long as you give appropriate credit to the original author(s) and the source, provide a link to the Creative Commons license, and indicate if
                                    changes were made. The images or other third party material in this article are included in the article’s Creative Commons license, unless indicated otherwise in a credit line to the material. If
                                    material is not included in the article’s Creative Commons license and your intended use is not permitted by statutory regulation or exceeds the permitted use, you will need to obtain
                                    permission directly from the copyright holder. To view a copy of this license, visit http://creativecommons.org/licenses/by/4.0/.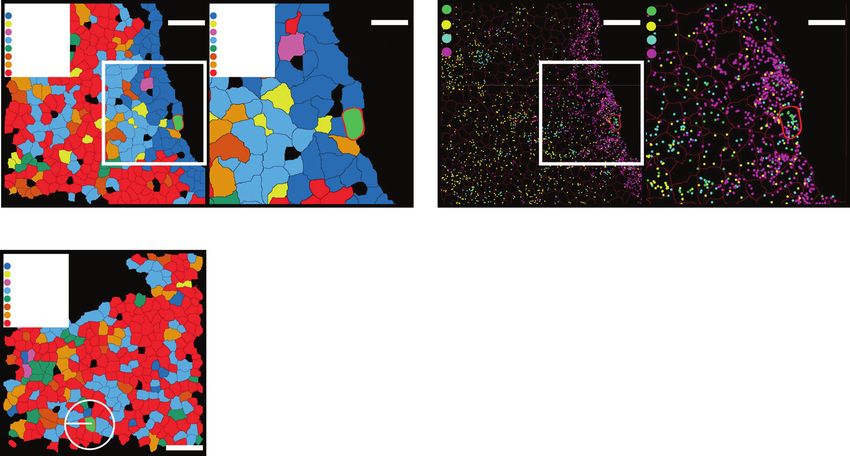
Lu et al. Cell Discovery (2021)7:47                                                                              Page 2 of 17

sufficient HSCs for direct clinical use, understanding a          scheme to label numerous RNA species, and a sequential
niche that supports rapid HSC expansion may offer gui-           smFISH strategy to read out the barcodes, each of which
dance to amplify HSCs ex vivo.                                   is associated with different RNA species27–29. Here, we
  Several microenvironment-dependent signaling path-             use MERFISH and scRNA-seq to explore hematopoiesis
ways have been shown as essential in regulating the self-        in mouse fetal liver and how it is altered in the absence of
renewal and differentiation of HSCs in the bone marrow.          TET2. The experimental workflow is illustrated in Sup-
These include: CXCL12/CXCR4 signaling, BMP signaling,            plementary Fig. S1. Using MERFISH, we profile numerous
Mpl/TPO signaling, Tie2/Ang-1 signaling, Wnt signaling,          niche factors, signaling factors, and cell type marker
and Notch signaling12. Wnt and Notch are particularly            transcripts simultaneously at the single cell level in situ.
complicated signaling pathways in the niche, because a           We analyze how cells of different types are spatially
large number of gene family members are involved in              organized into microenvironments, and how the cell type
each pathway, and because different levels of pathway            and the microenvironment organization jointly affect
activation yield different overall effects on the HSCs and       transcript profiles. Our results show that specific pairs of
hematopoiesis13,14. How these signaling pathways con-            cell types are enriched as neighbors in the fetal liver
tribute to fetal liver HSCs needs further investigation.         microenvironments. Particularly, HSCs locate pre-
  In addition to signaling pathways in the microenviron-         dominantly in endothelial niches and the majority of
ment, epigenetic elements also regulate HSC develop-             HSCs are in direct contact with one or several types of
ment, heterogeneity and proliferation. In particular, Tet2       ECs. We further compare the HSC niches in wild type
encodes a well-known epigenetic modifier that plays               (WT) and Tet2−/− fetal livers and show that loss of Tet2
important roles in hematopoiesis. TET2 regulates DNA             leads to an increased number of HSCs, as well as
methylation by conversion of 5-methylcytosine (5mC) to           increased expression of Wnt and Notch signaling genes
5-hydroxymethylcytosine (5hmC)15,16. Disruption of Tet2          within the HSC niche, suggesting a causal link between
enhances HSC self-renewal, and leads to myeloid trans-           the molecular and cellular changes and related pathology.
formation17,18. In addition to cell-autonomous functions         In addition, we show that arterial ECs (AECs), sinusoidal
within the HSC, loss of Tet2 increases bone marrow               ECs (SECs), and other fetal liver cell types offer distinct
stromal cell (BMSC) self-renewal and proliferation capa-         signaling molecules to the HSC niche.
city, and enhances their hematopoietic supportive capa-
city19. Clinically, loss-of-function mutations of Tet2 are       Results
found in clonal hematopoiesis of indeterminate poten-            scRNA-seq and MERFISH identify major cell types in fetal
tial20, 26% of myelodysplasia21, 12% of acute myeloid            liver
leukemia, and 42% of chronic myelomonocytic leuke-                 To characterize the gene expression features of different
mia22. Yet the effect of Tet2 in the fetal liver niche context   cell types in E14.5 mouse fetal liver, we first identified 11
is only partially understood.                                    major cell types in fetal liver with scRNA-seq (Fig. 1a).
  To better understand the function of the HSC niche, a          Cell type assignment was based on the marker genes
systematic characterization of cell types and active             selected from the Mouse Cell Atlas database30. We per-
molecular pathways within the HSC microenvironment is            formed RNA velocity analysis to derive the developmental
required. Single-cell RNA-sequencing (scRNA-seq) allows          relationship among the different cell types (Fig. 1b). RNA
profiling the heterogeneity of gene expression in indivi-         velocity was analyzed by calculating the ratio of spliced to
dual cells23. However, standard scRNA-seq requires cell          unspliced mRNAs in single cells, which predicts the
dissociation, which destroys the spatial context and             future state of each cell31. According to a two-
cell–cell interactions in the niche. Recent spatial scRNA-       dimensional representation of the single cell tran-
seq modalities detect spatial distribution of cell types, but    scriptome and the direction of the arrows in our RNA
are limited by the spatial resolution (some only partially       velocity map, erythroid cells, erythroid progenitors, mye-
matching the spatial scale of single cells), detection effi-      loids, basophils, and neutrophils were connected in a
ciency, and/or drop-out rate24,25. Single molecule fluor-         branched development trajectory, while megakaryocytes
escence in situ hybridization (smFISH) is a powerful tool        (MKs) and macrophages were separated from the above
to map and count RNAs in situ with high spatial resolu-          mentioned cells; erythroid progenitors differentiated into
tion and detection efficiency, but traditional smFISH can         erythroid cells; and neutrophils were separated into two
only measure a few RNA species at a time26. Multiplexed          main subtypes (Neutrophil_Elane and Neutrophil_Ngp)
error-robust fluorescence in situ hybridization (MER-             that appear to be differentiated from a common pro-
FISH) is a highly multiplexed FISH method to map                 genitor (Fig. 1b).
hundreds to thousands of RNA species at the single                 We further analyzed the gene ontology (GO) (biological
molecule level in single cells27–29. MERFISH is based on a       processes) of differentially expressed genes (DEGs) in
combinatorial barcoding and error-robust encoding                myeloid cells, MKs, erythroid progenitors, erythroid cells,
Lu et al. Cell Discovery (2021)7:47                                                                                                          Page 3 of 17

 Fig. 1 MERFISH identifies major cell types in fetal liver hematopoiesis. a UMAP visualization of cell clustering of 11 major cell types in the WT
 fetal liver by scRNA-seq (n = 7,635 cells). MK, megakaryocyte; EC, endothelial cell; Pre-B, Pre-B cell. b The observed and the extrapolated future states
 (arrows) are shown on the pre-defined UMAP. RNA velocity was estimated with spliced and unspliced RNA ratios in single cells. c UMAP plot of
 MERFISH data of WT fetal liver (n = 40,864 cells). We attained eight major cell types with MERFISH data with an extra small group of “Unknown” cells
 that we cannot distinguish. d Violin plot of example cell type markers in MERFISH data. x axis shows normalized abundance ranging from 0 to 0.3 for
 each gene. See Methods for the normalization procedure. e The correlation analysis of total RNA copy numbers from MERFISH imaging vs FPKM
 values from bulk RNA-seq for each probed RNA species. f The correlation analysis of total RNA copy numbers of two biological replicates of MERFISH
 for each probed RNA species. g The in situ map of identified cell types in a field of view (left panel) and the detected transcripts of example marker
 genes plotted in the same field of view (right panel).

HSCs, and ECs, in which each cell type was compared to                         cells expressed genes related to erythrocyte development
the other cell types (Supplementary Fig. S2). GO analysis of                   and homeostasis (Supplementary Fig. S2d); HSCs expressed
DEGs showed that myeloid cells, as expected, mainly                            genes that regulate the immune system, hematopoietic or
committed themselves to defense response and immune                            lymphoid organ development and hemopoiesis (Supple-
response (Supplementary Fig. S2a); DEGs of MKs showed                          mentary Fig. S2e); and DEGs of ECs were enriched with
wound healing, hemostasis, and platelet activation func-                       circulatory system development and vasculature/blood
tions (Supplementary Fig. S2b); DEGs of erythroid pro-                         vessel development functions (Supplementary Fig. S2f).
genitors were enriched for heme metabolic and                                    To analyze the distinct fetal liver cell types and their
biosynthetic processes (Supplementary Fig. S2c); erythroid                     gene expression profiles in real space, we designed a
Lu et al. Cell Discovery (2021)7:47                                                                                 Page 4 of 17

MERFISH probe library that targets 45 cell-type marker             liver (Fig. 2d, f and Supplementary Fig. S7b). In summary,
genes selected from the scRNA-seq data and 95 niche-               erythroid progenitors lost a neighboring relationship with
associated factors or signaling/marker genes from litera-          AECs, myeloids gained a neighboring relationship with
ture (Supplementary Table S1). We segmented cells with             hepatocytes, and macrophages gained a neighboring
oligo-conjugated wheat germ agglutinin labeling of cell            relationship with SECs in Tet2−/− fetal liver (Supple-
membrane components (Supplementary Fig. S3). The raw               mentary Fig. S8). Previous studies have shown that mac-
images of MERFISH showed distinct RNA foci (Supple-                rophages tended to be surrounded by erythroid cells
mentary Fig. S4). The single-cell RNA copy numbers of              forming an erythroblastic island and to regulate the dif-
132 selected genes (after excluding eight low quality RNA          ferentiation, proliferation, and clearance of erythroid
species; see Materials and Methods) allowed us to identify         cells32, which is consistent with our observation (Fig. 2g, h
eight major cell types using the fetal liver MERFISH data          and Supplementary Fig. S7c). These results indicate that
(Fig. 1c and Supplementary Fig. S5). Note that MERFISH             fetal liver cell types are spatially paired in a non-random
captures a more accurate representation of the proportion          fashion, suggesting cell-cell communications.
of erythroid cells compared to scRNA-seq (Supplemen-
tary Fig. S6), which commonly uses red blood cell lysis            Expression of known niche factors in fetal liver cell types
buffer. The cell types were identified based on the marker            To explore the expression of various HSC niche factors
gene expression levels (Fig. 1d). Population-level RNA             in different cell types, we calculated the enrichment of
copy numbers measured by MERFISH were highly cor-                  gene expression in different cell types over the population-
related with FPKM values from bulk RNA sequencing,                 averaged expression profile in both WT (Fig. 3a) and
with a correlation coefficient of 0.79 (Fig. 1e). Biological        Tet2−/− (Fig. 3b) populations. As expected, cell type
replicates of MERFISH measurements showed a correla-               markers were enriched in the corresponding cell types.
tion coefficient of 0.97 (Fig. 1f). These high correlations         For example, megakaryocyte markers Gnaz, Mrvi1, Vwf,
validated the quality of the MERFISH data. The identified           Timp3, and Mmrn1 were enriched in MKs. We found
eight major cell types were mapped in situ back onto the           many known HSC niche genes such as Fgf1, Icam1, Cspg4,
tissue sections, revealing their spatial organization (Fig. 1g).   Il6, Lepr, Angptl2, Eng, Nes, Tgfb2, Nrp1, Efnb2, Il7r,
                                                                   Pecam1, Epcam, Cdh5, Cxcl12, and Ephb4, Wnt genes
Spatial proximity of pairs of cell types in WT and Tet2−/−         such as Dkk2, Fzd2, Prickle2, Fzd4, Vangl2, Sfrp1, Fzd1,
fetal liver                                                        and Tcf7l1, and Notch genes such as Notch1, Dll1, Jag2,
  To better understand the spatial organization of cells in        Dll4, Notch4, and Notch3 were enriched in WT AECs or
fetal liver, we analyzed the enrichment of pairs of cell           SECs (Fig. 3a); and niche genes such as Fgf2, Cspg4,
types in spatial proximity in WT and Tet2−/− fetal livers          Angptl2, Il6, Lepr, Ndn, Meis1, Il7r, Pecam1, Eng, Efnb2,
(Fig. 2). Here, we defined two cells that are less than 20-         Nes, Nrp1, Fgf1, Pdpn, Tgfb2, Epcam, Cdh5, Igf1, Cxcl12,
μm apart as in a neighborhood, and calculated the prob-            Ephb4, and Egfr, Wnt genes such as Tcf7l1, Fzd3, Prickle2,
ability of cell type pairs in neighborhoods. We then cal-          Fzd2, Fzd4, Sfrp2, Dkk2, Vangl2, Sfrp1, and Fzd1, Notch
culated the enrichment of cell type pairs in spatial               genes such as Jag2, Jag1, Dll1, Notch4, Dll4, Notch1, and
proximity by normalizing this probability to the control           Notch3 were enriched in Tet2−/− AECs or SECs (Fig. 3b).
probability based on random pairing (see Materials and             This suggests that ECs are particularly important for
Methods). The most prominent feature from this spatial             supporting the HSC niche. To further analyze the
proximity analysis was that cells tended to aggregate with         cell–cell communications in the HSC niche, we per-
cells of the same type in situ (Fig. 2a, b). Due to the highly     formed fluorescence-activated cell sorting (FACS) to
enriched spatial self-clustering, neighboring pairs of dif-        enrich the HSCs and integrated scRNA-seq datasets of
ferent cell types were mostly depleted when self pairs are         sorted HSCs and of whole fetal liver (Supplementary Fig.
calculated together with non-self pairs. To further capture        S9a). A cellphone analysis33 of ligand/receptor expression
enrichment just between non-self pairs, we removed the             using our scRNA-seq data showed that HSCs were
self pairs from the analysis (Fig. 2c–f). This allowed us to       potentially closely communicating with ECs (Supple-
capture several enriched pairs of different cell types in          mentary Fig. S10a). Several well characterized Wnt and
spatial proximity. In both WT (Fig. 2c, e) and Tet2−/−             Notch ligand/receptor pairs underlie this potential inter-
(Fig. 2d, f) fetal livers, macrophages were paired with            action (Supplementary Fig. S10b).
erythroid cells; hepatocytes and myeloid cells were paired           Based on the gene expression enrichment analyses,
with erythroid progenitors; hepatocytes were also paired           some niche genes were also enriched in non-EC cell types.
with erythroid cells. In addition, erythroid progenitors           For instance, Cxcl12, previously reported as crucial for
were paired with AECs in WT fetal liver (Fig. 2c, e and            HSC maintenance in bone marrow34–36, was enriched in
Supplementary Fig. S7a); macrophages were paired with              both AECs and hepatocytes. Kitl (Kit ligand), which
SECs, and hepatocytes with myeloid cells in Tet2−/− fetal          supports HSC expansion in fetal liver37, was enriched in
Lu et al. Cell Discovery (2021)7:47 Page 5 of 17
a c e
loid
Er
Enrichment of pairs of cell types (with-self-pairs) in WT FL Enrichment of pairs of cell types (non-self-pairs) in WT FL
Mye
yth
1.2 0 0.3
1 1 0.9 0.6
ro
0.6 0.9
e
AEC AEC 0.3
id
1.2
0.8 0.8
ag
0 1.5
pr
ph
0.9
Log2 (Enrichment)
SEC SEC
Log2 (Enrichment)
0.6 0.6
og
1.8
cro
0.6
en
0.4 MK 0.4
2.1
MK
0.3
Ma
ito
0.2 0.2
2.4
0
r
Hepatocyte Hepatocyte
2.7
2.1
0 0
Macrophage Macrophage
1.8
3
-0.2 -0.2
Hep
3.3
1.5
Myeloid -0.4 Myeloid -0.4
1.2
3.6
-0.6 -0.6
atoc
Erythroid progenitor Erythroid progenitor
0
0.9
-0.8 -0.8
0.3
Erythroid cell Erythroid cell
0.6
yte
-1 -1
0.6
0.3
ll
Erythroid cell
Erythroid cell
AEC
SEC
AEC
SEC
Macrophage
Macrophage
Myeloid
Myeloid
Hepatocyte
Hepatocyte
Erythroid progenitor
Erythroid progenitor
MK
MK
ce
0 0.9
1.2
1.2
oid
0.9
0.6 1.5
0.3 0 1.8
r
AEC yt h
Er
b d f
Enrichment of pairs of cell types (with-self-pairs) in Tet2-/- FL Enrichment of pairs of cell types (non-self-pairs) in Tet2-/- FL Ma
cro
ph
e
1 1 0
yt
0.4
2.8
3.2
0.8
ag
oc
AEC AEC 0.8
2.4
1.2
e
0.8
at
2 1.6
ep
Log2 (Enrichment)
SEC
Log2 (Enrichment)
SEC 0.6 0.6
1.6
H
2
0.4
1.2
MK 0.4 MK
0
0.8
0.2 0.2
0.4
Hepatocyte Hepatocyte
0.4
0 0
0.8
Myeloid
Macrophage -0.2 Macrophage -0.2
0
1.2
Myeloid -0.4 Myeloid -0.4
0.8
1.6
SEC
-0.6 -0.6
0.4
Erythroid progenitor Erythroid progenitor
2
-0.8 -0.8
0
Erythroid cell Erythroid cell
0
2
-1 -1
0.4
1.6
r
Erythroid cell
AEC
SEC
Macrophage
Myeloid
Erythroid cell
AEC
SEC
Macrophage
Myeloid
Hepatocyte
Erythroid progenitor
MK
Hepatocyte
Erythroid progenitor
MK
Er 0.8
ito
en
1.2
yth 1.2
rog
0.8
roi 0.4
0 2
1.6
p
dc
ell hr oid
t
Ery
g h
Cell Type Cell Type Cell Type Cell Type
AEC AEC AEC AEC
SEC SEC SEC SEC
MK MK MK MK
Hepatocyte Hepatocyte Hepatocyte Hepatocyte
Macrophage Macrophage Macrophage Macrophage
Myeloid Myeloid Myeloid Myeloid
Erythroid progenitor Erythroid progenitor Erythroid progenitor Erythroid progenitor
Erythroid cell Erythroid cell Erythroid cell Erythroid cell
30 μm 15 μm 30 μm 15 μm
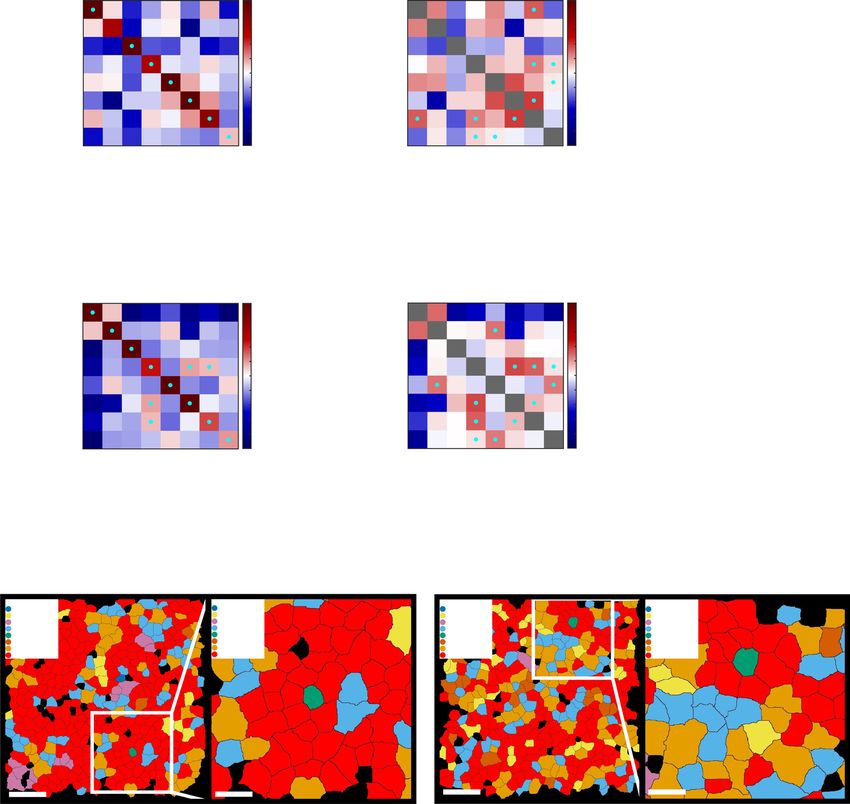
Fig. 2 Enrichment of pairs of cell types in spatial proximity in WT and Tet2−/− fetal livers. a, b The enrichment folds of pairs of cell types in
spatial proximity with self-pairs in WT (a) and Tet2−/− (b) fetal livers. c, d The enrichment folds of pairs of cell types in spatial proximity without self-
pairs in WT (c) and Tet2−/− (d) fetal livers. The color bars are scaled to ±1 (a–d) with red indicating enrichment and blue indicating depletion. Cyan
dots represent P values < 0.01 for positive enrichment with false discovery rate correction. e, f The chord diagram plots of significantly enriched pairs
in WT (e) and Tet2−/− (f) fetal livers. g, h MERFISH cell type plots of a central macrophage (green) in an erythroid island (red). Cell types were
determined using MERFISH data and mapped in situ (left panels). A fourfold magnified image of the region in the white box is shown on the right.
AEC, arterial endothelial cell; SEC, sinusoidal endothelial cell; MK, megakaryocyte.
hepatocytes. Egr1, known to be expressed in HSCs and to that hepatocytes were paired with erythroid progenitors in
coordinate HSC division and migration38, was enriched in space (Fig. 2c–f), Kitl and Kit were enriched in hepato-
hepatocytes (Fig. 3a, b). A full list of gene expression cytes and erythroid progenitors, respectively (Fig. 3a, b).
enrichments in different cell types is provided in Sup- In situ maps further confirmed that Kitl-positive hepa-
plementary Table S2. One explanation to these observa- tocytes were usually near kit-positive erythroid progenitor
tions is that the different cell types offer the cells (Fig. 3c, d), suggesting ligand–receptor commu-
corresponding supportive molecules for HSC regulation. nication between the two cell types.
However, these findings also raise the possibility that We also observed that in WT fetal liver Notch1 was
these niche genes may have additional non-HSC functions enriched in AECs, SECs, and myeloid cells; Notch2 was
within the corresponding cell types. Indeed, as we found enriched in myeloid cells; Notch3 was enriched in AECs;Lu et al. Cell Discovery (2021)7:47 Page 6 of 17
a Gene expression in each cluster in WT
Cell-type genes Niche genes Wnt genes Notch genes Other
Log2 enrichment of expression
AEC 4
SEC
MK 2
Hepatocyte
0
Macrophage
Myeloid -2
Erythroid progenitor
Erythroid cell -4
Mertk
Pou2af1
Hc
Pzp
Adgre1
Tfrc
Icam1
Fzd8
Fzd2
Fzd3
Fzd4
Fzd7
Fzd1
Fzd5
Tcf7l1
Tcf7l2
Dll1
Dll4
Mrc1
Pdgfra
Mrvi1
Gpd1
Tmem56
Tcf7
Lef1
Fbxw7
Cdh11
Ctnnal1
Elk3
Fstl1
Col4a1
Angpt1
Flt4
Clec14a
Tek
Vwf
Sardh
Cxadr
Slc25a37
Meis1
Igf1
Gfap
Nrp1
Pecam1
Jag1
Notch2
Notch1
Jag2
Notch4
Notch3
Mki67
Kit
Tox
Lyve1
Meis2
Flt3
Gnaz
Cd34
Cspg4
Angptl2
Kitl
Il7r
Cdh5
Ephb4
Sfrp2
Sfrp1
Celsr2
Ep300
Cd48
Runx1
Olr1
B4galt6
Procr
Hoxb4
Cd93
Stab2
Mmrn1
Rassf4
Fam46c
Tmod1
Egr1
Efnb2
Epcam
Mpl
Bmp7
Vangl2
Bmp2
Bmp5
Lox
Vcam1
Satb1
Sgms2
Slamf1
Abcb4
Ndn
Pdpn
Egfr
Nkd2
Gca
Kdr
Proz
E2f2
Il6
Tgfb2
Cxcl12
Prickle2
Rbpj
Arsb
Hgf
Eng
Timp3
Abcc3
Sdc3
Ammecr1
Nes
Dkk2
Dkk3
Eif3a
Vav1
Mecom
Itga2b
Podxl
Tet1
Tet2
Fgf1
Fgf2
Lepr
Axin2
Maml1
Myh10
Itgam
Mpp1
b Gene expression in each cluster in Tet2-/-
Cell-type genes Niche genes Wnt genes Notch genes Other
5
Log2 enrichment of expression
AEC
SEC
MK
Hepatocyte
0
Macrophage
Myeloid
Erythroid progenitor
Erythroid cell
-5
Mertk
Hc
Pzp
Adgre1
Tfrc
Icam1
Fzd8
Fzd7
Tcf7l1
Fzd3
Fzd2
Fzd4
Tcf7l2
Fzd1
Fzd5
Pou2af1
Dll1
Dll4
Mrc1
Pdgfra
Mrvi1
Gpd1
Tmem56
Lef1
Tcf7
Fbxw7
Cdh11
Elk3
Ctnnal1
Fstl1
Col4a1
Flt4
Clec14a
Tek
Vwf
Sardh
Cxadr
Slc25a37
Gfap
Meis1
Angpt1
Pecam1
Nrp1
Igf1
Jag2
Jag1
Notch2
Notch4
Notch1
Notch3
Mki67
Kit
Tox
Lyve1
Meis2
Flt3
Gnaz
Cd34
Cspg4
Angptl2
Il7r
Cdh5
Kitl
Ephb4
Sfrp2
Sfrp1
Celsr2
Ep300
Cd48
Runx1
B4galt6
Olr1
Hoxb4
Procr
Cd93
Stab2
Mmrn1
Rassf4
Fam46c
Tmod1
Efnb2
Epcam
Egr1
Mpl
Vangl2
Bmp2
Bmp5
Bmp7
Lox
Slamf1
Satb1
Sgms2
Vcam1
Abcb4
Ndn
Pdpn
Egfr
Nkd2
Gca
Kdr
Proz
E2f2
Il6
Tgfb2
Cxcl12
Prickle2
Rbpj
Hgf
Arsb
Timp3
Abcc3
Sdc3
Ammecr1
Eng
Nes
Dkk3
Dkk2
Vav1
Mecom
Eif3a
Itga2b
Podxl
Fgf2
Tet1
Tet2
Lepr
Fgf1
Axin2
Maml1
Itgam
Mpp1
Myh10
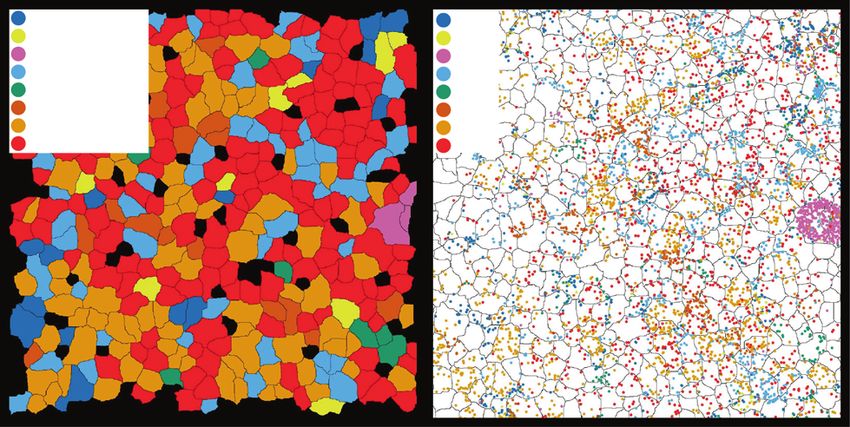
c d
Cell Type Cell Type
AEC
SEC
AEC
SEC
Kit Kit
MK
Hepatocyte
MK
Hepatocyte
Kitl Kitl
Macrophage Macrophage
Myeloid Myeloid
Erythroid progenitor Erythroid progenitor
Erythroid cell Erythroid cell
30 μm 15 μm 30 μm 15 μm
Fig. 3 Gene expression enrichment in different cell types in WT and Tet2−/− fetal livers. a, b Gene expression enrichment profiles of probed
genes in different cell types in WT (a) and Tet2−/− (b) fetal livers. All genes used in the MERFISH analysis are shown along the x-axes. Log2 enrichment
of expression for each gene is shown by a red/blue color scale (on the right) with darker red indicating a stronger enrichment and darker blue a
stronger depletion. The niche genes (dark violet), Wnt genes (deep pink), Notch genes (cyan), and other genes (magenta) were ordered based on
hierarchical clustering in each category. All the log2 enrichment values of the highlighted niche/Wnt/Notch genes are larger than 1. AEC, arterial
endothelial cell; SEC, sinusoidal endothelial cell; MK, megakaryocyte. c, d An example of Kitl positive hepatocytes with nearby Kit positive erythroid
progenitors. Cell types were determined using MERFISH data and mapped in situ (c). Individual mRNA molecules from MERFISH were plotted on top
of the segmented cell image for Kitl (cyan dots) and Kit (yellow dots) (d). The right panels in c and d are fourfold magnified views of the white boxed
regions in the left panels.
Notch4 was enriched in AECs, SECs, and MKs (Fig. 3a). In with HSCs in space and the molecular and cellular
Tet2−/− fetal liver, Notch1 was enriched in AECs, SECs, compositions of the HSC niche. To tackle these questions,
and myeloid cells; Notch2 was enriched in hepatocytes we set out to identify HSCs in the MERFISH data. To
and myeloid cells; Notch3 was enriched in AECs and select the specific markers of HSCs, we identified cell
SECs; Notch4 was enriched in SECs and MKs (Fig. 3b). types based on known marker genes from our integrated
These suggest that different Notch genes may have cell HSC and whole fetal liver scRNA-seq datasets (Supple-
type-specific functions or cell type biases. mentary Fig. S9b). We found that Mecom was specifically
and highly expressed in the HSC groups (Supplementary
Identification of HSCs and characterization of the HSC Fig. S9c). In addition, Kit was expressed in HSCs (Sup-
niches in WT and Tet2−/− fetal livers by MERFISH plementary Fig. S9c). This agrees with previous studies
Although the cellphone analysis of scRNA-seq data showing that Mecom was expressed in 60% of mouse
suggested that ECs communicate with HSCs (Supple- long-term HSCs and at high levels in human hemato-
mentary Fig. S10a), this sequencing-based analysis only poietic stem and progenitor cells39,40, and was regarded as
provides the potential molecular interactions, but not the critical for long-term HSC function41. Kit was found
direct spatial information. Thus, it cannot directly mea- essential for quiescent HSC maintenance42, and mice
sure the frequency at which ECs are physically associated lacking Kit showed hematopoietic defects and perinatalLu et al. Cell Discovery (2021)7:47 Page 7 of 17
a b
Cell Type Cell Type
AEC 30 μm AEC 15 μm Mecom 30 μm Mecom 15 μm
SEC
MK
SEC
MK
Kit Kit
Hepatocyte Hepatocyte Pecam1 Pecam1
Macrophage Macrophage
Myeloid Myeloid Fstl1 Fstl1
Erythroid progenitor Erythroid progenitor
Erythroid cell Erythroid cell
HSC
HSC
c d e
Cell Type
Fraction of cell types (%) WT HSC niche vs. non-niche cells DEGs
AEC
SEC 15
WT niche
-Log10(Adjusted p-value)
MK
Hepatocyte Cd93
Macrophage
Myeloid
Erythroid progenitor
Erythroid cell
Tet2-/- niche 10
Efnb2
Dll4
WT total Mecom
5 Notch3
Tet2-/- total
20 μm
HSC
30 μm 0
100
10
20
30
40
50
60
70
80
90
-2 -1 0 1 2
0
Log2(Fold-change) [niche/non-niche]
f g h
Tet2-/- HSC niche vs. non-niche cell DEGs HSC number in E14.5 FL (p 0.0 ) WT vs. Tet2-/- HSC niche DEGs
80 15
HSC number per 10,000 cells
1.5
-Log10(Adjusted p-value)
-Log10(Adjusted p-value)
Notch3
Dkk3
Cd93
60 Efnb2 Fzd1
Fstl1 Mecom
10 Sfrp1Fstl1 Nrp1
Nrp1 Sfrp1
1.0 Vangl2 Fzd7 Runx1
Notch1
Cxcl12 Notch3 Cdh11
40 Prickle2 Nkd2
Notch1 Kitl
Vangl2 Il6 Fgf2
Cdh5
Cxcl12 5
20 Clec14a
0.5 Fzd8 Pzp
Dll4
Fzd2
Cdh11 Igf1
0 0
-2 -1 0 1 2 3 0.0 -3 -2 -1 0 1 2 3
WT Tet2-/-
Log2(Fold-change) [niche/non-niche] Log2(Fold-change)[WT/Tet2-/-]
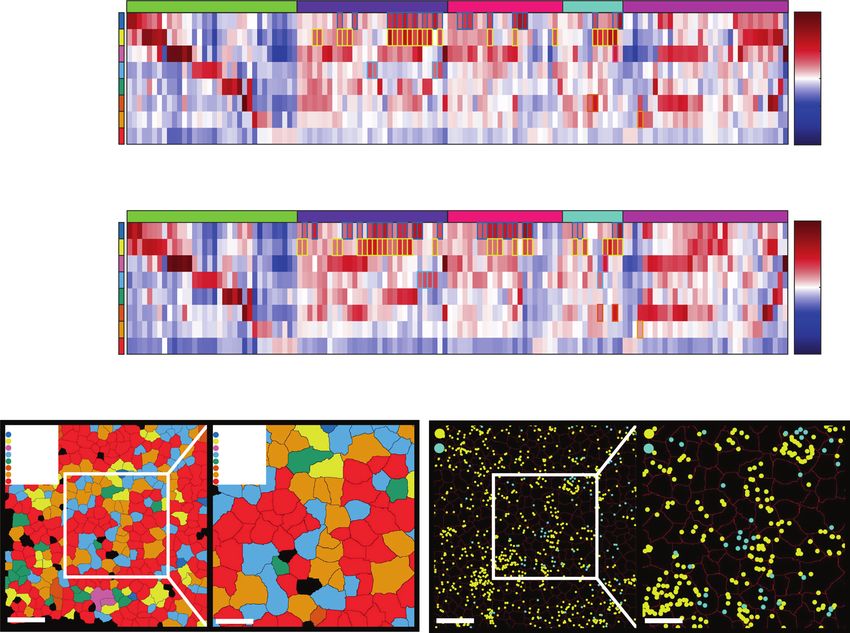
Fig. 4 Features of the HSC niche by MERFISH analysis. a An example of an HSC embedded in a vascular wall seen by MERFISH imaging, cell types
were determined and mapped in situ (left panel). b Individual mRNA molecule FISH signals were visualized for Mecom (green dots), Kit (yellow dots),
Fstl1 (magenta dots), and Pecam1 (cyan dots) in situ. c An example of an HSC niche identified by MERFISH imaging. The niche area is marked by a
white circle with a 20-μm radius. The cell boundaries were segmented based on the membrane labeling with wheat germ agglutinin (WGA). The
right panels in a and b are fourfold magnified views of the white boxed regions in the left panels. The HSC boundary is shown in red. d The cell type
percentages of the HSC niche and of the total cell population were calculated for WT and Tet2−/− fetal livers (WT niche: n = 254 cells; Tet2−/− niche:
n = 550 cells; WT overall: n = 112,392 cells; Tet2−/− overall: n = 137,628 cells). The cell type color scheme of d is the same as a and c. AEC, arterial
endothelial cell; SEC, sinusoidal endothelial cell; MK, megakaryocyte. e, f The DEGs between the HSC niche and non-niche in WT (e) and Tet2−/− (f)
fetal livers. g HSCs were significantly increased in Tet2−/− (n = 3 biological replicates, 0.848 ± 0.183) compared with WT (n = 4 biological replicates,
0.334 ± 0.301) in E14.5 fetal livers (unpaired t-test with Welch’s correction, P = 0.04). h The DEGs between the WT and Tet2−/− HSC niches. In e, f, and
h, the horizontal dotted line represents an adjusted P value = 0.05 using a Wilcoxon rank-sum test with false discovery rate correction. The vertical
lines represent a fold change = 2. Blue dots are Notch pathway genes, red dots are Wnt pathway genes, purple dots are vasculature genes, and black
dots are other genes. All the labeled dots are reproducible significant genes.
death43. Thus we defined HSCs as positive for Kit and based on MERFISH imaging. However, this may be an
Mecom expression, and used this criteria to identify HSCs underestimate given that our tissue section largely con-
in MERFISH data (Supplementary Fig. S5). tained a single layer of cells, and an EC might be in
To characterize the HSC niche in situ, we measured the contact with an observed HSC but be excluded from the
cell type compositions and gene expression features in section. In some instances, HSCs were identified in large
HSC niches in their native spatial context by MERFISH. regions consisting of many AECs, likely forming a central
Approximately 53% and 75% of HSCs in WT and Tet2−/− vein (Fig. 4a, b). We defined an HSC niche as a 20-μm-
fetal livers, respectively, were in direct contact with ECs, radius area centered at an HSC (Fig. 4c). A comparisonLu et al. Cell Discovery (2021)7:47 Page 8 of 17 between the proportion of ECs within HSC niches vs the niche, including Notch1, Notch3, Cxcl12, Kitl, Fgf2, and Il6 proportion of ECs in the entire cell population showed an (Fig. 4h). Notch signaling has been shown to increase enrichment of ECs in the HSC niche (Fig. 4d). Specifically, stem cell numbers in mouse bone marrow47,48. Cxcl12 is 8% of the cells in the WT HSC niche were ECs compared critical for HSC maintenance: HSCs were reduced in to 5% overall (21/254 vs 5,876/112,392, P = 0.0422). This number and became more quiescent in the absence of enrichment of ECs was even more dramatic for the Tet2−/− CXCL12-abundant reticular cells34–36. KIT-ligand (Kitl) HSC niches, where 28% of the cells were ECs compared to induces HSC maintenance in the bone marrow49 and 9% of cells being ECs in the entire population (153/550 vs contributes to HSC expansion in the mouse fetal liver37. 12,309/137,628, P < 0.001). In addition, erythroid pro- FGF-2 stimulates HSC proliferation in vivo through Kitl genitors were increased in the overall population in the signaling and stromal cell expansion50. Il6 signaling pro- Tet2−/− fetal liver in comparison to WT (19% vs 10%, motes HSPC proliferation in mice51, and has a combina- 26,627/137,628 vs 11,460/112,392, P < 0.001). torial effect with Notch activation on hematopoietic We further investigated the DEGs in HSC niches vs cells52. In summary, our results suggest that loss of Tet2 outside of the niches. The endothelial arterial marker, leads to an increase of HSCs in fetal liver due to the Ephrin-B2 (Efnb2) showed increased expression in both upregulation of Wnt, Notch, and other niche factors that WT and Tet2−/− HSC niches in comparison to cells support HSC proliferation. outside of the niches (Fig. 4e, f). Other endothelial mar- kers highly expressed in the Tet2−/− HSC niche included Distinct signaling compositions of AECs and SECs in HSC Fstl1, Nrp1, Cdh5, and Clec14a (Fig. 4f). The Notch signal niches pathway genes Notch3 and Dll4 were significantly upre- Previous studies suggested that both AECs and SECs gulated in both WT and Tet2−/− HSC niches (Fig. 4e, f). were essential for HSC regeneration and maintenance5,53. Based on the MERFISH results, Tet2−/− mice exhibited To further identify the specific roles of AECs and SECs, an increased number of HSCs when compared with WT we first analyzed their DEGs (Fig. 5a, b). In both WT and (Fig. 4g). This is in agreement with some prior studies Tet2−/− fetal livers, SECs expressed specific endothelial showing that LSK and CD150+ HSCs were increased in markers such as Flt4, Stab2, Kdr, Cdh5, Clec14a, Tek, and extramedullary hematopoiesis of adult Tet2−/− mice18, Lyve1, whereas AECs specifically expressed other endo- but does not support some other studies reporting that thelial markers such as Fstl1 and Pdgfra. In addition, SECs HSC abundance in Tet2−/− fetal livers did not change17. from both WT and Tet2−/− fetal livers expressed the The increased HSC number we observed in Tet2−/− fetal Notch pathway genes Notch4, Dll1 and Dll4, and the livers may be caused by changes in the HSC niche. niche factor Lepr, whereas AECs expressed Notch3 and We next compared the DEGs in the HSC niches in Cxcl12. Tet2−/− vs WT fetal livers (Fig. 4h). Most notably, several The analysis above included AECs and SECs inside and Wnt signaling pathway related genes were significantly outside of HSC niches. To explore the co-expression of upregulated in the Tet2−/− HSC niche. This included various niche factors among cells within HSC niches, we canonical Wnt Frizzled (Fzd) receptors Fzd1, Fzd7, and calculated the correlation coefficients of pairs of genes co- Fzd8. In contrast, Fzd2, Fzd3, Fzd4, and Fzd5, the expressed in the same HSC niche cells in the WT (Fig. 5c) downstream signaling gene Axin2, and the responsive and Tet2−/− (Fig. 5d) fetal livers using the MERFISH data. transcription factors Lef1, Tcf7, Tcf7l1, and Tcf7l2 were Note the scRNA-seq procedure removes a large popula- not increased. The non-canonical Wnt signaling genes tion of ECs in fetal liver (Supplementary Fig. S6), and has Vangl2 and Prickle2 also showed increases in expression, lower cell number throughput than MERFISH in general but not Celsr2. In addition to Wnt signaling agonists, (Fig. 1a with 136 ECs out of 7,635 cells in total and Fig. 1c other upregulated genes include Wnt antagonists, such as with 2,546 ECs out of 40,864 cells in total). Besides, to Nkd2 and Sfrp1, but not Sfrp2. Interestingly, the most analyze the gene co-expression in niche requires the cel- significantly upregulated gene in the Tet2−/− HSC niche lular spatial distribution information, which is not pre- was a member of the dickkopf family, Dkk3, while there served by scRNA-seq, but by MERFISH. We found that in was no enrichment of Dkk2 expression. Whereas DKK2 WT HSC niches, niche genes Nes, Nrp1, Cxcl12, Lepr, binds to LRP5/6 and inhibits the interaction of Wnt to the Bmp5, Tet2, Cspg4, Angpt1, and Epcam, Wnt and Notch Frizzled receptors44, DKK3 is the most divergent member signaling genes Dll4, Notch3, Sfrp1, Jag1, Fzd1, Tcf7l2, and of the DKK family and does not bind to LRP5/645. Rather, Ep300 were correlated with AEC, but not SEC, marker both positive and negative roles have been shown for genes. In contrast, niche genes Tgfb2, Il7r, Pdpn, Meis1, DKK3 in Wnt signaling45,46. Mpl, Ephb4, Eng, and Tet1, and Wnt and Notch signaling In addition to Wnt signaling, several other genes genes Prickle2, Dll1, Rbpj, and Notch4 were correlated important for cell proliferation were also upregulated in with SEC, but not AEC, marker genes (Fig. 5c). In Tet2−/− the Tet2−/− HSC niche in comparison to the WT HSC HSC niches, niche genes Igf1, Meis1, Angptl2, Cspg4, Fgf2,
Lu et al. Cell Discovery (2021)7:47 Page 9 of 17
a WT AEC vs. SEC DEGs
b Tet2-/- AEC vs. SEC DEGs
250 250
-Log10(Adjusted p-value)
-Log10(Adjusted p-value)
200 Stab2 Kdr 200 Lyve1 Cd93 Fstl1
200 Flt4 Col4a1 200 Stab2 Tek
Kdr Flt4 Cdh5
Sfrp1
Cxcl12
Pdgfra
Mrc1 Fzd1 Notch3
Clec14a Myh10
150 Clec14a Pecam1
150 Mrc1 Notch2
Fstl1 Dll4
Cd93 Sfrp1 Bmp2
100 Meis2 Lyve1 100
Dll4 Cdh5 Notch4 Angptl2 Fzd2
Notch4 Tek Cxcl12 Fzd1 Mecom Prickle2 Mrvi1 Sfrp2
50 Elk3 50 Lepr Dll1 Igf1
Lepr Bmp2 Pdgfra Notch3
Bmp5 Dkk2
Dll1 Hgf
0 0
-4 -2 0 2 4 -4 -2 0 2 4
Log2(Fold-change) [AEC/SEC] Log2(Fold-change) [AEC/SEC]
c WT niche
1
Correlation coefficients
0.8
0.6
0.4
0.2
0
Dll4
Dll1
Lef1
Tcf7
Jag1
Nrp1
Pecam1
Sfrp1
Cdh5
Efnb2
Bmp5
Bmp2
Bmp7
Cxcl12
Nes
Eng
Lepr
Tet2
Tet1
Fgf1
Fzd1
Fzd2
Meis1
Cspg4
Ep300
Ephb4
Il7r
Epcam
Mpl
Egfr
Ndn
Prickle2
Rbpj
Tcf7l2
Notch3
Angpt1
Notch4
Notch2
Pdpn
Nkd2
Tgfb2
Il6
d Tet2-/- niche
1
Correlation coefficients
0.8
0.6
0.4
0.2
0
Maml1
Dll4
Dll1
Lef1
Gfap
Jag2
Tcf7
Jag1
Sfrp1
Sfrp2
Bmp7
Eng
Fgf2
Tet2
Fzd1
Fzd2
Fzd7
Fzd4
Fzd8
Fzd3
Meis1
Cspg4
Vangl2
Kitl
Ndn
Egfr
Rbpj
Prickle2
Dkk3
Dkk2
Tcf7l1
Tcf7l2
Icam1
Fbxw7
Notch3
Notch2
Angpt1
Notch4
Igf1
Angptl2
Egr1
Pdpn
Tgfb2
Fig. 5 AEC and SEC contribute different molecules to WT and Tet2−/− HSC niche. a, b The DEGs of AECs vs SECs in WT (a) and Tet2−/− (b) fetal
livers by MERFISH. The horizontal dotted line represents an adjusted P value = 0.05 using a Wilcoxon rank-sum test with false discovery rate
correction. The vertical lines represent a fold change = 2. Blue dots are Notch pathway genes, red dots are Wnt pathway genes, green dots are niche
factors, purple dots are vasculature genes, and black dots are other genes. All the labeled dots are reproducible significant genes. c, d Correlation
coefficients of niche genes with cell type markers in WT (c) and Tet2−/− (d) HSC niches. The genes listed in c and d all showed significant correlations
(R > 0.1, P < 0.05) with the corresponding cell type markers (dark blue = AEC, yellow = SEC, light blue = hepatocyte, green = macrophage, pink =
megakaryocyte). The P values were corrected using false discovery rate.
Ndn, Egfr, Gfap, Tet2, and Angpt1, and Wnt and Notch Pdpn, and Notch signaling genes Dll4 and Jag2 were
signaling genes Sfrp1, Notch3, Fzd1, Sfrp2, Fzd2, Vangl2, correlated with SEC marker genes (Fig. 5d). Note that the
Notch2, Tcf7l1, Fzd7, Tcf7l2, Fzd4, Fbxw7, Fzd8, and Rbpj expression of Tet2 mRNA in the Tet2−/− mice is expected
were correlated with AEC marker genes; niche gene based on the knockout design that removes only exons 8Lu et al. Cell Discovery (2021)7:47 Page 10 of 17
through 1154. These results indicate that AEC and SEC the visualization of WGA binding pattern in a manner
may contribute different niche molecules to HSC niche in compatible with MERFISH tissue clearing, and success-
fetal liver. fully segmented single cells in fetal liver tissue sections
We also observed several niche or signaling genes (Supplementary Fig. S3). We expect this procedure to be
correlated with markers of other cell types in the HSC widely applicable to many tissue types, and to enable
niche. For example, in WT HSC niches, Egfr, Notch2, and MERFISH single cell analyses of tissues with tightly
Fzd2 were co-expressed with hepatocyte marker genes; packed cells.
Fgf1, Cdh5, Efnb2, Bmp2, Bmp7, and Tcf7 were co- Consistent with prior work10, we found that fetal liver
expressed with macrophage marker genes; and Il6, Nkd2, HSCs highly colocalize with ECs. Extending Khan et al.’s
Pecam1, Lef1, and Ndn were co-expressed with mega- observation that Efnb2-positive portal vessels were abut-
karyocyte marker genes (Fig. 5c). In Tet2−/− HSC niches, ting Nestin+ cells, which were enriched for fetal liver HSC
Kitl, Egr1, Dkk3, Bmp7, Tcf7, Icam1, and Fzd3 were co- niche and expansion factors10, we discovered that Efnb2 is
expressed with hepatocyte marker genes; Jag1, Lef1, more highly expressed in the fetal liver HSC niche than
Dkk2, Prickle2, Dll1, Notch4, Maml1, Tgfb2, and Eng were outside of the niche. Not elucidated in previous studies,
co-expressed with megakaryocyte marker genes (Fig. 5d). we revealed that the majority of HSCs are directly
A full list of correlations between niche/signaling genes touching at least one EC. Furthermore, we demonstrated
and cell type marker genes is provided in Supplementary that both AECs and SECs can be present in the HSC
Table S3. These results suggest that cell types other than niches, with differences in transcripts enriched in these
ECs may also provide additional supporting molecules to two cell types. Dll4, in particular, is enriched in the fetal
the HSC niche. liver HSC niche compared to non-niche cells (Fig. 4e, f).
This is consistent with a prior report that vascular
Discussion DLL4 acted as a key Notch ligand that controlled early
In summary, using MERFISH and scRNA-seq we hematopoietic differentiation58 and that Notch signaling
showed that fetal livers display intricate cellular and promoted stem cell self-renewal and inhibited differ-
molecular organizations, indicating potential cell–cell entiation47. Interestingly Dll4 is associated with AECs in
communications and collaborations. HSCs locate pre- WT niche (Fig. 5c), but with SECs in Tet2−/− niche (Fig.
dominantly in endothelial niches and the majority of 5d). This switch may underlie the changed HSC behavior
HSCs directly contact one or more ECs (AECs and/or upon Tet2 knockout. Fzd1, which is associated with AECs
SECs). AECs and SECs possess different molecules and but not with SECs (Fig. 5c, d), is a specific receptor of
may establish distinct functions for HSCs. Other cell types Wnt3a which is known to be particularly important for
may also contribute to HSC regulation, as well as reg- regulating HSC fate59,60. This suggests a specific impor-
ulating each other (e.g., hepatocytes may regulate ery- tance of AECs to provide Fzd1 in the niche. Experimental
throid progenitor development). Loss of Tet2 led to an validation of our findings will require the development of
increased number of HSCs and an increased expression of AEC- and SEC-specific transgenic Cre lines to specifically
Wnt and Notch signaling genes as well as other niche knock out the niche factor genes from the appropriate cell
factors within the HSC niches, which potentially drives population to observe their influence on HSC functions.
the HSC expansion. We also illustrated the expression of other genes known
Single cell in situ transcriptomics provides a valuable to influence HSCs as being correlated with specific cell
tool to answer many long-standing questions in biology types. Taken together, our MERFISH findings suggest that
that require an appreciation of tissue architecture. Pre- many different types of cells contribute various signaling
vious studies using high throughput RNA smFISH-like components to the HSC niche.
techniques, including STARmap55, seqFISH+56, or Given the importance of the epigenetic modifier Tet2 to
MERFISH27–29, often dealt with tissues with well- HSC development, we evaluated the HSC niche of Tet2−/−
separated cell bodies (e.g., brain tissue) or cell lines fetal liver. Kunimoto et al. showed that disruption of Tet2
grown in vitro at densities that minimized cell–cell con- enhanced the self-renewal and long-term repopulating
tact. Under these conditions, it is possible to perform cell capacity of fetal liver HSCs in vivo17. We found increased
segmentation by Nissl staining or RNA density. In con- numbers of HSCs by MERFISH in the Tet2−/− fetal liver,
trast, the fetal liver contains many closely packed cells. which can be explained by both HSC cell-autonomous and
Thus, to effectively detect cell boundary and segment non-cell-autonomous mechanisms. TET2 is an epigenetic
single cells in fetal liver tissue sections is challenging. In regulator responsible for the hydroxylation of 5mCs to 5-
our study, we used WGA, which marks the plasma hmCs, leading to DNA demethylation15,61,62. Loss of TET2
membrane of eukaryotic cells by binding to the N-acet- leads to both direct and indirect changes in gene expres-
ylglucosamine of glycoproteins and glycolipids57. More- sion63,64. Use of conditional knockouts and competitive
over, we attached WGA to an oligonucleotide to facilitate bone marrow transplantation assays has shown that Tet2Lu et al. Cell Discovery (2021)7:47 Page 11 of 17
deletion augments the hematopoietic stem/progenitor cell All animal experiments were approved by the Institutional
population in a cell-autonomous manner18,54,65,66. In addi- Animal Care and Use Committee of Yale University.
tion, loss of Tet2 from bone marrow mesenchymal stromal Pregnant females were euthanized by isoflurane inhala-
cells also augments BMSC self-renewal and proliferation, tion and cervical dislocation. E14.5 fetal livers were dis-
which enhances their hematopoietic supportive capacity19. sected from embryos in cold dulbecco’s phosphate-
Similarly, loss of Tet2 leads to an increase of the EC buffered saline (DPBS) and embedded in Tissue-Tek
population in fetal liver (Fig. 4d), which may promote HSC Cryomold (VWR, 25608-916) with optimal cutting tem-
expansion in a non-cell-autonomous manner. Therefore, perature compound (Tissue-Tek O.C.T.; VWR, 25608-
Tet2 deficiency may affect HSC functions in cell- 930). Frozen tissue blocks were stored at −80 °C before
autonomous and non-cell-autonomous manners. cryosection. E14.5 fetal liver frozen blocks were equili-
Khan et al. suggested that WT HSCs did not expand by brated to −15 °C for 1 h and then cryosectioned into 10-
increasing Kitl, Angptl2, or Igf2 in Nestin+ HSC-niche μm-thick slices using a Leica CM1950 machine at −15 °C.
cells, because these factors were expressed at a similar Tissue sections were post-fixed immediately with 4% PFA
level at E12, E13, and E14.5 in fetal liver10. However, in (Electron Microscopy Sciences, 15700) in DPBS while on
the Tet2−/− setting, we found that HSC expansion factors salinized and poly-L-lysine (Millipore, 2913997) treated
such as Cxcl12, Kitl, Fgf2, and Il6 are increased when coverslips (Bioptechs, 40 mm Coverslip #1.5Thick) for
compared with WT fetal liver. In addition, we observed 20 min at room temperature. After washing out the PFA
several Wnt and Notch signaling genes were strongly with DPBS, tissue sections were stored in 100% ethanol at
enriched in the Tet2−/− HSC niche compared to non- −20 °C. Data were collected from four WT fetal livers at
niche cells and compared to the WT HSC niche. The E14.5 and two Tet2 knockout fetal livers at E14.5.
complex and nuanced native microenvironment that we
elucidated with MERFISH is difficult to recapitulate by MERFISH probe design and construction
in vitro coculture systems. We look forward to the gen- Primary probes of MERFISH were designed using the
eration of advanced in vitro systems where pure HSC and 16-bit Hamming-distance-4 code with 140 barcodes as
niche cells can be precisely isolated and cultured in order previously described27–29. The 140-gene library con-
to help functionally test some of the niche interactions tained 45 cell type marker genes from our 10× Genomics
learned by MERFISH. Deletion of each of the identified single cell sequencing data of E14.5 fetal liver and 95 HSC
niche factor genes in the Tet2 null setting would be niche-associated genes from the literature. We chose 98
necessary to validate their influence on fetal liver HSC of the library gene isoforms that were long enough to
functions. In addition, we report that Kitl-positive hepa- construct 48 target regions using a non-overlap design
tocytes are usually adjacent to Kit-positive erythroid and 42 of the library gene isoforms with an overlap design
progenitor cells, which suggests ligand-receptor commu- as previously published70. Each MERFISH oligo had a 30-
nications between the two cell types. This observation of a nt targeting region, three 20-nt readout regions, and two
potential hematopoietic signaling function of hepatocytes 20-nt priming regions. The template oligonucleotide
is consistent with previous studies that Kitl-expressing sequences for MERFISH were listed in Supplementary
fetal liver hepatoblasts support the expansion of Kit- Table S4. The gene FPKM values of MERFISH library
expressing HSCs and potential survival or expansion of genes ranged from 0.16 to 794 based on matched bulk
hematopoietic progenitors37. Functional data also show RNA-sequencing.
that hepatoblast-depleted mouse embryos display a
decrease in Kitl gene expression and a reduction of the Primary probe synthesis
Kit+ HSCs and hematopoietic progenitors67,68. Previous The primary probes were constructed from a complex
reports also show that hepatocyte growth factors can oligonucleotide pool that was ordered from CustomArray,
directly control erythroid progenitor proliferation and Genscript27–29. Primary probes were synthesized via lim-
differentiation69. Using MERFISH to further refine the ited cycle PCR to create the templates for in vitro tran-
gene expression map of the HSC microenvironment scription (The forward PCR primer (with T7 promoter)
under different physiological or pathological conditions sequence is GCCGTACGGATAATACGACTCACTAT
will improve our understanding of HSC expansion and AGGG GCGTCGTTATGGTGCAACGT, and the reverse
renewal and of ways to manipulate them. PCR primer sequence is TTGTCGCACGTTCGGTGT
CG). These templates were converted into RNA through
Materials and methods in vitro transcription, then converted back to single
Animal preparation and tissue sectioning stranded DNA using reverse transcription (The reverse
E14.5 pregnant female C57BL/6 WT and Tet2−/− mice transcription primer sequence is TTGTCGCACGTT
were used for fetal liver preparation. All mice were CGGTGTCG). RNA templates were removed from the
maintained under 12 h light/12 h darkness cycles at 22 °C. DNA oligos via alkaline hydrolysis. Finally, the DNALu et al. Cell Discovery (2021)7:47 Page 12 of 17
oligos were purified through a Zymo column and con- Ribonucleoside vanadyl complexes (Sigma-Aldrich,
centrated via vacuum drying. R3380) in 2× saline sodium citrate (2× SSC) (Invitrogen,
AM9765). Tissue samples were then stained with primary
Silanization of coverslips probes in primary hybridization buffer, containing 24-28
We coated the coverslips with a silane layer containing μM primary probes, 50% (vol/vol) formamide, 0.1% yeast
an allyl moiety to stabilize a polyacrylamide (PA) film tRNA (Invitrogen, 1885325), 1% (vol/vol) murine RNase
introduced in the later “Tissue embedding and clearing” inhibitor (NEB, M0314S), 10% (wt/vol) dextran sulfate
step29. Briefly, the coverslips were cleaned in a 1:1 mixture (Millipore, S4030), and 2 μM anchor probe (a 15-nt
of 37% (vol/vol) HCl and methanol for 30 min at room sequence of alternating dT and thymidine-locked nucleic
temperature. Then, coverslips were rinsed in deionized acid with a 5′ -acrydite modification) in 2× SSC, in a
water three times and in 70% ethanol once. Coverslips humidity chamber at 37 °C for 24 h. After staining, sam-
were dried in a 70 °C oven before being immersed in 0.1% ples were washed for 15 min with 2× SSCT (2× SSC, 0.1%
(vol/vol) triethylamine (Millipore, TX1200-11) and 0.2% (vol/vol) Tween 20) twice at 60 °C and then once for
(vol/vol) allytrichlorosilane (Sigma, 107778-5 G) in 15 min at room temperature.
chloroform for 30 min at room temperature. Finally, the
coverslips were washed once with chloroform and once Tissue embedding and clearing
with 100% ethanol, then dried in a 70 °C oven for 1 h and To anchor RNAs and the oligos conjugated with WGA,
stored in a drying basin. the primary probe stained samples were embedded in 8%
PA gels29. Briefly, a 1:30,000 dilution of 0.1-μm-diameter
WGA conjugation carboxylate-modified yellow-green fluorescent beads
WGA (VECTOR, B-1025) was labeled with a copper- (Invitrogen, F8800) in 2× SSC containing 1% (vol/vol)
free click crosslinking agent using NHS-ester chemistry VRC (NEB, S1402) was first incubated with the stained
similar to previous reports70,71. DBCO-PEG5-NHS Ester samples for 10 min at room temperature. Then, the
(Kerafast, FCC310) was diluted to a concentration of samples were washed for 2 min with a de-gassed PA gel
10 mM in anhydrous dimethyl sulfoxide (DMSO). Overall, solution, containing 8% (vol/vol) 19:1 acrylamide/bis-
2.7 μL of the solution was then combined with 100 μL of acrylamide (Bio-Rad, 1610144), 60 mM Tris·HCl pH 8,
2 mg/mL WGA in DPBS. After 1 h at room temperature 0.3 M NaCl, 0.03% (wt/vol) ammonium persulfate (Sigma,
the reaction was terminated via an Amicon Ultra-0.5 A3678-25G), and 0.15% (vol/vol) TEMED (AMERICAN-
Centrifugal Filter Unit (Millipore, UFC501024) at 14,000× BIO.COM, AB02020-00050). To cast a thin PA gel film on
g for 15 min, and then 1,000× g for 2 min to collect the the tissue samples, 50 μL of this PA gel solution was
DBCO labeled WGA. On average, the procedure pro- added to the surface of a glass plate that had been pre-
duced ~2 DBCOs per WGA. Oligonucleotide probes, treated for 10 min with 1 mL GelSlick solution (Lonza,
ordered from IDT and diluted to 100 μM in DPBS, con- 50640). The sample coverslip was washed with PA gel
tained the desired sequence (named OS_61r, /5Acryd/ solution and the excess solution on the coverslip was
CGGTACGCACTTCCGTCGACGCAATAGCTC/3Azi- gently removed by dipping the edge of the coverslip on a
deN/) as well as a 5′-acrydite, to allow cross-linking to the Kimwipe tissue. Then, the sample coverslip was inverted
PA gel, and a 3′-azide, to allow cross-linking to the and placed onto this 50 μL droplet to form a thin layer of
DBCO-labeled WGA. A total of, 20 μL of the oligonu- PA gel between the coverslip and the glass plate. The PA
cleotide was added to 100 μL of the DBCO-labeled WGA gel was cast for 1.5 h at room temperature. The coverslip
at a final concentration of ~2 mg/mL. This reaction was was then gently separated from the glass plate and incu-
incubated at 4 °C for at least 12 h. The residual oligonu- bated in digestion buffer for 12 h in a humid 37 °C incu-
cleotides were washed away from samples during primary bator. The digestion buffer contained 2× SSC, 2% (vol/vol)
probe staining. SDS, and 1% (vol/vol) proteinase K (ThermoFisher,
AM2548). The tissue was then washed with 2× SSC sup-
Primary probe staining plemented with 1% Murine RNase inhibitor on a shaker,
The primary probe staining procedure was similar to three times each for 15 min.
those in previous reports27–29. Tissue sections were
stained with oligo-conjugated WGA in 1× hank’s balanced MERFISH imaging
salt solution (HBSS) buffer for 20 min at 37 °C. Samples After primary probe hybridization and tissue clearing,
were post-fixed in 4% PFA for 10 min. Tissue sections the samples were sequentially hybridized with different
were permeabilized using 0.5% Triton in DPBS for 20 min secondary probes, imaged and washed as previously
at room temperature before primary probe staining. Tis- reported27–29. We used Alexa Fluro 750/647-conjugated
sue samples were incubated for 5 min in pre-hybridization 20-nt secondary probes with sequences complementary to
buffer composed of 50% (vol/vol) formamide and 2 mM the readout regions of the primary probes (The secondaryYou can also read