Socio-economic impacts and indicators in the Surat Basin, and SME responses - GasFields Community Leaders Breakfast Research Team: Dr. Tom Measham ...

Page created by Marvin Fitzgerald
 
CONTINUE READING
Socio-economic impacts and indicators in the Surat Basin, and SME responses - GasFields Community Leaders Breakfast Research Team: Dr. Tom Measham ...
Socio-economic impacts and indicators
in the Surat Basin, and SME responses
GasFields Community Leaders Breakfast
Research Team: Dr. Tom Measham | Dr. Andrea Walton | Rod McCrea

15 June 2017
ENERGY
Socio-economic impacts and indicators in the Surat Basin, and SME responses - GasFields Community Leaders Breakfast Research Team: Dr. Tom Measham ...
Natural Gas, the great energy transition?

                                            2
Socio-economic impacts and indicators in the Surat Basin, and SME responses - GasFields Community Leaders Breakfast Research Team: Dr. Tom Measham ...
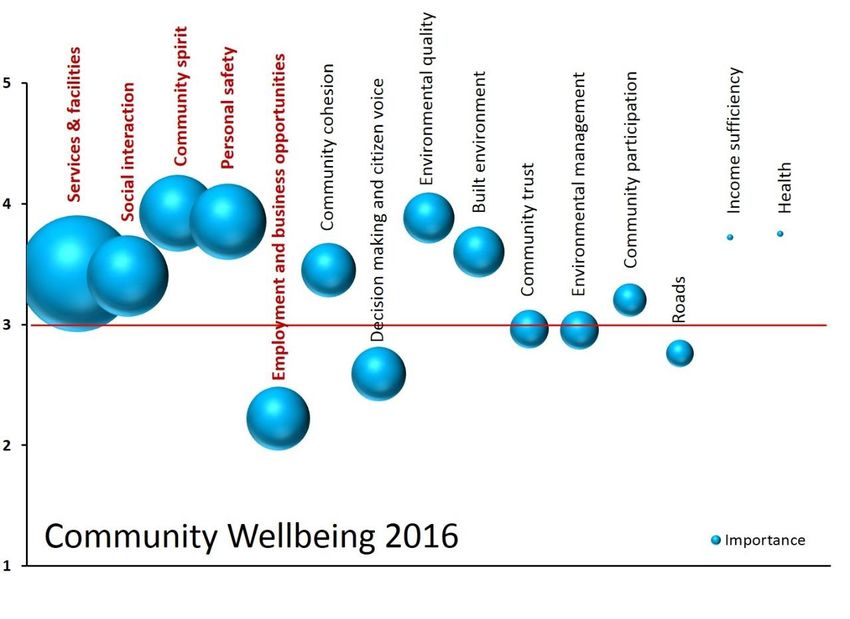
Primary stakeholder social questions
• Which communities, and who in those
  communities, are impacted by CSG?
• Are impacts being managed to the satisfaction
  and acceptance of the impacted communities?
• Does CSG development, and the activities
  designed to attenuate its imposition such as
  community investment, align with community
  aspirations?
• How many landholders are aggrieved by CSG and
  why?
Socio-economic impacts and indicators in the Surat Basin, and SME responses - GasFields Community Leaders Breakfast Research Team: Dr. Tom Measham ...
Primary stakeholder economic questions
a. How much money will be spent at in the region
   because of the development of CSG? Will this
   expenditure meet community aspirations?
b. How many jobs will be created?
c. What are the small and medium business impacts
   and opportunities?
d. How are other industries affected?
e. How are local property values affected?
f. What happens after project ramp down and we
   transition from construction to operations?
Socio-economic impacts and indicators in the Surat Basin, and SME responses - GasFields Community Leaders Breakfast Research Team: Dr. Tom Measham ...
GISERA’s research portfolio

●   Agriculture: identifying landscape/development configurations that maximise
    co-benefits

●   Water: understanding risks associated with extraction & use of groundwater

●   Biodiversity: understanding & minimising impacts of development on
    regional ecological function

●   Marine: understanding vulnerable components of the marine ecosystem to
    minimise or offset impacts

●   Socio-economic: informing & supporting change to enhance regional &
    community benefit

●   Greenhouse footprint: identifying sources and profiling the region

●   Health: understanding exposure pathways and associated risks
Socio-economic impacts and indicators in the Surat Basin, and SME responses - GasFields Community Leaders Breakfast Research Team: Dr. Tom Measham ...
Queensland projects
                                                               Socioeconomics
• Greenhouse footprint
                                                               S.1   Monitoring Regional Transition
• G.1        Methane seepage fluxes (enhancement), Surat
                                                               S.2   Community Functioning and well being
  Basin
                                                               S.3   Economic assessment and forecasting
• G.2        Whole of life cycle GHG assessment of
                                                               S.5   Understanding Community Aspirations
  exploitation of          Surat Basin gas reserve: global
                                                               S.6   Community functioning and wellbeing survey 2
  benefits and risks
                                                               Terrestrial biodiversity
• Groundwater
                                                               B.1 Threat identification
• W.1         Geo-chemical response to reinjection
                                                               B.2 Fire Ecology
• W.2         Re-injection of CSG water (clogging)
                                                               B.3 Habitat selection by two focal species
• W.3         High performance groundwater modelling
                                                               B.4 Translocation research project for Rutidosis lanata (an
  (feasibility              of largescale injection schemes)
                                                               offsets project)
• W.4         Geochemical baseline monitoring (groundwater
  flow        systems)
                                                               Marine
• W.5         HCs in groundwater, Surat & Bowen Basins
                                                               M.1 Towards an integrated study of the Gladstone Marine
  (defunct)
                                                                     System
•   Agricultural land
•   L.1       Preserving agricultural productivity
                                                               Others in currently in consideration across:
•   L.2       Shared space
                                                               Health; decommissioning, and biodiversity offsets
•   L.3       Gas farm design
•   L.4       Making tracks, treading carefully
•   L.5       Ag land Without a trace
•   L.6       Telling the Story (a communications project)

     Presentation title | Presenter name | Page 6
Socio-economic impacts and indicators in the Surat Basin, and SME responses - GasFields Community Leaders Breakfast Research Team: Dr. Tom Measham ...
GISERA socio-economic projects
                                                               LEAD
REGION       TOPIC
                                                               RESEARCHERS

Queensland   1. Monitoring regional transition                 Andrea Walton
             2. Community functioning and wellbeing 1          Rod McCrea
             3. Community functioning and wellbeing 2          Tom Measham
             4. Understanding community aspirations
             5. Economic assessment and forecasting

NSW          6. Analysing economic and demographic
                trajectories in NSW regions experiencing CSG
                development and operations
             7. Social baseline assessment of the Narrabri
                region of NSW in relation to CSG development
             8. Decommissioning pathways for CSG projects
Socio-economic impacts and indicators in the Surat Basin, and SME responses - GasFields Community Leaders Breakfast Research Team: Dr. Tom Measham ...
Social indicators
Socio-economic impacts and indicators in the Surat Basin, and SME responses - GasFields Community Leaders Breakfast Research Team: Dr. Tom Measham ...
What we did: Repeat CWB survey from 2014
                     Feb 2016
                     SAMPLE: N = 500
                     100 x
                      •   Dalby
                      •   Chinchilla
                      •   Miles / Wandoan
                      •   Tara
                      •   Roma

                     In town = Out of town

                     ABS representative
                     • age, gender, and employment

9
Socio-economic impacts and indicators in the Surat Basin, and SME responses - GasFields Community Leaders Breakfast Research Team: Dr. Tom Measham ...
Community Wellbeing: 2016 to 2014
Only five dimensions
significantly different

Reduced dimensions
• Employment and job
  opportunities
• Community cohesion
Improved dimensions
• Roads
• Environmental management
  for the future
• Quality of environment
  (dust, noise, air)
Overall community wellbeing:
Similar - no real change
  10
Most important wellbeing dimensions: 2016

 5
Community perceptions: Adapting to CSG: 2014 and
                                                            2016
                              50%
                                                                                                           46%
                                                                                                                 44%

                              40%                                                         38%
                                                                                    34%
Percentage of participants

                              30%

                              20%

                              10%                               8% 7%
                                              6% 6%                                                                         6% 5%

                                  0%
                                          Resisting it        Not coping        Only just coping        Adapting to the   Changing into
                                                                                                           changes         something
                                                                                                                          different but
                                       2014           2016                                                                    better

                             12
                             Note: Differences between 2014 and 2016 were not significantly different
CSG Attitudes – majority tolerate/accept;
                -ve has grown slightly across all fields
                              40%
                                                           36%
                                                                 35%               2014   2016
                                               33%   33%

                              30%
 Percentage of participants

                              20%
                                                                       14%
                                         13%                                 12%
                              10%   9%                                               8%
                                                                                          7%

                              0%
                                     Reject    Tolerate     Accept     Approve       Embrace

                               8
Most expect Future Community Wellbeing to stay
about the same as they did in 2014

Robust wellbeing to continue
                                 14%
for a slight majority; with a
negative outlook for many                29%

                                57%

                                       Decline
                                       Stay the same
                                       Improve

14
2016: Attitudes toward CSG –still vary across the region
                             50%
                                                                          Dalby
                                                                          Chinchilla
                                                                          Miles
                             40%
                                                                          Tara
                                                                          Roma
Percentage of participants

                             30%

                             20%

                             10%

                             0%
                                   Reject   Tolerate   Accept   Approve   Embrace

                              9
2016: CSG Attitudes – Out-of-town residents still less
                                               positive
                             40%
                                                          36%                     In town
                                               34% 33%          34%
                                                                                  Out of town
                             30%
Percentage of participants

                             20%
                                         16%
                                                                            13%
                                                                      12%
                                   10%
                             10%                                                  9%

                                                                                       5%

                             0%
                                   Reject      Tolerate   Accept      Approve     Embrace

                             10
Coexistence of CSG and agriculture
                     • Farm: workplace, natural environment, home
                     • Now also a gas network
                     • Issues: Difficult for farmers/gas co. to communicate
                        • Gas industry and farmers have different value systems
                        • Farmers see landscapes in ways that others do not
                     • Cultural change in gas companies
                        • Requires to fully engage with farmers
                        • Requires locals in direct communication with farmers
                     • Environmental impacts are of great concern
                        • Groundwater
                        • Atmospheric pollution (dust, light and noise)
                     • Quantifying cost and benefits on:
                        • Impacts on crop production, soils, farm operations, water
                        • Time, costs, weed management
                        • Water flow and erosion threat
                     • Understanding drilling impacts on agriculture
Farm owners:2016
                                                            Farm ownership

Community wellbeing dimensions          WD Region    No                       Yes
Community spirit                          3.92      3.91                     3.93
Environmental quality                     3.88      3.79L                    4.06H
Personal safety                           3.85      3.73L                    4.10H
Health                                    3.75      3.67L                    3.89H
Income sufficiency                        3.72      3.66                     3.82
Built environment                         3.60      3.64                     3.54
Community cohesion                        3.45      3.43                     3.46
Services and facilities                   3.42      3.49H                    3.30L
Social interaction                        3.40      3.44                     3.32
Community participation                   3.20      3.09L                    3.42H
Community trust                           2.96      3.00                     2.88
Environmental management                  2.95      2.92                     2.98
Roads                                     2.76      2.74                     2.79
Decision making and citizen voice         2.59      2.57                     2.64
Employment and business opportunities     2.22      2.25                     2.14
Farmers perceptions: 2014 and 2016
     Farmers 2014        Farmers 2016

                                                                  3.8
        Community wellbeing
                                                                    3.9

                                                      3.0
        Community Resilience
                                                      3.0

                                                            3.5
    Expected future Wellbeing
                                                                  3.8

 Attitudes and feelings toward              2.6
             CSG                            2.6

                                 1      2         3                 4     5
Farmers with active CSG leases and other farmers, 2016
                                                                                                                                    4.1
                                   Overall community wellbeing                                                                3.9
                                                                                                                 2.9
                                   Overall community resilience                                                        3.1
                                                                                                                             3.8
                      Expected future community wellbeing                                                                    3.8
                                                                                                                             3.8
                                               Income sufficiency                                                            3.8
                                                                                                                                4.0
                                                            Health                                                           3.9
                                                                                                                              3.9
                           Environmental quality (dust, noise)                                                                      4.1
                                                                                                           2.7
                                        Community trust (overall)                                                3.0
                                                                                        2.0
         Q22 Coal Seam Gas companies ...can be trusted                                           2.3
                                                                                                 2.4
                Decision making and citizen voice (overall)                                                2.7
                                                                                           2.1
Q18. Coal seam gas companies involve local residents …                                           2.3
                                                                                                   2.4
                           Feelings towards CSG development                                                2.7
                                                                                                         2.6
   Q44. Satisfaction with dealings with CSG companies

                                                                      1               2                          3            4           5
    20 | Presentation title | Presenter name
                                                    Farmers - Active CSG lease   Farmers - Other
Interesting observations ….for Q & A session
       • Roma compares favourably
         to the Western Downs                       CSIRO
                                                   Surveys
       • Changes in ‘in-town’
         attitudes
       • Farm attitudes not shifting
       • What's driving the                       Sense
         community cohesion                       making
         decrease
       • Information access,           Feedback
                                                              Other
                                                             research
         ‘having a say’ – still
         unsatisfactory

Presentation
       21 | title | Presenter name
Areas of significant community concern
                  • Extensive community engagement suggests most
                    consistent concern about:
                   – water
                   – negotiation process
                   – property values
                   – dust, traffic and noise
                   – compensation
                   – long-term groundwater impacts
                   – just another fossil fuel (ghg)
                   – fraccing chemicals
                   – food security
                   – community division
Economic indicators
Construction period

                      24
Construction period
                      • Construction phase (2008 – 2014)
                      • Family income +15% in CSG region
                      • ~30% higher ‘non-mining’ employment
                        growth
                      • ~100 mining/gas jobs generated per SLA
                      • 1400 new jobs for residents 2006-2011
                          • Excludes FIFO/DIDO in work camps
                          • 600 directly in resources sector
                          • 800 in other sectors
                      • Job growth from CSG:
                          • Construction and professional services
                          • Jobs shift: Agriculture/non-agriculture
                      • Operational phase TBD (2015 onwards)
                      • GISERA economic modelling and advising
                        business strategies to maximise opportunities

                                                                  25
Section 1:
Economic forecasting
Focus on projecting indirect employment
Project forecasts indirect jobs
• Started with estimates for Direct jobs supplied by Energy Skills
  QLD
• Estimated indirect jobs based on methods published in economic
  journal papers
• Observed multipliers derived for during the period 2006-2011
• These are the most reliable estimates available because they are
  specific to CSG industry in QLD
• Numbers in Surat and Toowoomba adjusted for FIFO-DIDO
• A total of 10 plausible scenarios were prepared to consider
  potential reductions in:
   • a) direct employment
   • b) ratio of direct employment to indirect employment

27 | Presentation title | Presenter name
Direct employment: Energy Skills QLD 2015
                                                       Assuming 39K wells
 18000

 17000

 16000

 15000

 14000

 13000

 12000
                                                                                                                     Assuming 39K wells
 11000

 10000

  9000

  8000

  7000

  6000
          2014 2015 2016 2017 2018 2019 2020 2021 2022 2023 2024 2025 2026 2027 2028 2029 2030 2031 2032 2033 2034

28 | Presentation title | Presenter name
Business as usual scenario: Surat Basin
                             2500

                                                                         *Spill-over jobs across all sectors
                             2000
                                                                         *Same multiplier as construction phase
                                                                         *After excluding FIFO
                             1500
  Number of Spillover jobs

                             1000

                             500

                               0

                             -500

                     -1000

                     -1500
                          2014      2016   2018   2020   2022     2024   2026    2028     2030     2032    2034
                                                                Sc BAU

29 | Presentation title | Presenter name
Slow down scenarios
                              2000

                              1500
   Number of Spillover jobs

                              1000

                               500

                                 0

                               -500

                              -1000
                                  2014   2016   2018      2020   2022     2024   2026    2028    2030   2032   2034
                                                       Sc SD1           Sc SD2          Sc SD3

30 | Presentation title | Presenter name
Slow down scenarios
                              2000

                                         Spillover jobs from 25% reduced CSG direct employment
                              1500
   Number of Spillover jobs

                              1000

                               500

                                 0

                               -500

                              -1000
                                  2014   2016      2018       2020       2022       2024         2026    2028    2030   2032   2034
                                                           Sc SD1                 Sc SD2                Sc SD3

31 | Presentation title | Presenter name
Slow down scenarios
                              2000

                              1500
                                                                                 Spillover jobs from 50% reduced CSG direct employment
   Number of Spillover jobs

                              1000

                               500

                                 0

                               -500

                              -1000
                                  2014   2016   2018      2020   2022     2024      2026       2028       2030       2032       2034
                                                       Sc SD1           Sc SD2               Sc SD3

32 | Presentation title | Presenter name
Slow down scenarios
                              2000

                              1500
   Number of Spillover jobs

                              1000

                               500

                                 0

                                                Spillover jobs from 75% reduced CSG direct employment
                               -500

                              -1000
                                  2014   2016   2018       2020       2022       2024       2026         2028    2030   2032   2034
                                                        Sc SD1                 Sc SD2                   Sc SD3

33 | Presentation title | Presenter name
Scenarios with reduced multipliers
                           2000
                                                                                          Business as usual with 50% lower multipliers
                                                                                          for construction

                           1500
          Number of jobs

                           1000

                            500

                              0

                            -500

                           -1000
                                2014   2016   2018   2020            2022   2024   2026          2028        2030        2032        2034
                                                            Sc 3.1                   Sc 3.11

34 | Presentation title | Presenter name
Scenarios with reduced multipliers
                           2000

                           1500
          Number of jobs

                           1000

                            500

                              0
                                              50% CSG Slow down and 50% lower multipliers for construction

                            -500

                           -1000
                                2014   2016      2018        2020            2022   2024       2026          2028   2030   2032   2034
                                                                    Sc 3.1                        Sc 3.11

35 | Presentation title | Presenter name
Gradually reducing dependence on CSG over time
                           2500
                                                                                              BAU with 25% Lower multipliers in all sectors
                                                                                              (except recreation and administration)
                           2000

                           1500

                           1000
          Number of jobs

                            500

                              0

                            -500

                           -1000

                           -1500

                           -2000

                           -2500
                                2014   2016   2018     2020      2022        2024             2026         2028       2030        2032        2034
                                              Sc 3.1   Sc 3.11      Sc 3.2          Sc 3.21           Sc 3.3       Sc 3.31

36 | Presentation title | Presenter name
Gradually reducing dependence on CSG over time
                           2500

                           2000

                           1500

                           1000
          Number of jobs

                            500

                              0

                            -500

                           -1000

                                                       50% slow down with 25% Lower multipliers in all sectors
                           -1500
                                                       (except recreation and administration)

                           -2000

                           -2500
                                2014   2016   2018           2020        2022         2024             2026        2028     2030    2032   2034
                                              Sc 3.1          Sc 3.11        Sc 3.2          Sc 3.21          Sc 3.3      Sc 3.31

37 | Presentation title | Presenter name
Abrupt de-link from CSG
                           2500

                           2000

                           1500

                           1000
          Number of jobs

                            500

                              0

                            -500
                                                BAU with 75% Lower multipliers in all sectors
                           -1000                (except for recreation and administration)

                           -1500

                           -2000

                           -2500
                                2014   2016   2018         2020        2022        2024             2026        2028     2030    2032   2034
                                              Sc 3.1        Sc 3.11       Sc 3.2          Sc 3.21          Sc 3.3      Sc 3.31

38 | Presentation title | Presenter name
Abrupt de-link from CSG
                           2500

                           2000
                                                                                              50% slow down with 75% decrease in construction
                                                                                              (and 20% increase in all other sectors)
                           1500

                           1000
          Number of jobs

                            500

                              0

                            -500

                           -1000

                           -1500

                           -2000

                           -2500
                                2014   2016   2018     2020      2022        2024             2026        2028       2030       2032       2034
                                              Sc 3.1   Sc 3.11      Sc 3.2          Sc 3.21          Sc 3.3       Sc 3.31

39 | Presentation title | Presenter name
All scenarios on same screen
                                       2500

                                       2000

                                       1500

                                       1000
                      Number of jobs

                                        500

                                          0

                                        -500

                                       -1000

                                       -1500

                                       -2000

                                       -2500
                                            2014   2016   2018      2020         2022   2024      2026        2028   2030      2032   2034
                                                          Sc BAU           Sc SD1       Sc SD2           Sc SD3       Sc 3.1
                                                          Sc 3.11          Sc 3.2       Sc 3.21          Sc 3.3      Sc 3.31

40 | Presentation title | Presenter name
Projected changes by sector
                                                                                 Jobs from     Jobs from      Jobs from
Industry sector                            2006 jobs   2011 jobs   2014 jobs   Scenario BAU   Scenario SD2   Scenario 3.3
                                                                                   2034           2034          2034

Electricity, gas, water and waste
                                              591         798        1,250        1,167          1,209          1,002
management services

Construction                                 3,577       4,350       6,650        6,291          6,470          6,769

Accommodation and food services              2,679       3,215       2,950        2,623          2,787          1,971

Arts and recreation services                  196         303        225           243            234            243

Other services                               1,694       1,919       2,725        2,572          2,649          1,809

Administrative and support
                                              711         847        900           830            865            830
services

41 | Presentation title | Presenter name
Observations
• Direct industry jobs are forecast to rise and fall
• For indirect jobs (spillovers):
   • the more closely they are tied to direct jobs, the more they rise and fall
• Some sectors are more strongly linked to CSG than others
• Therefore some sectors are more effected by change in CSG than
  others

42 | Presentation title | Presenter name
Section 2:
Implications for local businesses
Based on interviews by small to medium enterprises

Video: https://youtu.be/uLWouow5ts8
10 Lessons we’ve learned
1. Look after core            2. Be diversified
   customers                  • Think carefully about putting
- throughout the busy times     all your eggs in one basket.
                              • Keep a broad base of
                                customers.
                              • Look for new markets with any
                                new capacity developed

Page
  44
4. Stay connected
                                • Supply chain, industry
3. Understand the                 bodies, regional
                                  development groups, local
   industry                       Chambers, govt programs
• Where you fit in the supply      –   possible opportunities
  chain                            –   possible collaborations
• The ups and downs of             –   prepared for what’s coming
  activity                         –   learn
• Things change fast
• Prepare for the quieter
  times
• Big companies think and act
  differently from SMEs

Page
  45
5. Keep a close eye on                 7. Seek business advice
   your business                          early
• Manage your costs for project        • Outside advisor, business mentor,
  type work,                             accountant
• Understand your contracts,           • Tough decisions may be needed
• Beware of possible risks             • You may not want to know what
       – Bed debts during slow downs     you're hearing
       – External economic factors

6. Be careful not to                   8. Seek out reliable
   overcapitalise                         information
                                       • Be wary of spin

Page
  46
9. Personal                       10.Take opportunities
   considerations                   to learn and grow
• How involved do you want to       with the CSG
  be?                               industry
• Boom times and quieter times    • Position yourself for the next
  can be stressful.                 increase in economic activity
• Consider exiting when you can

Page
  47
What could have helped
• Smoother transition into operations
• Some signals as to when construction finishes
• As much local content in operations as
  possible
• Clarify the IT systems and platforms
• Not putting wasted investment into
  compliance training
• Don’t overstate benefits: accurate
  information is most useful
• Correction misinformation wherever possible
• Steps to avoid a housing bubble

Page
  48
Conclusion
• Forecasting economics is like forecasting the weather
   • = Projections based on best available information (not predictions)
• The research considered a range of plausible scenarios
• In 2034, most scenarios indicate:
   • lower indirect jobs compared to 2014
   • higher indirect jobs compared with 2006
• Oscillating periods of increase and decrease are likely
• Lessons learned from the construction phase are highly relevant
  for local businesses during the operations phase

• Video: https://youtu.be/uLWouow5ts8

49 | Presentation title | Presenter name
Thank you
Dan O’Sullivan
Onshore Gas Sustainability Advisor
                                     Lead Researchers
t 0467 813 929                       Dr. Andrea Walton
e Dan.OSullivan@csiro.au             t 07 3833 5675
w www.csiro.au                       e andrea.walton@csiro.au

                                     Dr. Tom Measham
                                     e 07 3833 5677
                                     e Tom.Measham@csiro.au

•   ENERGY UNIT
You can also read