SCM 4.0/5.0 Strategies for 2023 - Supply Chain Management: The Poirier Group
←
→
Page content transcription
If your browser does not render page correctly, please read the page content below

Supply Chain Management:
              SCM 4.0/5.0 Strategies for 2023
                                    Our Presenter today:
  Coordinator, Facilitator

         D. Scott Sink
                                         Jared Frederici
  IISE Performance Excellence
     and Op Analytics Lead              Sr. Leader & MBB
                                        The Poirier Group

                                           9 Feb 2023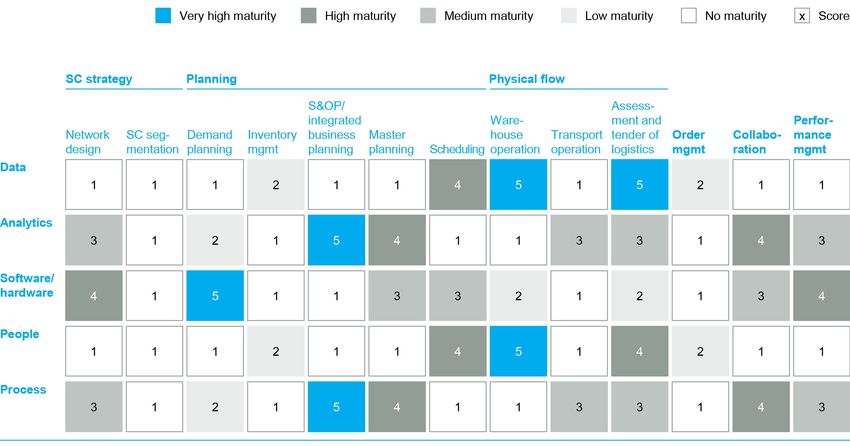
Agenda

 11:00-11:07   Scott Tee-up

 11:07-11:37   Jared execute on story line

 11:40-11:50   Scott and Jared Dialogue (using chat from
               audience)

 11:51-12:00   Scott Close out and tee up upcoming webinars
               and IISE Annual Conference

                                                              2
Our 2023 ‘Lead-off’ Trilogy:
                  Insightful Leadership on Supply Chain Management
              01.06.23 Jim Tompkins Perspectives and Points of View (Insightful Leadership)

                         01.13.23 Best Practice Case Study—Peavey Industries
    Successful Integration of People, Information and Technology Enablement, Strategy and Process

02.09.23   Cutting Edge ISE Principles and Methods for
                       SCM 4.0/5.0
                               with Jared Frederici, TPG

                                                                                                    3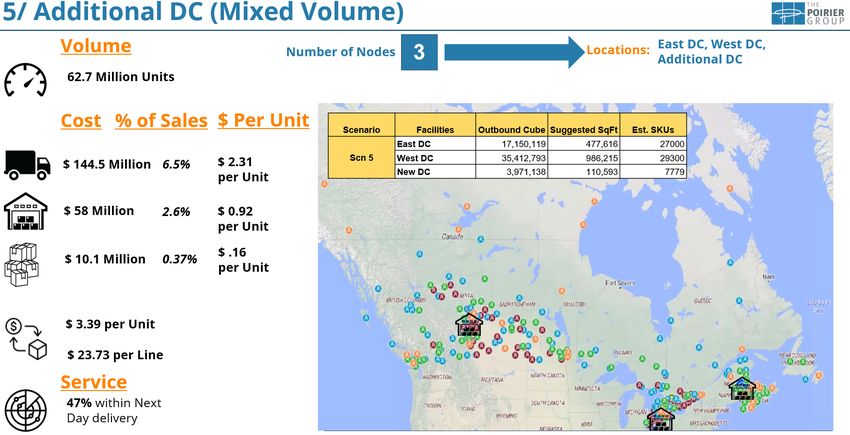
Housekeeping

    Thank you for joining us!
1

    We’ll share how to get access to the recording, presentation, YouTube versions and blogs at the
2   end of the webinar. The presentation is available now, use this link to get.. (we’ll post as a chat)

    We will field questions as appropriate and time permits. Please use the ‘chat’ function to share
3   your comments and questions.

    Follow up questions are welcomed and contact information is provided at the end of the
4   presentation.

    For those who value certificates of participation, IISE will be mailing those out the week after the
5   webinar. Be patient and check your clutter and spam folders if you don’t receive one.

                                   Thanks to our Sponsor and Partner for
                                       investing time, money, energy
                                   programming and directing this overall
                                              Program for IISE!                                            4
Our Global Personal and Professional
Development Series for IISE Members
and Customers……
              THEMES:

              • Supply Chain 4.0
              • Enterprise Transformation and OpEx

              • Strategic Performance Improvement
                Planning
              •   Operational Analytics

              •   Cultures to support Perf Excellence

              •   Integration of People, Strategy, Process and Technology

              •   Integrated LeanSigma

              •   Industry, Service, Healthcare 4.0

              •   Personal and Professional Learning and
                  Development

              •   Change Leadership and Management

              •   Navigating through Turbulent (VUCA) times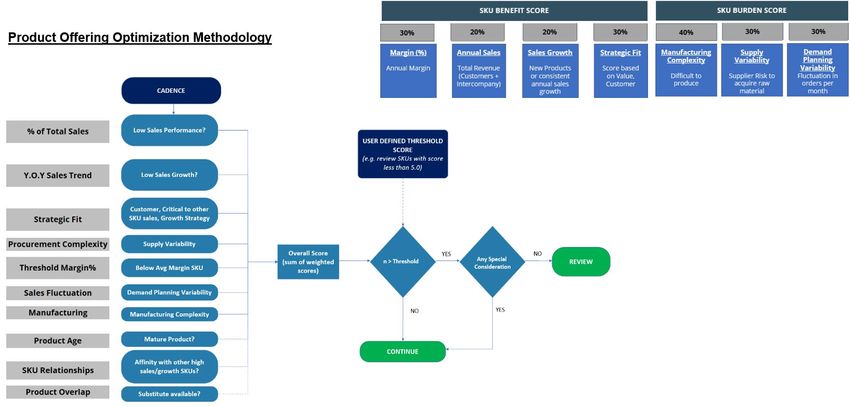
100+ Timely Webinars on a full
                                          spectrum of Performance
                                          Excellence topics with an
                                          Integrated Systems Engineering
                                          Perspective and Point of View.

                                          Available on-demand for IISE
                                          members.

                                          Clustered into packages
                                          of webinars to provide
                                          tailored Certificate
                                          opportunities for our
                                          Members.
                                          1--Operational Excellence
                                          2--Integrated LeanSigma
                                          3--Operational Analytics
                                          4--Change Leadership &
                                                  Management

                                     Strengthen your Resume and
                                           Linkedin Page!!
IISE Global Performance Excellence
                                                                           6
on-demand Webinar Library
Our three part series of
webinars on Organizational
and Operational Excellence
in the Fall Quarter
culminated in this article in
the ISE Magazine (Dec 2022)

To access a copy of this
article, please use this link:

https://www.thepoiriergroup
.com/creating-resilient-
organizational-excellence-
programs-amid-major-
disruptions/
For a short recap of Jim Tompkins webinar, read our
blog…. https://www.thepoiriergroup.com/perspectives/

                          And, go to the IISE link to get the
                          presentation and view the video:
                          https://www.iise.org/details.aspx?i
                          d=53670

                                                           8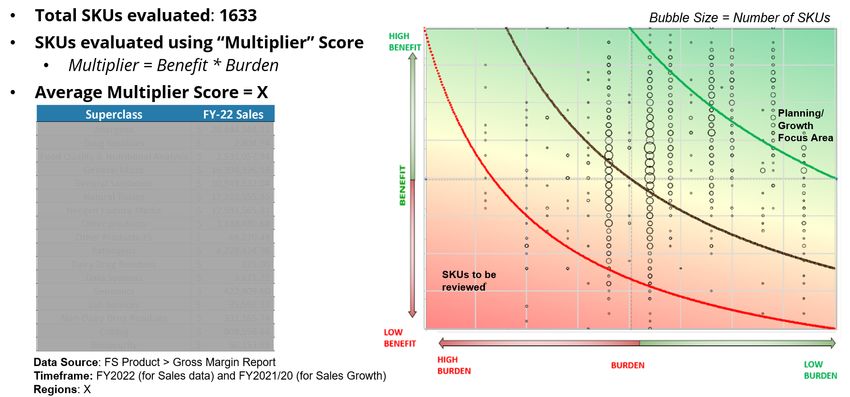
Visit The Poirier Group’s Website to access Jim Tompkin’s webinar and
                          blog from last week
            https://www.thepoiriergroup.com/perspectives/

                                                                9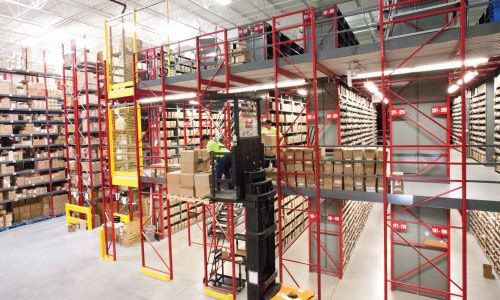
Today’s Webinar focuses on these Critical Factors for Success in a
                      Challenging 2023

  • Develop/Invest in your Talent—You win with People

  • Create Value—diversify and solidify existing revenue streams and keep
    investing in the positioning and marketing process

  • Control Costs—reduce wastes, improve productivity and quality

  • Reduce Working Capital, improve liquidity by making tough, timely choices but
    also by finding ways to manage assets constituting Working capital better,
    faster, NOW!

  • Build/Grow your Business Process Improvement capabilities, invest in partners
    and talent development to ensure you are improving what you do and how you
    do what you do better, faster.

  • Improve Flow—reduce cycle times and lead time, focus on cross-functional
    value stream improvement.

  David Poirier, CEO The Poirier Group, Jan 2023
                                                                                    10
Story Line for today
Agenda/Story Line:
• Supply Chain Management 4.0/5.0 is all about the integration of People,
Strategy, Process and Information and Technology Enablement;
• It’s clear from our first webinar in this trilogy, Jim Tompkins, that the
requirements for success in SCM have changed dramatically, I’ll review in what
ways;
• There are some innovative applications of Integrated Systems Engineering that
we’ve been applying with our clients that Jared will share for your
consideration;
• The ‘end game’ in SCM for most middle tier organizations is resilience, pre-
activeness (as Jim said), agility and flexibility and most importantly rationalized
optionality of how we get the right things, right amount and quality, right place
at right time and cost..
To get a copy of our the presentation and YouTube Version of the recording for the
Webinars from 6 & 13 Jan. https://www.thepoiriergroup.com/
https://www.youtube.com/channel/UCixxhLPZrwdK-DdKYqYZm1ASupply Chain
Management 4.0 in
Periods of Disruption
Jared Frederici
Senior Leader,
The Poirier GroupSupply Chain – State of the Industry
Expect disruptions. Things are not going back to normal. New “Normals” are forming.
Headwinds of a recession are already impacting Supply Chain decisions and planning.
Rising Demand for Increasing Advancing Rising Complexity –
Third-Party Logistics Transportation Costs Technologies Need for Visibility
Drivers: Drivers: Drivers:
• Rising demand from e- • Overall Inflation • New technology in
Drivers:
• Global overproduction
commerce • Wage increases and hybrid/electric vehicles •
• Global supply chain worker safety regulation • Advanced warehouse
Increased e-commerce
demand
complexity increasing • Rising fuel costs due to management software •
• Reduction in physical war in Ukraine • Industry 4.0/IoT driving
Residual disruptions by
COVID-19
locations and connected
Ecomm ecosystems
operational efficiency • Push for deglobalization
Organizations need to be equipped to make interventions at different phases in the
end-to-end Supply Chain, leveraging different techniques, based on relative maturity
Source: IBISWorld 13
TPG Client SetTransportation – State of the Industry
Change is the new normal. Some relief at the ports but long term ripple effects on
manufacturing are impacting up a number of industries (long range bullwhip effect)
The Transportation industry is faced with capacity issues everywhere.
OCEAN FREIGHT
Continued port backlogs AIR FREIGHT
and reduced capacity in Reduced freight capacity because
available ships. Some of COVID related passenger flight
relief but long term decline and spill over from
impacts shortage of ocean freight options
TRUCKING
Driver shortages and
blockages because of
protests, weather and border
related delays. Spot market
variance across the board
Source: IBISWorld 14
TPG Client Set & SMEAssessing Supply Chain Maturity
We can often romanticize “models” – there are many good ones to assess maturity
available but you must fit to your organization type
This is one of many maturity models. 1-5 often follows “Blooms Taxonomy”.
Visualizing the “end-to-end” and assessing maturity are first steps.
Source: McKinsey 15Migrating from Ad hoc to Digital, Prescient Ecosystems
Not so long ago, “Predictive” was #5…
The most advanced supply chains can run largely digitally, predicting with high
degrees of accuracy disruptions, and putting mitigation plans/strategies in place
autonomously
Source: IDCEurope 16Supply Chain – From Raw Material to End User
Supply Chains vary widely based on the what needs to occur for the physical product (or service!). The
flow starts with the input supplies; the conversion (manufacturing/packaging); the storage and/or
fulfillment; and the end user.
Raw Material Product Physical Flow
Components
Production Finished
Packaging Depots End Users
Packaging Items Goods
Sub-Assembly & (Customers,
Inventory Distribution
Unitization Wholesale,
Product Sourcing
Work-in-progress Centres Retail)
Warehouse
Imported Materials
Bought-in Parts Information Flow
Reverse Logistics
17Supply Chain – End to End with Decision Points (and
Failure Modes)
Optimizing the performance of a supply chain is typically aligning multiple decision points with the
corporate strategy and customer requirements.
Network Planning
Manufacturing • Location and Blend of Warehouse/DC/Depot
• Capacity
Raw Material • Equipment
• Type and Size of Storage
• Materials Handling Equipment
Components
Production Finished
Packaging Depots End Users
Packaging Items Goods
Sub-Assembly & (Customers,
Inventory Distribution
Unitization Wholesale,
Product Sourcing
Work-in-progress Centres Retail)
Warehouse
Imported Materials Packaging
• Protective Elements Inventory Management
• Handling Systems
Bought-in Parts • Unit Load and # of Options
• What to stock
• Where to stock
• How much to Stock
Demand and Supply
Planning
• Forecasting Transportation Management
• Control Procedures • Mode of Transportation
• Sourcing – price, location • Type of Delivery
• Load Planning and Route
Scheduling
18Retail and Manufacturing Supply Chains vs. Services
Retail and traditional manufacturing Supply Chains focus on getting the product to the end customer. Typically the same
physical SKU will be at multiple stages in the supply chain and constantly flowing with the goal to be on shelf BEFORE the
customer but not too early. Notice the nuances of a service based supply chain.
Intelligence Back Loop
Deploying to
Customer
Company Owned
Assessing QC, Beta,
Store
Capacity, Workflow,
Deploying Skills, Readiness
3rd Parties
Franchisee
Ordered Inventory In transit to DC In the DC(s) In transit to Store
Procuring
Assets and
Developing EComm
Resources
Services,
Predicting and &
In transit to
Understanding
Store
Requirements
The type, location, and
Critical Success Factors for Retail/Manufacturing is ownership of the outlets has an
Flow in the Retail / Manuf. product FLOW as demand can be forecasted but often impact on all upstream
Supply Chain volatile capacity needs and service
levels.
Critical Success Factors for Service Systems is visibility
Flow in the Services to PEOPLE and how they interact with services &
Supply Chain technology within the broader value chain
19Setting the Stage – Where Many Organizations are
at Within Their Supply Chains
This is the challenge many supply chain leaders are facing as costs have risen,
budgets are being questioned and forecasts are being revised.
What’s the bridge between what our cost structure was, what it is
now, what’s controllable vs. what’s not? 20Supply Chain – End to End Processes
21Supply Chain – End to End Processes
22Zooming In – Vendor/Carrier Management for Logistics
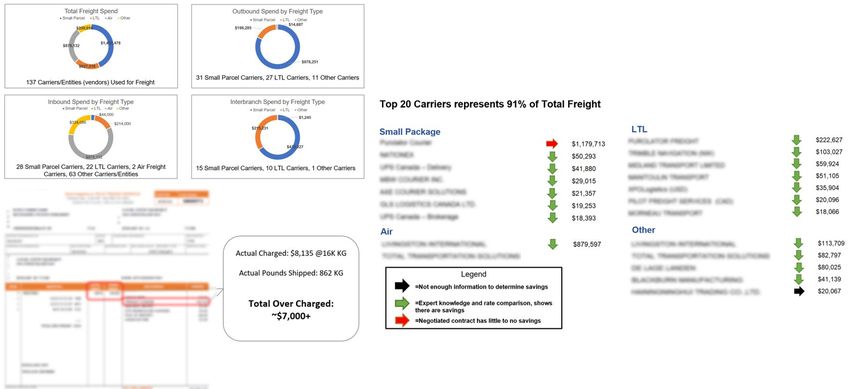
23Deep Dive 1 – Carrier/Fleet Costs
Automated carrier or internal fleet analysis (inbound, outbound, transfer) – many leveraging AI, or RPA
1. Having great master data, in one spot is critical
2. There are organizations and tools to rapidly and dynamically assess your freight spend, by carrier, against
benchmark or comp.
3. Spot market assessments and niche benchmarks
24Zooming In – Distribution Centre Optimization
25Deep Dive 2 – Optimizing Within the 4 Walls
Many DC’s are still struggling with the basics. Isolated improvements aren’t connected to the whole or even begin bottom up from the
operators. Doing 24-36 month planning, great business cases and taking on what the organization can absorb continues to be critical
Advanced technologies such autopick, guided vehicles, bulk RFID or
drone technologies (for dynamic cycle counting and lifecycle
management) and IoT are great but how often have you seen these as
“silver bullets” in your network?
Many organizations just need to execute the basics consistently, over a
period of time 26Zooming In – Dynamic Inventory Management
27Deep Dive 3 – Understanding Complex
Inventory Effects
This is a relatively simple example for one location, $200M sales, 50-100 finished good SKU’s…
Inventory Optimization – Causal Loop Diagram
• 36 Products were sampled > 15 Days.
Hard Customer - Need to fill + • 66 Total active SKU’s
Orders shorted trucks! • 21 Products account for 93% of the YTD business.
Forecast
+ Truck + Total Active SKU’s
R Shorted 66 Measured Effects of the System
Demos + + + • 2008: $35,400 Avg.
Cuts & Currently Produced >
Overtime / Month
+ Schedule is made
• 2009: $15,400 Avg. Bumps
Schedule Changes/ Week
15 Days: 36
Special Buys weekly in “surge” / Month (YTD Aug.)
+
• Average: 3.42
-
+ production.
Schedule
• St. Dev: 1.38
+ + +
Avoid Changeovers
Changes R
Product Bumped Finished Goods Sit
+ Finished Goods >
+
Line Selection + R + 15 Days: 40%
+ + Shortage of +
Keep Plant Busy Materials
+ + B *To: Keep
Manpower + Plant Busy
- Availability Overproduction
• Order to “surge” + + +
B Customer orders that
schedule Machine Changeovers Inventory Days = 27.1 > 15 Days
• Materials • 2008: 2.2%
Downtime
- Uptime are + / - minimum
production runs Finished Goods ($): 41% (17%)
misplaced / lost in
• 2009: 1.7%
frozen and dry Downtime (YTD May) Raw Materials ($): 34% (22%)
warehouses. +/- Discontinued / Slow
Packaging: ($) 17% (10%)
Movers: 28
+ Processing OEE
+ +
• 2008: 85.2% Packaging OEE
• 2009: 84.5% • 2008: 75.1%
(YTD Aug.)
• 2009: 78.8%
Overhead
(YTD Aug.)
- - + + + Raw Materials > 15
Requirements Productivity Raw Materials Sit
+ Days: 69%
Need to
produce 60,000
-
lbs per day.
+
Need to Use
+ + + + + Packaging > 15 Days:
Time Sensitive R Over-ordering Packaging Sits
• Partial pallets Materials
+ + 61%
•Lack of standardized training,
documentation in material
Supply Chain Problem
handling and shipping
• Lead Time Key
• Limited to no dedicated
material locations in dry / frozen
• Min. Order Quantity - Decreases Effect Root Cause Lever
• Vendor Over-shipped
warehouses.
Scanning Errors • Early / Late Shipment
+ Increases Effect Time Delay Driver
• No order safety inventory
levels / kanban replenishment + affect the entire
system on the
• Late Shipment R Reinforcing Loop B Balancing Loop Failure Mode
• Lack of accountability to reliability of accurate
material yield. information. Last Updated: 09/22/09
28Deep Dive 3 – Understanding Complex
Inventory Effects
How often are we understanding the full impact of a given change like MOQ’s, safety stock, scheduling changes, etc.
Inventory Optimization – Causal Loop Diagram
• 36 Products were sampled > 15 Days.
Hard Customer + Need to fill + • 66 Total active SKU’s
Orders shorted trucks! • 21 Products account for 93% of the YTD business.
Forecast
- Truck + Total Active SKU’s
R Shorted 66 Measured Effects of the System
Demos - + + • 2008: $35,400 Avg.
Cuts & Currently Produced >
Overtime / Month
- Schedule is made
• 2009: $15,400 Avg. Bumps
Schedule Changes/ Week
15 Days: 36
Special Buys weekly in XOXO / Month (YTD Aug.)
+
• Average: 3.42
-
- production.
Schedule
• St. Dev: 1.38
+ + +
Avoid Changeovers
Changes R Product Bumped Finished Goods Sit
+ Finished Goods >
-
Line Selection
- + R + 15 Days: 40%
Shortage of +
Keep Plant Busy Materials
+ + +
B
Manpower
- *To: Keep
Plant Busy
- Availability Overproduction
+ + +
B Customer orders that
Machine Changeovers Inventory Days = 27.1 > 15 Days
• Order to kanban
re-order point. • 2008: 2.2%
Downtime
- Uptime are + / - minimum
production runs Finished Goods ($): 41% (17%)
• Materials • 2009: 1.7%
Downtime (YTD May) Raw Materials ($): 34% (22%)
organized, 5S’ed, - Discontinued / Slow
Packaging: ($) 17% (10%)
known. Movers: 28
Processing OEE
• 2008: 85.2% Packaging OEE
+ +
• 2009: 84.5% • 2008: 75.1%
(YTD Aug.)
• 2009: 78.8%
Overhead
(YTD Aug.)
- - + + + Raw Materials > 15
Requirements Productivity Raw Materials Sit
+ Days: 69%
Need to
produce 60,000
-
lbs per day.
+
Need to Use
+ - + + +
Time Sensitive R Over-ordering Packaging > 15 Days:
Packaging Sits
Materials
+ + 61%
Supply Chain Problem
• Lack of standardized training,
• Lead Time Key
documentation in material
handling and shipping • Min. Order Quantity - Decreases Effect Root Cause Lever
• Vendor Over-shipped
•Lack of accountability to
Scanning Errors • Early / Late Shipment
+ Increases Effect Time Delay Driver
material yield.
+ affect the entire
system on the
• Late Shipment R Reinforcing Loop B Balancing Loop Failure Mode
reliability of accurate
information. Last Updated: 09/22/09
We are starting to see more complex ecosystems like this digitally, with the ability to29make
dynamic changes on the fly, or predict failuresZooming In – Dynamic Network Rationalization and
Scenario Planning
30Deep Dive 4 – Dynamic, Network Modeling
Being able to dynamically create and assess scenarios in your network, simple or complex still continues to be challenging and
time consuming. Dynamic modeling based on dynamic performance data is differentiating the best from the average.
Network modeling simulation software and vendor ecosystems are expanding into the small
to mid market rapidly to reduce organizational energy into understanding the unknown.
31Zooming In – Product / SKU Dynamic Rationalization and
S&OP / IBP
32Deep Dive 5 – Dynamic Portfolio Optimization
Custom weighting system for examining your SKU performance portfolio
SKU interdependencies are often more complex than expected. Building in known VARIANCE
into our optimization/rationalization models is critical
33Deep Dive 5 – Dynamic Portfolio Optimization
Dynamically seeing your SKU performance (vs. a one-off exercise) is a key differentiator
Organizations that are taking their Supply Chain performance and a detailed understanding
of variation as they examine SKU’s and downstream make-to-forecast, make-to-buy or hybrid
models as part of an integrated S&OP process are moving up in maturity
34Zooming In – RPA/Automation for Shared Services
35Deep Dive 6 – Simple RPA Applications
Off the shelf or built-in RPA and automation applications are being leveraged across organizations of all size.
Not all processes are great candidates. Time to implement can be days, not weeks or months.
36Other Considerations and Conclusions
- People costs across the board have gone up
PEOPLE - Flexibility is becoming key, but most organizations
feel limited
- Temp agencies are getting overwhelmed, conversions
to full time dwindling
- Creativity in investment and comp structures are
paying off
- RPA and AI are already being leveraged across the
simple and complex – more attainable than one may
ADVANCED TECHNOLOGIES think
- ChatGPT and other NLP’s have limited case studies –
be cautiously optimistic and don’t underestimate data
volume required (SOP’s/Helpbots vs. Core
Operational)
- Simulation platforms are migrating into the small to
mid market along with mini-WMS’s / TMS’s
- Beginning to differentiate organizations
BENCHMARKING - Do to your internal network at least
- Niche, sub-industry still challenging so consider
partnering up / invest
37Conclusions
1. Understand your supply chain’s maturity
2. Create and end-to-end view of your supply chain
3. Begin to make interventions leveraging the right tools, at the
right time:
a. Leverage benchmarks to understand what’s possible (internal and external)
b. Silver bullet technologies are fleeting – pragmatic options exist
c. Weakest link in chain often needs “getting the basics right”
d. Take on change that the organization can actually absorb
e. Get great at business cases and realistic portfolio planning
f. Build better demand volatility models and matriculate downwards
38Just Ahead…..
2023 IISE Training and Development Opportunities:
23 Feb—Best Practice Case Studies: Building Great BPI
Programs: Consumers Energy Christine Wisniewski, VP Op
Performance
https://us06web.zoom.us/webinar/register/WN_crvTMTlFSdyNz3mjF8aviQ
7 March—Creating an Inclusive Workplace Culture--Yuri Ramirez,
Director of Intel Global Engagement Program Office
https://us06web.zoom.us/webinar/register/WN_TxbEvghkSXSwL6nKFqgcxw
9 March—Integrated LeanSigma—How to Train it and Do it Scott
Sink
https://us06web.zoom.us/webinar/register/WN_oUS4qZ-iRcKdu0uDz8GbLg
28 March—Best Practice Case Studies: Global Enterprise
Excellence—Flex Eduardo Toledo, VP Quality and Op Ex
https://us06web.zoom.us/webinar/register/WN_0q56PHk8TpWBsWVDSKopYQ
Q2 ‘in the works’ offerings for you:
• Strategizing/Rationalizing Cost Reduction in 2023
• Best Practice Case Study—Data and Analytics at University Health
Network, Toronto
• Sneak Preview of the IISE Annual Conference and CISE’s Performance
Excellence Track
• Creating Meaningful, Insightful Organizational/Operational Scorecards
and Dashboards
• Revisiting Plan, Do, Study, Adjust for 2023Don’t Miss our Upcoming Webinars:
Best Practices: Building Great Operations
Performance Assurance Programs
Consumers Energy
Chris Wisniewski
https://us06web.zoom.us/webinar/register/WN_crv https://www.linkedin.com/in/cwiz/
TMTlFSdyNz3mjF8aviQ
Thursday, 23 Feb 11:30-12:30 pm Eastern
Chris is VP Operations
Performance at
Consumers Energy and
a member of CISE.
40Don’t Miss our Upcoming Webinars:
Creating Inclusive Workplace Cultures
Yuri Ramirez,
Director of Intel Global
https://us06web.zoom.us/webinar/register/WN_Tx Engagement Program Office
bEvghkSXSwL6nKFqgcxw https://www.linkedin.com/in/
ywramirez/
Tuesday, 7 March 1:00-2:00 pm Eastern
Join Diana Berry, Chair
IISE’s DEI Committee and
IISE Diversity, Yuri Ramirez, Intel, to learn
Equity, more about how Intel
Inclusion Creates Inclusive
Committee Workplace Cultures
41IISE Performance Excellence Track for
Practitioners and Students
Operational Excellence, Performance Excellence, Integrated LeanSigma, Operational Analytics,
BPM/I 4.0, High Performing Cultures, Integration of Strategy-People-Process-Information and
Technology Enablement, Best in Class Case Studies, Networking
All being Developed for you for New Orleans in May 2023!!!
42Complete a Short Survey for us?
● Your Feedback is Important:
A short survey will be available to you as just
prior to leaving the webinar, we’d appreciate
your input.
Reach out if you have questions or other
needs:
James Swisher jswisher@iise.org
Scott Sink ssink@jumpcurves.com
43Performance
Excellence Track
6 Special Sessions specifically designed for
Practicing ISE Professionals, Young
Professionals, Students head to Industry
Scott Sink
Track Organizer/Coordinator
Facilitator for the CISE
Group
Session Chairs:
• Victoria Jordan, Emory
• David Poirier, TPG
• Kerri Alderman, UPS
• Other CISE Member
Companies Involved:
Boeing, Duke Healthcare, https://www.iise.org/Annual/
Meta, Consumers Energy,
GM, Disney, Deere, and
more….Get a critical ‘patch/updates’ on how ISE’s
Unique Format for networking, learning, sharing, developing
are innovating to better integrate People,
Strategy, Process, Information and Technology
4 ‘hot topic’ Interactive Sessions led by Thought Hot topics of critical importance to leaders, managers, young
Leaders professionals engaged in operational excellence work
1. Victoria Jordan—Emory Healthcare, Thomas Davis— 5. The ISE Outstanding Capstone Senior Design Showcase and
Duke Healthcare and others..: Healthcare and Finalists Presentations: See and Hear about the top 3-4 Finalists in
Lifesciences how ISE is and will continue to contribute; our annual ISE Capstone Senior Design Competition. (Sunday-
2. Kerri Alderman—UPS & Eleke Ukpabi—Ruan, Jim Monday)
Tompkins, Yves Belanger: Novel strategies and tactics
to address Supply Chain Challenges 6. The Outstanding Service Systems Engineering Competition
Finalist Presentations (Vittal Prabhu, PSU)—See and Hear about
3. David Poirier—The Poirier Group, Eduardo Toledo—
the top 4 Finalists from our Annual Service Systems Engineering
Flex; Debbie Nightingale: Organizational and Competition. (Sunday)
Operational Excellence of the Future
4. Scott Sink, Jared Frederici, Operational Analytics and 7. The Operational Excellence Division: a multitude of sessions on
ISE How to create insights and provoke timely various topics related to Organizational and Operation
decisions and actions in the face of all the data Excellence that will drill down, zoom in on topics and issues
covered in our 3rd Module provided by CISE.
New Orleans, IISE Annual Conference, CISE’s
And there’s more reasons to attend….. Performance Excellence Track—See you there!!
Great VALUE for you and your company—we’ve Don’t forget our fantastic Keynote
assembled a team of thought leaders you won’t find
anywhere else…
Presentations Sunday, Monday and
Tuesday mornings.
8. The Performance Excellence Track was most innovated and
one of most popular track of sessions last year—it will be
even better this year
AND….
9. My first IISE conference in 1973 was in New Orleans, I got The Opportunity to Network, build your ISE
hooked and most of my most valued personal and
professional relationships have come from IISE conferences; connections:
10. Get Altitude on things, take time to ‘recharge’, reflect, • ISE Practitioner Leadership Mixer—(special by invitation mixer
reinvent…. for Industry Practitioners, Young Professionals, and Students,
Sunday 5-6:45)
11. Have a Hurricane!!
https://www.iise.org/Annual/Contact us for More Info:
Thank You! For more information on how IISE can play a role with
your Professional Development needs:
James Swisher: jswisher@iise.org
For questions about our IISE Webinar Series and our
IISE Operational Analytics Certification Program or
about CISE:
Scott Sink: ssink@jumpcurves.com
Special Thanks to our Sponsors for this
Webinar:
https://www.thepoiriergroup.com/
For more information on how the Poirier Group can play a role with
your Operational Excellence and organizational transformations
please contact:
Jared Frederici: jared.frederici@thepoiriergroup.com
https://www.linkedin.com/in/jaredfrederici/
46You can also read