Results Presentation FY 2016 - 28 November 2016 - Parques Reunidos
←
→
Page content transcription
If your browser does not render page correctly, please read the page content below

Results Presentation FY 2016
28 November 2016
Disclaimer

This document does not constitute or form part of any purchase, sales or exchange offer, nor is it an invitation to draw up a purchase sales or exchange offer, or advice on any stock issued by Parques Reunidos Servicios
Centrales, S.A. (“Parques Reunidos”). Nor shall this document or any part of it form part of any offer for sale or solicitation of any offer to buy any securities on the basis of or be relied on in connection with any contract or
commitment to purchase shares.

Neither this document nor any information contained herein may be reproduced in any form, used or further distributed to any other person or published, in whole or in part, for any purpose, except that information may be
extracted herefrom and used in equity research reports about Parques Reunidos in compliance with the applicable regulations. Failure to comply with this obligation may constitute a violation of applicable securities laws and/or
may result in civil, administrative or criminal penalties.

This document is not for publication, release, disclosure or distribution, directly or indirectly, in, and may not be taken or transmitted into the United States, Canada, South Africa, Japan or Australia, and may not be copied,
forwarded, distributed or transmitted in or into the United States, Canada, South Africa, Japan, Australia or any other jurisdiction where to do so would be unlawful. The distribution of this document in other jurisdictions may also
be restricted by law and persons into whose possession this document comes should inform themselves about, and observe, any such restrictions. Any failure to comply with such restrictions may constitute a violation of the laws
of the United States, Canada, South Africa, Japan or Australia or any other such jurisdiction.

This document may include, in addition to historical information, forward-looking statements about revenue and earnings of Parques Reunidos and about matters such as its industry, business strategy, goals and expectations
concerning its market position, future operations, margins, profitability, capital expenditures, capital resources and other financial and operating information. Forward-looking statements include statements concerning plans,
objective, goals, strategies, future events or performance, and underlying assumptions and other statements, which are other than statements of historical facts. The words “believe”, “expect”, “anticipate”, “intends”, “estimate”,
“forecast”, “project”, “will”, “may”, “should” and similar expressions may identify forward-looking statements. Other forward looking statements can be identified from the context in which they are made. These forward-looking
statements are based on numerous assumptions regarding the present and future business strategies of Parques Reunidos and the environment in which Parques Reunidos expects to operate in the future. These forward-looking
statements involve known and unknown risks, uncertainties and other factors, which may cause the actual results, performance or achievements of Parques Reunidos, or industry results, to be materially different from those
expressed or implied by these forward-looking statements. None of the future projections, expectations, estimates or prospects in this presentation should be taken as forecasts or promises nor should they be taken as implying
any indication, assurance or guarantee that the assumptions on which such future projections, expectations, estimates or prospects have been prepared are correct or exhaustive or, in the case of the assumptions, fully stated in
the presentation. Many factors could cause the actual results, performance or achievements of Parques Reunidos to be materially different from any future results, performance or achievements that may be expressed or implied
by such forward-looking statements. Should one or more of these risks or uncertainties materialise, or should underlying assumptions prove incorrect, actual results may vary materially from those described herein as anticipated,
believed, estimated, expected or targeted. As a result of these risks, uncertainties and assumptions, you should not place undue reliance on these forward-looking statements as a prediction of actual results or otherwise.

Current and future analysts, brokers and investors must operate only on the basis of their own judgment taking into account this disclaimer, as to the merits or the suitability of the securities for its purpose and only on such
information as is contained in such public information having taken all such professional or other advice as its considers necessary or appropriate in the circumstances and not reliance on the information contained in the
Presentation. In making this Presentation available, Parques Reunidos gives no advice and makes no recommendation to buy, sell or otherwise deal in shares in Parques Reunidos or in any other securities or investments
whatsoever. These analysts, brokers and investors must bear in mind that these estimates, projections and forecasts do not imply any guarantee of Parques Reunidos ´s future performance and results, price, margins, exchange
rates, or other events, which are subject to risks, uncertainties and other factors beyond Parques Reunidos ´s control, such that the future results and the real performance could differ substantially from these forecasts,
projections and estimates.

The information in this document, which does not purport to be comprehensive, has not been independently verified and will not be updated. The information in this document, including but not limited to forward-looking
statements, applies only as of the date of this document and is not intended to give any assurances as to future results. Parques Reunidos expressly disclaims any obligation or undertaking to disseminate any updates or
revisions to the information, including any financial data and any forward-looking statements, contained in this document, and will not publicly release any revisions that may affect the information contained in this document and
that may result from any change in its expectations, or any change in events, conditions or circumstances on which these forward-looking statements are based or whichever other events or circumstances arising on or after the
date of this document.

Market data and competitive position used in this document not attributed to a specific source are estimates of Parques Reunidos and have not been independently verified. In addition this document may contain certain financial
and other information in relation to other companies operating in the leisure sector. This information has been derived from publicly-available sources and Parques Reunidos accepts no responsibility whatsoever and makes no
representation or warranty expressed or implied for the fairness accuracy, completeness or verification of such information.

Certain financial and statistical information contained in this document is subject to rounding adjustments. Accordingly, any discrepancies between the totals and the sums of the amounts listed are due to rounding. Certain
management financial and operating measures included in this document, including number of visitors or revenues per capita, have not been subject to a financial audit or have been independently verified by a third party. In
addition, certain figures contained in this document, which have also not been subject to financial audit, are combined and pro forma figures.

None of Parques Reunidos nor any of its employees, officers, directors, advisers, representatives, agents or affiliates shall have any liability whatsoever (in negligence or otherwise, whether direct or indirect, in contract, tort or
otherwise) for any loss howsoever arising from any use of this document or its contents or otherwise arising in connection with this document.

The information contained in this presentation does not constitute investment, legal, accounting, regulatory, taxation or other advice and the information does not take into account your investment objectives or legal, accounting,
regulatory, taxation or financial situation or particular needs. You are solely responsible for forming your own opinions and conclusions on such matters and the market and for making your own independent assessment of the
information. You are solely responsible for seeking independent professional advice in relation to the information contained herein and any action taken on the basis of the information contained herein. No responsibility or
liability is accepted by any person for any of the information or for any action taken by you or any of your officers, employees, agents or associates on the basis of such information.

By attending the presentation or receiving this document you agree to be bound by the foregoing limitations.

                                                                                                                                                                                                                                            2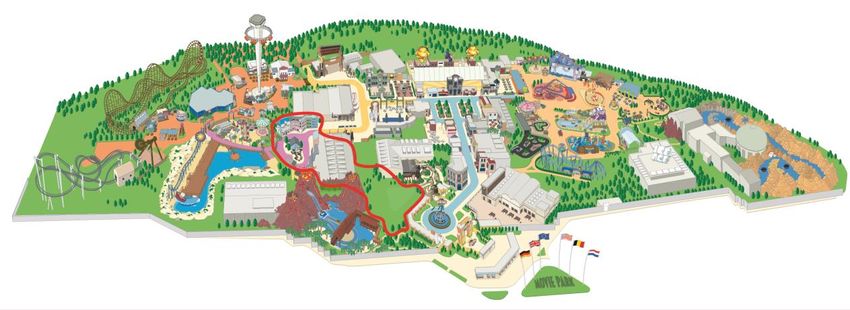
1. 2016 Financial Performance

2. Strategic Outlook

3. Appendix

                                3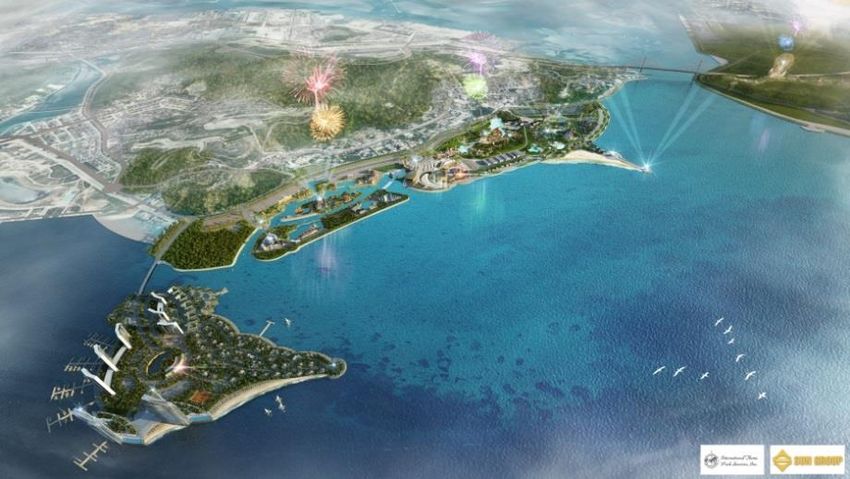
Key Highlights
Strong performance achieved in the Spain and Rest of Europe (excluding Marineland)
Offset by external factors:
‒ Abnormally adverse weather conditions in the US
2016 Key
developments ‒ The attack suffered in Nice that affected Marineland
Reached a pro-forma Net Income of €76 MM in 2016 and reduced Net Debt up to €540 MM,
driven by IPO proceeds and cash generation of the business
Dividend proposal: €20 MM or 26% pay-out ratio on the back of 2016 pro-forma Net Income
High single EBITDA digit growth expected for 2017
Strong underlying organic growth potential
‒ Multiple top-line initiatives to grow attendance and percaps
‒ €33 MM of expansion capex projects
Strategic Outlook The company continues successfully implementing its external growth strategy
− Dubai and Vietnam openings are on track (Bollywood already open)
− Ongoing conversations for new potential management contracts across different regions
− 5 MECs lease agreements signed and over 20 additional projects being negotiated
− Agreement reached with Lionsgate and ongoing negotiations with other global brands
− Active in acquisitions
4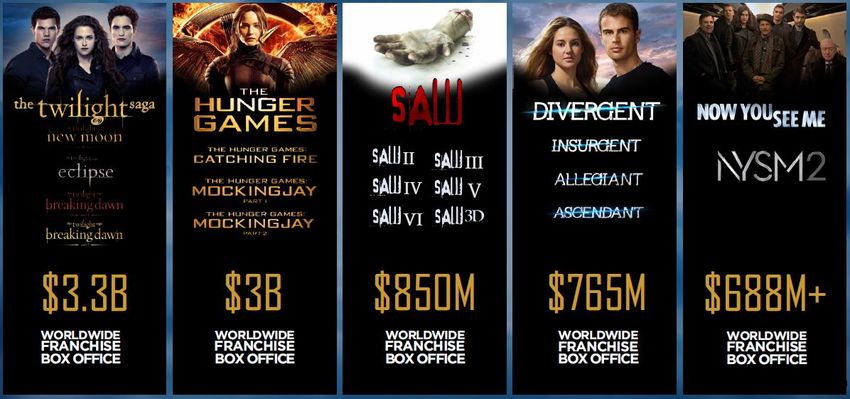
Parques Reunidos Group
FY16 Results
Strong performance delivered Group Like for Like
in Spain and Rest of Europe € MM 2015 2016 Var.
(excluding Marineland) Visitors (000's) 20.170 19.814 (1,8%)
Offset by two external factors Total Percap 29,3 29,5 0,5%
Abnormally adverse weather conditions in the
Ticketing Percap 15,8 15,7 (0,5%)
North East region of the US
The devastating attack suffered in Nice (France) In-park Percap 11,7 11,8 0,9%
in July affecting Marineland performance
Total Revenue 591,2 584,0 (1,2%)
Results
1.2% decrease in like-for-like revenues
EBITDAR 208,8 202,1 (3,2%)
2.9% decrease in like-for-like EBITDA
Achieved an adjusted net income of € 75.9 MM % margin 35,3% 34,6%
benefitted from new capital structure post IPO
EBITDA 193,9 188,4 (2,9%)
% margin 32,8% 32,3%
Proforma Net Income 19,8 75,9 n.m.
% margin 3,4% 13,0%
Recurrent capex 60,4 72,5 20,1%
% revenue 10,2% 12,4%
5
Financial performance overview

                                                             Like-for-like Revenue bridge

€ MM

 625      605.5                                                           6.1                5.2
                                                          591.2                                                                                  583.9
                         (6.0)             (8.3)                                                            (9.0)
                                                                                                                        (9.1)      (0.5)
 550

 475

 400
         FY 2015       FX Impact      Valencia       FY 2015 LFL          Spain            ROE           Marineland     US          HO        FY 2016 LFL
         Reported                     Oceano-                                            excluding
                                      graphic                                            Marineland

                                                             Like-for-like EBITDA bridge

€ MM

225

                                                                                   5.3             3.1
        194.8                                       4.8           193.9
                                                                                                                                                 188.4
                      (1.9)                                                                                     (5.4)
                                   (3.8)                                                                                   (7.4)      (1.1)
175

125
       FY 2015      FX Impact    Valencia          Warner     FY 2015             Spain        ROE      Marineland         US         HO        FY 2016
       Reported                  Oceano-           Lease        LFL                          excluding                                            LFL
                                 graphic                                                     Marineland
                                                                                                                                                            6
Spain
FY16 Results
Strong performance in Spain Spain Like for Like
€ MM 2015 2016 Var.
Strong macro conditions Visitors (000's) 6,179 6,357 2.9%
Continued improvement of Spanish macro-
economic conditions
Total Percap 21.2 21.6 1.8%
Successful commercial policies
Ticketing Percap 11.9 12.3 3.2%
Dynamic pricing
In-park Percap 8.1 8.4 2.7%
Improved promotional activity, reducing non-
paying visitors
Improvement of in-park consumption offering Total Revenue 131.2 137.3 4.7%
Key attractions and improvements
introduced EBITDAR 53.4 57.7 7.9%
New terror maze and Paw Patrol IP at PAM
% margin 40.7% 42.0%
New Batman show at Warner
Re-theming of Villanueva and Costa Daurada
water parks during the past 3 years is paying off EBITDA 50.3 55.6 10.5%
Strong operating leverage achieved % margin 38.4% 40.5%
EBITDA drop through of 86%
Recurrent capex 9.7 10.3 6.7%
% revenue 7.4% 7.5%
7
Rest of Europe (Excluding Marineland)
FY16 Results
Good performance in Rest of ROE Like for Like (Excluding Marineland)
Europe (excluding Marineland) € MM 2015 2016 Var.
Visitors (000's) 6,561 6,648 1.3%
Key commercial actions carried out
Total Percap 26.9 27.3 1.6%
Dynamic pricing
Focus on profitable visitors Ticketing Percap 14.4 14.7 2.2%
Mirabilandia return to a positive growth trend
In-park Percap 10.5 10.6 0.8%
Key attractions and improvements
introduced Total Revenue 176.2 181.3 2.9%
New western area at Mirabilandia
First virtual reality coaster at Bobbejaaland EBITDAR 60.3 63.5 5.3%
Successful second year attendance growth at
Slagharen in-door water park % margin 34.2% 35.0%
Strong operating leverage achieved EBITDA 58.9 62.1 5.3%
EBITDA drop through of 61%
% margin 33.5% 34.2%
Recurrent capex 17.5 26.7 52.9%
% revenue 9.9% 14.7%
8
Marineland
FY16 Results
Affected by external factors Marineland
€ MM 2015 2016 Var.
Visitors (000's) 1,071 699 (34.8%)
Key facts
Shut down of the park until March 16 due to the
floods suffered in October 15 Total Percap 35.6 n.m. n.m.
Devastating attack suffered in Nice
Ticketing Percap 19.5 n.m. n.m.
In-park Percap 12.6 n.m. n.m.
Performance
The park experienced a significant drop in
attendance Total Revenue 38.1 29.1 (23.6%)
New plan is being designed to boost
EBITDAR 13.5 8.0 (40.6%)
performance in the next two seasons
Focus on local demand % margin 35.3% 27.4%
Increase penetration of season passes
Recover our corporate event business
EBITDA 13.3 7.9 (40.9%)
Reposition the park based on educational
activities and our commitment to wildlife % margin 35.0% 27.1%
conservation and rescue & rehabilitation of
marine animals
Recurrent capex 5.0 4.7 (6.5%)
% revenue 13.2% 16.2%
9
US
FY16 Results
Adverse external conditions US Like for Like
€ MM 2015 2016 Var.
Delivered good performance under Visitors (000's) 6,358 6,110 (3.9%)
normalised external conditions
Dynamic pricing initiatives
Total Percap 37.6 37.6 0.1%
Continued improvement of in-park offering
Launch of new attractions Ticketing Percap 20.5 20.3 (0.7%)
‒ Phobia coaster at Lake Compounce In-park Percap 16.4 16.6 1.2%
‒ Noah´s Ark walk through at Kennywood
‒ Princess castle at Idlewild Total Revenue 239.0 229.9 (3.8%)
Achieved record season passes revenues:
+4.6% y-o-y growth EBITDAR 95.3 87.8 (7.9%)
% margin 39.9% 38.2%
Performance affected by adverse weather
conditions
EBITDA 85.4 77.9 (8.7%)
Abnormal weather conditions during the last
week of July and 1st half of August % margin 35.7% 33.9%
Recurrent capex 23.4 27.5 17.1%
% revenue 9.8% 11.9%
10Adverse External Conditions experienced in US
Adverse External Conditions US – Geographical Revenue Distribution
Adverse weather conditions in the North
East (c.60% of US revenues)
Historical record heat registered in Connecticut,
Pennsylvania and New York 5%
2nd wettest August in the history
Adverse conditions particularly affected 60%
the last week of July and 1st half of August
Substantial increase in humidity and rainy days
increase by (+71% or 62 operating days1)
21 %
Reduction of Latin American tourism to Florida
Impacted by Brazil Olympic games 14%
Strong dollar vs. local currencies with a
particular impact for Brazil, Mexico or
Venezuela
Note
1. Operating day means a day that a park of our portfolio is scheduled to open 11US - Analysis of Q4 Performance
Like-for-like Revenue bridge Like-for-like EBITDA bridge
€ MM € MM
85.4
2.6 77.9
239.0
2.3 229.9 (3.8)
(5.6) (0.7)
(3.5)
(7.9)
FY2015 YTD
YTDQ3 US affected…
Q3 US (Weeks US (Rest YTD Q3
Q3 Revenue
Q4 16Q4
vs16Minimum…
Minimum Cost FFY2016
wageManagement
USof Q4) FY2016 FY2015 YTDRevenue Q4 15 Cost Y2016
(Weeks affected vs Q4 15 increase management
(Rest of Q4)
by weather)
Revenue Var. 16 vs 15 Var. 16 vs 14 Q4 reactivity ratio of 36.5%
US (weeks affected by weather) (15.2%) (6.7%) Q4 reactivity ratio factoring increase in minimum
wage of 49%
US (Rest of Q4) 2.2% 8.4%
12Headquarter costs
FY16 Results
Highlights Headquarters Like for Like
€ MM 2015 2016 Var.
EBITDA drop of € 1.1MM mainly driven by
Increase in operating expenses as publicly Revenue 6.7 6.3 (7.1%)
traded company
Partially offset by a reduction in variable
remuneration EBITDA (14.1) (15.2) 7.8%
Capex 4.8 3.3 (30.8%)
13Net income
FY16 Results
Key P&L Items
Highlights
€ MM 2015 2016 2016 PF
Reported EBITDA 194.8 188.4 188.4
Achieved a PF Net Income of €76 MM adjusted for:
D&A (67.6) (68.6) (68.6)
‒ Non-recurrent expenses mainly linked to IPO related
Net losses on impairments (2.3) (2.3) (3.1)
expenses
Change in trade provisions (4.2) (0.8) (0.8)
‒ Annualised financial costs to reflect new capital
Other non-recurrent expenses (0.1) (25.6) 0.0
structure post IPO
Operating Profit 120.6 91.1 115.8
Financial income 0.6 0.3 0.3
Dividend proposal: €20 MM or 26% pay-out ratio on the
back of 2016 pro-forma Net Income
Financial costs (85.9) (70.9) (36.7)
Arrangement fees (8.2) (18.0) (4.8)
Exchange gains / (losses) (5.0) 2.7 2.7
EBT 22.1 5.4 77.4
Income tax (2.2) (1.8) (1.5)
Net income 19.8 3.5 75.9
Attributable to Parent shareholders 20.1 3.9 76.2
Non-controlling interests (0.3) (0.4) (0.4)
14Cash Flow Generation and Net Debt Position
FY16 Results
2015-16 Net Debt Position Bridge
€ MM
1.150
1,046.8
72.2
1.000 7.6
80.0 2.4
850
(188.4)
700
44.2 539.8
550
(525.0)
400
250
Net EBITDA Capex Changes Taxes Interest IPO Extraordinary Net
Debt in WC Proceeds Items and Debt
2015 Others 2016
Leverage 5.4x 2.9x
151. 2016 Financial Performance
2. Strategic Outlook
3. Appendix
162017 Outlook
2017 Outlook
High single EBITDA digit growth:
‒ Spain and Rest of Europe (excluding) Marineland to grow mid-single digit
‒ US expected to benefit from more benign operating conditions
‒ Gradual recovery of Marineland
‒ Partial contribution from Dubai and Vietnam management contracts
172017 Growth Initiatives
1 2 3 4
Top-line growth Management
Expansion Capex MECs
initiatives Contracts
Season Passes 4 new projects Dubai opening 5 lease agreements
signed
IPs €33 MM capex Vietnam
Strong pipeline
Off season events 20% ROIC Ongoing active
negotiations Lionsgate agreement
Ticketing and In-Park
revenue New potential
licensing agreements
New attractions
Virtual Reality
+
Selective Acquisition Strategy
181 Top line initiatives
Season passes
Strong potential to continue growing in season passes, bringing more loyal customers, enhancing visibility of
earnings and reducing the impact of weather on the business
Penetration of Season passes Key Initiatives
% of 2016 Ticketing Revenue
18% Include entry level passes with limited advantages
16.1%
16%
14% 13.4% Launch multi-tier season passes with different
12% 11.4%
advantages and prices
10%
8%
Up-selling initiatives
6%
4.5%
4%
Marketing campaigns
2%
‒ Black Friday sale
0%
Group Spain RoE US ‒ Christmas campaign
‒ Exclusive events targeting pass holders
191 Top line initiatives
New IP Licensing Agreements
We operate very strong regional brands and, when convenient, we leverage on other brands
We have shown our ability to
Movie Park Germany
obtain hot brands
Start Trek IP license
‒ 10 year agreement in connection with
a themed area at Movie Park Germany
‒ The first and only Star Trek themed
coaster worldwide
‒ 2nd largest coaster at Movie Park
201 Top line initiatives
Expand the season – Off season events
Off season revenues are growing on the back of off season events
Key Initiatives 2016 Halloween Season
+18% revenue growth achieved in 2016 Halloween
season(1)
Continue to roll-out existing off season events
Extend length of the events (more days)
Extend length of stay (more hours)
Develop and roll-out new off season events:
Spring and late Summer
Note
1. Only includes revenues from those parks with Halloween event 211 Top line initiatives
Ticketing Revenues
Yield Management Dynamic Pricing
Push high yield channels and increase percaps in each
Flexible pricing structure
channel
‒ Price established per day according to visitor
demand
Reduced discounts along the season by increasing low ‒ Five different scenarios
promotions discounts (15%-25%) and reducing strong ‒ Price adjusted depending on booked demand
promotions discounts (25%-40%)
Control and restrict number of coupons that are launched
to the market (i.e.: online coupons, urban check tickets)
Status of implementation (direct channels)
‒ In 2015: 5 parks in Spain in 2015
Include Blackout dates in promotions for high attendance ‒ In 2016:
days (i.e.: Halloween or 15th August in Summer)
‒ Rest of Spanish portfolio and rest of Europe
‒ US: Flexible calendar pricing at Splish Splash
Reduce period to redeem promotions to create a sense ‒ In 2017:
of urgency to the customer and avoid discounting during ‒ Spain and rest of Europe: 2nd / 3rd season with
high attendance periods dynamic pricing
‒ US: Flexible calendar pricing at water park
portfolio and Kennywood
Increase prices associated to new attractions or events
221 Top line initiatives
In Park revenues
Parques Reunidos is always pursuing new ways to raise in-park per caps
Key Actions Examples
Develop branded partnerships
Improve facilities
Introduce new upcharge experiences
Enhance throughput
Introduce all-inclusive offers
Offer VIP products and services
CRM initiatives
231 Top line initiatives
New attractions coming in 2017
New attractions are a key factor to drive attendance and increase percaps
Recurrent capex (maintenance and new attractions) represent 10-11% of annual revenues
PAM: Extension of Nickelodeon Area (c.€4.5 MM) Slagharen: Coaster Gold Rush (c.€5 MM)
Dutch Wonderland: Suspended Coaster (c.€7 MM) Lake Compounce: Phobia Coaster (2016)
241 Top line initiatives
New Virtual Reality Coasters
Key Benefits Examples
Bobbejaaland (2016 Seasson)
Improves guest experience
The first virtual reality
coaster in the
Benelux
In partnership with
Upcharge experience
Samsung
The Revolution, one
of the most popular
family rides
Reduces capital needs
Coming in 2017 Season
Flexibility to easily update VR
themes every season or during Batman´s Escape @ Warner Sky Rocket Coaster @ Kennywood
the same season
Potential extend VR capabilities
to other rides
252 Expansion capex
Expansion capex: 2017 projects (I)
4 projects identified and approved for development in 2017 and are expected to open in 2017 /18
Represent c.€33 MM of investment to be incurred in 2017 and 2018
Warner Park: Expansion of Warner Beach Slagharen: Extension of lodging facilities
Investment: c.€8 MM Investment: c.€8 MM
Strategic rationale Strategic rationale
‒ Extend length of stay with more content for a 2 day visit ‒ Expand capacity of the existing lodging
‒ Expand catchment area ‒ Increase off season attendance on the back of the new
indoor water park
‒ Enhance product offering
‒ Improve story telling experience and upgrade existing
Expected ROIC: +20% facility
Expected ROIC: +20%
262 Expansion capex
Expansion capex: 2017 projects (II)
4 projects identified and approved for development in 2017 and are expected to open in 2017 /18
Represent c.€33 MM of investment to be incurred in 2017 and 2018
Story Land: Living Shores Aquarium
Investment: c.€4 MM
Strategic rationale
‒ Indoor aquarium in the New Hampshire White
Mountains (popular destination in summer for outdoor
recreation and winter for skiing)
‒ Strong product bundling options (2 day stay, hotel
packages and annual passes)
‒ Year round operation
Expected ROIC: +20%
273 Management Contracts
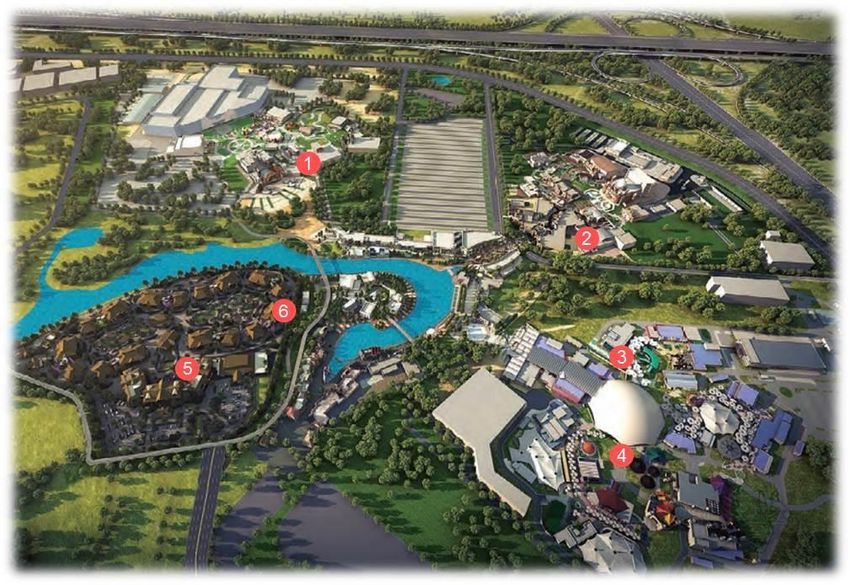
Dubai Parks
A $2,900 MM premier year-round regional leisure and entertainment destination
MotionGate and Bollywood parks expected to represent the largest investments in the entire leisure destination
Bollywood open in November and Motiongate opening is expected for December
4 themed zones: Studio
Central, DreamWorks,
Smurfs Village and Sony
Pictures Studios
27 attractions located in
an open park
Key brands: Shrek,
Madagascar, Kung Fu
Panda and How to Train
Your Dragon
Licensed IPs:
DreamWorks, Sony
Pictures and Lionsgate
Operated by: Six themed zones:
Bollywood Boulevard,
Mumbai Chowk, Rustic
1 2 Ravine, Bollywood Film
Studios, Hall of Heroes
and Royal Plaza (includes
3 4 Rajmahal theatre with
separate ticketing)
16 different rides
5 6 Licensed IP from
Bollywood film studios
283 Management Contracts
Vietnam
Recently awarded a new management contract in Vietnam; expanding our presence into Asia
Parks are expected to open by march 2017
Key Terms of the Agreement
10 year management contract with Sun Group to operate a
theme park and a water park in Vietnam
Expected opening date: March 2017
First class theme park and water park located in Ha Long
City with 214 hectares
Fees structure
− Development fee
− Management fee: Variable fee based on performance
(linked to both revenues and EBITDA) and with a
minimum fee guaranteed
294 MECs
MECs: Strong pipeline of opportunities
Already accomplished our 2017-18 goals
Large and growing pipeline
On going conversations to analyse new potential projects are taking place
Lease
Real Estate Expected
MECs Location Concept Agreement
Operator Opening
Signed
THADER Murcia, Spain Metrovacesa Nickelodeon Mar-16 Q4-17
LAKESIDE London, UK Intu Nickelodeon May-16 Q4-18
Signed
Contracts
LISBON Lisbon, Portugal Intu Nickelodeon Jul-16 Q1-18
XANADU Madrid, Spain Ivanhoe Nickelodeon Jul-16 Q2-18
XANADU Madrid, Spain Ivanhoe Aquarium Jul-16 Q1-18
Over 20 additional situations being discussed and at different stages
Pipeline
Provides high visibility to accomplish our targets for the period 2017-20
304 MECs
MECs: Parques Reunidos & Lionsgate Agreement
Key Highlights Hit Movies and Global Franchise
Strategic agreement to
develop Lionsgate
branded MECs
Highly recognizable
brands
Expansion of our MECs
footprint into the young
adult market
Proven capacity to
reach major global
alliances
Enhanced visibility of
our MECs growth
potential
311. 2016 Financial Performance
2. Strategic Outlook
3. Appendix
32Parques Reunidos Group
FY16 Results
Rest of Europe
Like for Like figures Group Spain Marineland US HQ
(Excluding Marineland)
€ MM 2015 2016 Var. 2015 2016 Var. 2015 2016 Var. 2015 2016 Var. 2015 2016 Var. 2015 2016 Var.
Visitors (000's) 20,170 19,814 (1.8%) 6,179 6,357 2.9% 6,561 6,648 1.3% 1,071 699 (34.8%) 6,358 6,110 (3.9%)
Total Percap 29.3 29.5 0.5% 21.2 21.6 1.8% 26.9 27.3 1.6% 35.6 n.m. n.m. 37.6 37.6 0.1%
Ticketing Percap 15.8 15.7 (0.5%) 11.9 12.3 3.2% 14.4 14.7 2.2% 19.5 n.m. n.m. 20.5 20.3 (0.7%)
In-park Percap 11.7 11.8 0.9% 8.1 8.4 2.7% 10.5 10.6 0.8% 12.6 n.m. n.m. 16.4 16.6 1.2%
Total Revenue 591.2 584.0 (1.2%) 131.2 137.3 4.7% 176.2 181.3 2.9% 38.1 29.1 (23.6%) 239.0 229.9 (3.8%) 6.7 6.3 (7.1%)
EBITDAR 208.8 202.1 (3.2%) 53.4 57.7 7.9% 60.3 63.5 5.3% 13.5 8.0 (40.6%) 95.3 87.8 (7.9%)
% margin 35.3% 34.6% 40.7% 42.0% 34.2% 35.0% 35.3% 27.4% 39.9% 38.2%
EBITDA 193.9 188.4 (2.9%) 50.3 55.6 10.5% 58.9 62.1 5.3% 13.3 7.9 (40.9%) 85.4 77.9 (8.7%) (14.1) (15.2) 7.8%
% margin 32.8% 32.3% 38.4% 40.5% 33.5% 34.2% 35.0% 27.1% 35.7% 33.9%
Recurrent capex 60.4 72.5 20.1% 9.7 10.3 6.7% 17.5 26.7 52.9% 5.0 4.7 (6.5%) 23.4 27.5 17.1% 4.8 3.3 (30.8%)
% revenue 10.2% 12.4% 7.4% 7.5% 9.9% 14.7% 13.2% 16.2% 9.8% 11.9%
33Profit & Loss account
FY16 Results
P&L Summary Reported Like-for-Like (excluding Marineland)
€ MM 2015 2016
Visitors (000's) 20,963 19,814
% growth (5.5)%
Percap (€) 28.9 29.5
% growth 2.0%
Revenues 605.5 584.0
% growth (3.6)%
Cost of sales (69.0) (65.7)
Gross Profit 536.5 518.3
% margin 88.6% 88.7%
Personnel expenses (168.6) (167.4)
Other operating expenses (173.1) (162.5)
EBITDA 194.8 188.4
% margin 32.2% 32.3%
D&A (67.6) (68.6)
% revenues (11.2)% (11.7)%
EBIT 127.3 119.8
% margin 21.0% 20.5%
Net losses on impairments (2.3) (2.3)
Change in trade provisions (4.2) (0.8)
Other non-recurrent expenses (0.1) (25.6)
Operating Profit 120.6 91.1
Financial income 0.6 0.3
Financial Cost (85.9) (70.9)
Arrangement fees (8.2) (18.0)
Exchange gains / (losses) (5.0) 2.7
EBT 22.1 5.4
Income tax (2.2) (1.8)
Net income 19.8 3.5
Attributable to Parent shareholders 20.1 3.9
Non-controlling interests (0.3) (0.4)
34Balance sheet
FY16 Results
Assets Equity and Liabilities
FY15 FY16 FY15 FY16
€ MM (30 Sept. 15) (30 Sept. 16) Var. € MM (30 Sept. 15) (30 Sept. 16) Var.
Property, plant and equipment 832.7 877.3 44.6 Share capital 23.4 40.4 16.9
Goodwill 680.7 640.6 (40.1) Share premium 819.5 1,327.5 508.1
Intangible assets 418.2 427.8 9.6 Other reserves (283.7) (268.9) 14.8
Non-current financial assets 39.1 44.4 5.3 Other comprehensive income 29.9 29.0 (0.9)
Retained earnings(Parent) 20.1 3.9 (16.2)
Deferred tax assets 37.2 48.8 11.5
Equity (Parent) 609.2 1,131.8 522.7
Total non-current assets 2,008.0 2,038.9 30.9
Non- controlling interests 0.9 0.5 (0.4)
Inventories 22.6 23.9 1.2
Total equity 610.0 1,132.3 522.3
Trade and other receivables 34.5 28.0 (6.5) Financial liabilities from issuing bonds 377.6 - (377.6)
Current tax assets 0.4 0.7 0.2 Loans and borrowings 774.3 560.7 (213.7)
Other current financial assets 28.7 - (28.7) Finance lease 52.6 53.5
Other current assets 7.6 6.5 (1.0) Deferred tax liabilities 242.2 246.9 4.7
Cash and cash equivalents 151.1 110.0 (41.1) Provisions 11.7 11.4 (0.2)
Total current assets 244.9 169.0 (75.9) Other non-current liabilities 44.1 43.8 (0.2)
Total assets 2,253.0 2,208.0 (45.0) Total non-current liabilities 1,502.5 916.3 (586.2)
Financial liabilities from issuing bonds 14.7 - (14.7)
Loans and borrowings 0.7 33.0 32.3
Finance lease 4.9 4.9
Trade and other payables 107.8 109.7 1.9
Current tax liabilities 4.3 1.9 (2.4)
Other current liabilities 8.0 9.7 1.8
Total current liabilities 140.4 159.3 18.9
Total liabilities 1,642.9 1,075.6 (567.3)
Total equity and liabilities 2,253.0 2,208.0 (45.0)
35You can also read