Research on Vibration Reduction Method of Nonpneumatic Tire Spoke Based on the Mechanical Properties of Domestic cat's Paw Pads - Hindawi.com
←
→
Page content transcription
If your browser does not render page correctly, please read the page content below
Hindawi
Applied Bionics and Biomechanics
Volume 2021, Article ID 9976488, 16 pages
https://doi.org/10.1155/2021/9976488

Research Article
Research on Vibration Reduction Method of Nonpneumatic Tire
Spoke Based on the Mechanical Properties of Domestic cat’s
Paw Pads

          Haichao Zhou ,1 Huiyun Li ,1 Ye Mei ,1 Guolin Wang,1 Congzhen Liu,2
          and Lingxin Zhang3
          1
            School of Automotive and Traffic Engineering, Jiangsu University, Zhenjiang 212013, China
          2
            School of Transportation and Vehicle Engineering, Shandong University of Technology, Zibo 255000, China
          3
            AEOLUS Tyre Co. Ltd., Jiaozuo 454003, China

          Correspondence should be addressed to Ye Mei; 2111704004@stmail.ujs.edu.cn

          Received 24 March 2021; Revised 8 April 2021; Accepted 6 May 2021; Published 17 May 2021

          Academic Editor: Donato Romano

          Copyright © 2021 Haichao Zhou et al. This is an open access article distributed under the Creative Commons Attribution License,
          which permits unrestricted use, distribution, and reproduction in any medium, provided the original work is properly cited.

          Although there is no risk of puncture, the vibration problem caused by discontinuous structures limits nonpneumatic tire
          development (NPT). The vibration reduction of nonpneumatic tires is a solvable urgent problem. This current study analyzed
          the dynamic grounding characteristics and the vibration reduction mechanism of the cat’s paw pads and then applied the
          mechanical properties to the bionic design of nonpneumatic tire spokes to solve the vibration problem. Domestic cats’ paw
          pads’ dynamic grounding characteristics were determined using the pressure-sensitive walkway, high-speed camera, and
          VIC-2D. The results indicated that the mechanical characteristics of swing deformation of paw pads during the grounding
          process attenuated the grounding stress and buffered the energy storage to achieve the vibration reduction effect. According
          to the similarity transformation, a finite element model of NPT that could accurately reconstruct the structure and
          realistically reflect the load deformation was employed. The structure design of asymmetric arcs on the spokes’ side edges
          was proposed, and it can effectively reduce the radial excitation force of NPT. The three parameters, the asymmetric arc,
          the thickness, and the curvature of spokes, were used as design variables to maximize the vibration reduction. The
          orthogonal experimental, the Kriging approximate model, and the genetic algorithm were carefully selected for optimal
          solutions. Compared with the original tire, the results showed that peak amplitude 1, peak amplitude 2, and the root
          square of the optimized tire’s amplitudes were reduced by 76.07%, 52.88%, and 51.65%, respectively. These research results
          offer great potential guidance in the design of low-vibration NPT.

1. Introduction                                                        launched by Bridgestone have emerged [4]. These include
                                                                       the honeycomb structure tires which are jointly developed
As the only direct contact medium between the vehicle                  by Resilient Technologies and the University of Wisconsin-
and the road, the tire directly affects the steering stability,         Madison Polymer Engineering Center [5] and i-Flex non-
driving the vehicle’s safety and riding comfort. However,              pneumatic safety tire designed by Hankook [6]. Similarly,
traditional pneumatic tires have safety hazards such as                “N-wheel” nonpneumatic tire with negative Poisson’s ratio
punctures and air leaks, which seriously affect safe vehicle            spoke structure was developed by Tianqu Non-Pneumatic
driving [1]. Therefore, nonpneumatic tires (NPT) have                  Wheel Technology Co., Ltd. and BAIC Group [7]. Mechani-
demonstrated development advantages regarding safety,                  cal elastic wheel was also proposed by Zhao Youqun of
economy, environmental protection, and wear resistance                 Nanjing University of Aeronautics and Astronautics [8, 9].
[2]. Since the advent of Michelin’s Tweel tire [3], a variety          And nonpneumatic tires with different support structures
of nonpneumatic tires such as the Air Free Concept                     such as truss, octagonal and gradient elasticity [10–12] are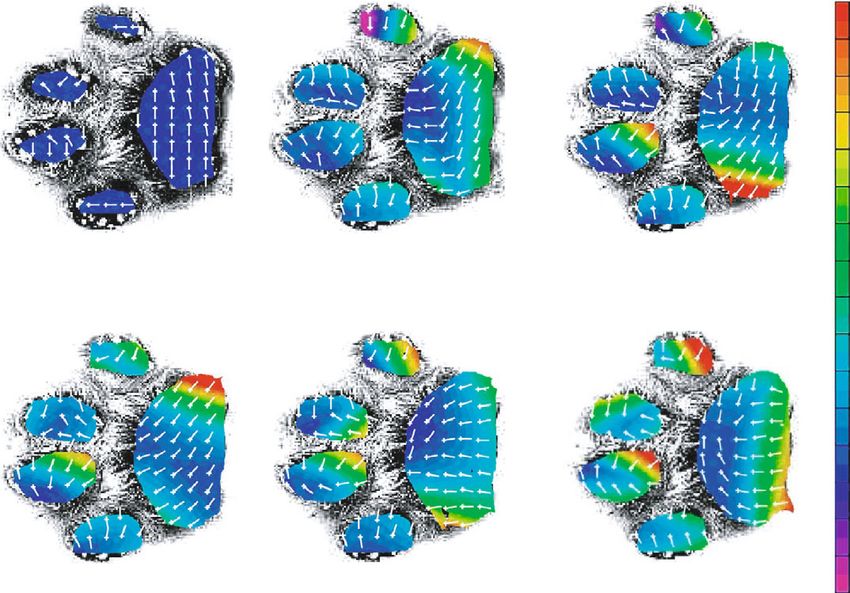
2                                                                                                          Applied Bionics and Biomechanics

                                                                                       Glass plate          V

                 The walkway                                                              White light

           The high-speed camera                                                                                       High-speed camera

                          (a)                                                             (b)

                      Figure 1: The contact tests of paw pads: (a) contact pressure test and (b) contact strain test.

but few of the evolution in nonpneumatic tire research,
design, and development.                                                                                        5th
     Peculiar to all these innovations is a prominent vibration
problem associated with nonpneumatic tires, which limits                                             4th
the speed of vehicles running on nonpneumatic tires. This                                                             Palm pad
remains a challenge in the development of nonpneumatic
                                                                                                 3rd
tires. Consequently, vibration reduction has become one of
the key areas of improvement in the development of non-
pneumatic tires. Compared with the better uniformity of                                                      2nd
mass distribution of pneumatic tires, the discontinuous sup-
port structures of nonpneumatic tires introduce nonuniform                               Figure 2: The paw pad of the cat.
mass distribution, causing nonuniform stiffness that results
in a local vibration effect [13–15]. As a replacement for pneu-
matic tires’ air pressure, the nonpneumatic tires’ spokes play          ceived stimuli, making them greatly adaptable and compliant
the role of supporting, cushioning, damping, and providing              to environmental changes, to be effective and reliable. The
force [16, 17]. Hence, this has made the design of spokes a             locust’s strong jumping ability allows it to avoid predators
key focus of various studies on nonpneumatic tires. Manga               and start flying, and the combined action of the rigid claws
[18] found that the spoke vibration was not a forced vibration          and the adhesive pads ensures that the static contact between
related to the rolling speed but a resonance excited by the             tarsus and ground, which can achieve a smooth jump on a
buckling and rebound phenomena when the spoke entered                   smooth surface; in addition, the large take-off angles also
and left the contact zone. Bezgam [19] obtained the contribu-           allow locusts to achieve better performance on smooth sur-
tion of spoke shape parameters to spoke vibration through               faces, which provides inspiration for the jumping robot
orthogonal experiment, adjusted the thickness and curvature             design [23]. When catching prey, cats need to have a strong
of adjacent spoke pairs based on this, and proposed the                 ability to reduce vibration, so as to weaken the impact from
design concept of alternate spoke pairs to reduce the ampli-            the ground and achieve characteristic silence. As the only
tudes of spokes and ground vibration. Proddaturi [20]                   body part in contact with the ground, the paw pads play an
proved in his research that the spokes’ length and curvature            important role in vibration reduction realization. Mei et al.
have the greatest influence on vibration, followed by the                [24] obtained the mechanical and grounding shape represen-
thickness of the shear beam, the thickness of spokes, and               tations by conducting ground reaction force and contact
the number of spokes. The thickness of the inner and outer              strain experiments on the paw pads of domestic cats in vari-
coverages and the inner and outer DeRad were reported to                ous gaits, so as to explore the adaptive adjustment of the
have less influence. When adjusting the shear modulus of                 mechanical characteristics and shape of the paws in various
the spokes, Narasimhan [21] concluded that the change of                gaits. Biewener [25] concluded that, during exercise, cats’
the material led to the change of stiffness, and the increase            paw pads can effectively buffer the ground’s vertical reaction
of the stiffness caused the spoke vibration to decrease. Mean-           force that is 2-3 times the value of their body weight. Zhang
while, the spoke material’s change had a greater impact on              et al. [26] carried out a theoretical analysis of the paw pads’
the spoke vibration than the shear band material’s change.              vibration reduction characteristics according to the changing
     In the long-term evolution of animals, a variety of biolog-        law of the vertical ground reaction force as the cat fell on the
ical structures and functional characteristics highly adaptable         ground and constructed a mass-spring viscoelastic mechani-
to nature have been formed. Researchers use these principles            cal model. For the bionic research of nonpneumatic tires, a
to invent and innovate technologies. For example, Romano                nonpneumatic tire developed by the Madison Polymer
et al. [22] found in the study of the escape direction of               Research Center, Wisconsin, USA, uses a bionic honeycomb
Locusta migratoria a high plasticity of those escape motor              structure [27], and the hexagonal honeycomb-like structure
outputs that are occurring almost in real time with the per-            is recognized in the field of coupled bionics as a structure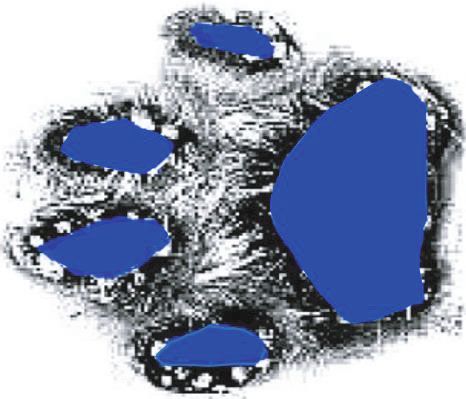
Applied Bionics and Biomechanics                                                                                                        3

                     Table 1: Peak vertical ground reaction force in each area of the fore and hind paw pads of cats.

                                                                 Peak vertical ground reaction force (%BW)
Pads
                            2nd toe pad                 3rd toe pad               4th toe pad            5th toe pad           Palm pad
Fore paw pad                 10:9 ± 1:3                 14:6 ± 2:3                11:7 ± 1:8                   8:7 ± 1:1       37:2 ± 4:4
Hind paw pad                 8:3 ± 0:9                  12:1 ± 1:5                10:2 ± 1:7                   3:9 ± 0:6       25:1 ± 3:2

                                                                                                        e1 [%] –
                                                                                                        lagrange
                                                    Y                                                      15.85
                                         5th
                                                                                                           14.63
                                  4th                                                                      13.4
                                                                                                           12.17
                                 3rd                                                                       10.94
                                                                                                           9.717
                            X           2nd
                                                                                                           8.489
                                                                                                           7.262
                                Reference diagram           t = 0.055 s               t = 0.105 s
                                                                                                           6.035
                                                                                                           4.808
                                                                                                           3.581
                                                                                                           2.353
                                                                                                           1.126
                                                                                                           –0.1009
                                                                                                           –1.328
                                                                                                           –2.555
                                   t = 0.180 s              t = 0.235 s               t = 0.290 s          –3.782

                                   Figure 3: The contact strain results of fore paw pad (t total = 0:300 s).

with good buffering and energy absorption characteristics                  natural vibration reduction under normal walking gait and
[28, 29]. Huang et al. [30] took advantage of the silent                  applied this bionic concept to modify spoke-type nonpneu-
characteristics of the stripe structure in the feathers of owls           matic tire spoke structures. The asymmetric arc design was
to add nonsmooth structural units on the surface of the                   carried out on both sides of the spokes to achieve a vibration
spokes to reduce the aerodynamic noise of nonpneumatic                    reduction effect similar to that of the domestic cat’s paw pads
tires. According to the good shock absorption and buffering                to optimize the tire’s radial vibration characteristics. Then,
characteristics of a kangaroo’s lower limb structure, Zhang               the vibration reduction effect of the asymmetric arc tire and
et al. [31] made a bionic modification design to the spoke                 the original tire is compared. With vibration reduction being
structure. They confirmed that the bionic nonpneumatic                     the optimization goal, the bionic modified optimized param-
tire’s performance is better than that of a pneumatic tire rel-           eters of the spokes were achieved by performing optimization
ative to radial stiffness, lateral stiffness, longitudinal stiffness,        analysis relative to other structural parameters to obtain the
torsional stiffness, and tire ground pressure under different               optimal vibration reduction spoke structure.
loads. An in-depth exploration of bionics’ functional charac-
teristics and mechanism could improve its accuracy and                    2. Research on the Vibration Reduction
effectiveness and its possible application on nonpneumatic                    Mechanism of the Paw Pads of Domestic Cats
tires. Therefore, with the aim of making the extremely strong
vibration reduction characteristics of cat’s paw pads when in             2.1. The Mechanical Test of the Contact between the Paw Pads
contact with the ground be applied to the spokes of the non-              and the Ground. The purpose of the mechanical test of the
pneumatic tire, it is necessary to conduct research on the                contact between the paw pads and the ground is to obtain
vibration reduction mechanism of the cat’s paw pad and get                the paw pads’ vertical reaction force and the strain charac-
an improved method suitable for the spokes.                               teristics during the contact and normal walking gait
     Existing researches on vibration reduction of spokes of              (v = 0:4~0.8 m/s) of domestic cats. The test subjects were four
nonpneumatic tires are limited to exploring the impact vibra-             healthy, nondefective domestic cats aged between 4 and 7
tion by changing the spokes’ structural parameters and the                years, whose weights ranged from 3.8 to 5.6 kg, and having
use of materials to find a relatively optimized damping solu-              a shoulder height between 20 and 28 cm. The mechanical test
tion. Structural parameters play a limited guiding role for real          site was provided by the Graduate Laboratory of Tire and
vehicle applications of nonpneumatic tire development in the              Vehicle Rubber of Jiangsu University, China.
future. Hence, this paper conducts grounding mechanical                        During the test, a pressure-sensitive walkway (Walkway
tests on domestic cats’ paw pads to analyze how they achieve              A101; Tekscan, the USA) was used to measure the paw pads’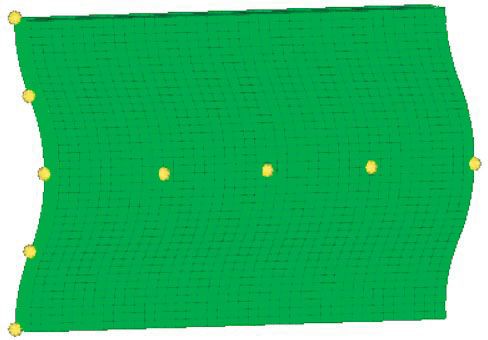
4                                                                                                                                         Applied Bionics and Biomechanics

                       7

                                                                                                          5
                       6

                       5                                                                                  4
    Strain value (%)

                       4

                                                                                       Strain value (%)
                                                                                                          3

                       3
                                                                                                          2
                       2

                                                                                                          1
                       1

                       0                                                                                  0
                           0.00 0.03 0.07 0.10 0.13 0.17 0.20 0.23 0.27 0.30                                  0.00   0.03   0.07   0.10   0.13 0.17   0.20   0.23   0.27   0.30
                                                    Time (s)                                                                               Time (s)
                                Ex                                                                                   Ex
                                Ey                                                                                   Ey

                                                   (a)                                                                                     (b)

                               Figure 4: Distribution of strain values in X and Y directions in the (a) 3rd toe pad area and (b) palm pad area.

vertical reaction force when the domestic cats walked across                                       axes show the paw pad forward and inner directions, respec-
the pressure plate in a straight line at different speeds. In                                       tively. In terms of the principal strain directions, the four toe
order to obtain the strain characteristics of the domestic cats’                                   pads did not change during the whole grounding process
with the ground, black spots and speckles were applied on                                          (Y-oriented tensile deformation). The palm pad area was
their paw pads as they walk straight on the glass plate, as                                        mainly under tensile strain in the Y direction before
shown in Figure 1(a). A high-speed camera (Olympus i-                                              0.18 s, and it was primarily in the X direction after 0.18 s,
SPEED 3, Japan) installed under the glass plate was used to                                        which indicated that the palm pad had a swing deformation
record the motion of the paw pads, and then, the images were                                       phenomenon in the contact surface. And the main strain
digitally processed using the VIC-2D of the CSI company in                                         values of the four toe pads’ continued to increase during
the United States to obtain the strain and related information                                     the entire contact process. The palm pad’s strain value
of the contact between the paw pads and the ground, as                                             increased first and then decreased alternately in the inner
shown in Figure 1(b).                                                                              and outer regions. The palm pad’s maximum main strain
                                                                                                   value was significantly lower than that of the toe pads, which
                                                                                                   was caused by the change of the strain directions.
2.2. The Mechanical Analysis of the Contact between the Paw
                                                                                                       To further clarify the vibration reduction effect of the
Pads and the Ground. For each domestic cat, six valid data
                                                                                                   palm pad’s swing deformation, the variation trends of the
were taken for processing. Each part’s peak vertical ground
                                                                                                   strain values in the X and Y directions of the 3rd toe pad
reaction force is expressed as a percentage of the domestic
                                                                                                   and palm pad during the grounding process are extracted,
cat’s body weight (%BW); recorded as mean value ±
                                                                                                   and the results are depicted in Figure 4. Considering that
standard deviation. As shown in Figure 2, the domestic cat
                                                                                                   the incompressibility of the paw pad would cause its local
paw pad is divided into a palm pad and four toe pads; the
                                                                                                   compression in the X or Y directions to be transformed into
second, third, fourth, and fifth toe pads, respectively. Peak
                                                                                                   a tensile deformation in the Y or X directions, the strain
vertical ground reaction force in each area of the fore and
                                                                                                   values greater than zero in the X and Y directions of the 3rd
hind paw pads of cats is depicted in Table 1. As shown in
                                                                                                   toe pad and palm pad were averaged to characterize the
Table 1, the peaks of the toe pads and palm pads of the fore
                                                                                                   strain values in the X and Y directions, and the strain values
paw pads are higher than those of the hind paw pads, and
                                                                                                   were recorded as Ex and Ey , respectively. It can be seen from
the palm pad area bears the maximum peak value of the
entire paw pad area. Accordingly, the palm pad area of the                                         Figure 4 that both Ex and Ey of the 3rd toe pad generally show
fore paw pads of the cat is the key area for realizing the vibra-                                  increasing trends as a whole, while the fluctuating changes of
tion reduction function.                                                                           the opposite trends of Ex and Ey in the palm pad can achieve
    The main strain field’s distribution and the strain direc-                                      the strain attenuation value.
tions of the domestic cat’s fore paw pad during the whole                                              A careful analysis of the toe and palm pads’ main strain
grounding process are displayed in Figure 3. The X and Y                                           changing characteristics shows that a vibration-damping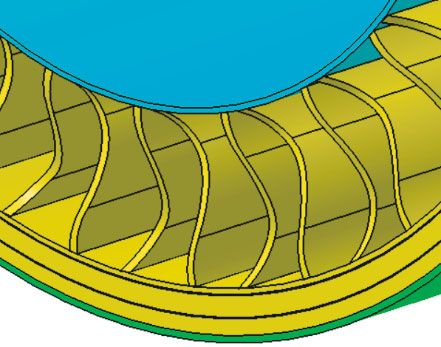
Applied Bionics and Biomechanics 5
Hub
Spoke
Inside coverage
Shear layer
Ring
Reinforcement
Outside coverage
Tread
Aluminum-alloy Steel
PU Rubber
Figure 6: Structural and material compositions of the
nonpneumatic tire.
whole wheel consists of 25 pairs of spokes, and the material
of the spokes is polyurethane. The flexible ring is divided into
three parts by two reinforcements. From the inside to the
outsides, there are the inner coverage, the shear layer, and
the outer coverage using a polyurethane material. The shear
Figure 5: Early prototype of Tweel. band between the two reinforcements mainly bears the shear
force when the tire is rolling under load. The reinforcements
are made of high-strength steel, providing high rigidity and
effect is realized when the palm pad deformation swings in strength in the circumferential direction. The tread is made
the X and Y directions; that is front-rear and left-right of rubber to ensure that the tire has excellent friction and
swinging deformation. better road gripping ability,
3. Bionic Vibration Reduction Design for 3.1.2. Establishment and Verification of Finite Element Model.
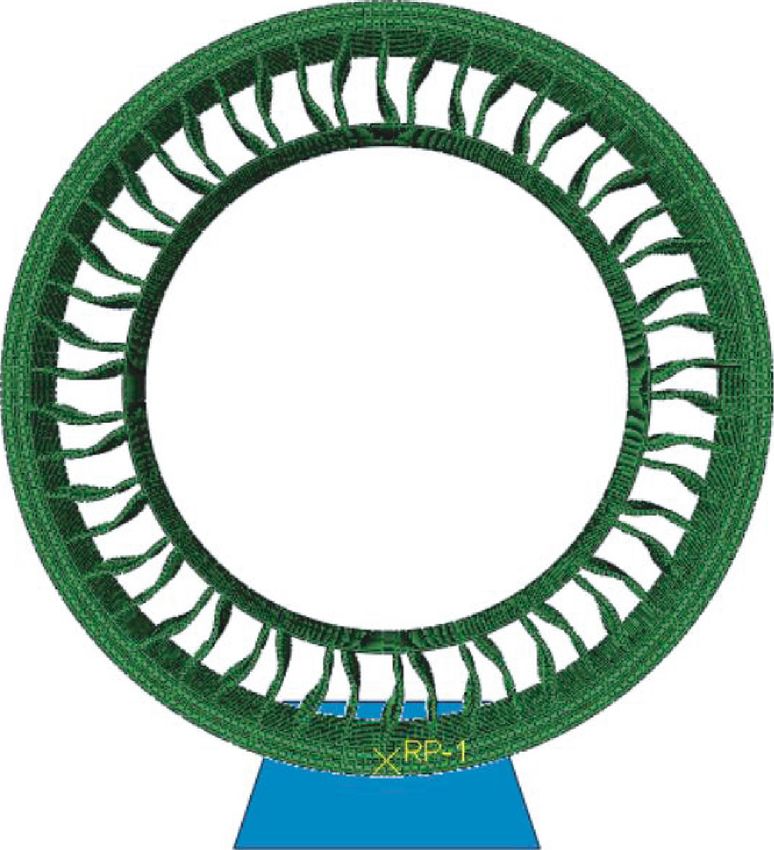
Spokes of the Nonpneumatic Tire The finite element model is displayed in Figure 7. The poly-
urethane material is modeled using the Marlow model, while
The vibration characteristics of tires are an important factor the rubber is modeled with the Neo-Hookean model. The
affecting the NVH of vehicles [32]. The vibration source in specific material properties settings is adopted from [19, 20,
the nonpneumatic tire during the rolling process is primarily 33]. Using the Abaqus/Standard solution method, the road
from the buckling and rebound of the spokes under tension surface is defined as a rigid analytical body and is fixed. A
when entering and leaving the contact area, the interaction radial force of 3665 N (a quarter of the rated load of the
between the discrete spokes and the ring, the interaction nonpneumatic tire) is applied to the rim’s center to simulate
when the ring is in contact with the ground, and the force the tire grounding process. The Coulomb friction model
of the ground and the vibration between the ring and the describes the contact characteristics between the tire and
spoke transmitted to the hub [19]. Therefore, the spokes have the road surface.
a great influence on the vibration of nonpneumatic tires. Figure 8 displays the load deflection curve (vertical stiff-
Based on the vibration reduction mechanism of the swing ness curve) between the simulation value of the finite element
deformation of the domestic cat’s paw pads, the spokes can model and the analysis result of the Akshay Narasimhan
be designed with bionics to improve the vibration charac- curve [21]. The stiffness curves of the two are relatively close,
teristics of the nonpneumatic tires and enhance the NVH and the error for a radially loaded of 3665 N tire is only
performance of the vehicle. 0.97%. The comparison results illustrate that the finite ele-
ment model established in this paper can accurately reflect
3.1. Finite Element Simulation Analysis of the the mechanical characteristics of Tweel for further research.
Nonpneumatic Tire
3.2. Bionic Design of Spokes. Ramachandran et al. [34] carried
3.1.1. The Geometry of the Nonpneumatic Tire. In this paper, out a study on the spoke vibration and concluded that under
Michelin’s Tweel nonpneumatic tire (Figure 5) is selected the same conditions, the vertical middle node vibrates more
because of its relatively established and wide application. violently than the upper and lower quarter nodes in the radial
The geometric parameters of Tweel are selected from the direction of the spoke. The vibration gradually increases
research of Bezgam [19]. The structural composition and from the middle position towards the edges on both sides
material usage of the three-dimensional geometric model of in the axial direction. Therefore, a scallop-shaped treatment
the nonpneumatic tire is shown in Figure 6. Tweel is mainly method on the side edge of the spokes is proposed: it involves
composed of four parts: a rigid hub, deformable spokes, a a precise cutting out of the areas with severe vibrations to
flexible ring with reinforcements, and a tread. The wheel reduce the vibration amplitude. Figures 9 and 10 show the
hub is made of aluminum alloy, which supports the tire spoke vibration marker nodes and the scallop-shaped edges,
and is assembled with the shaft. The spokes are in pairs, the respectively.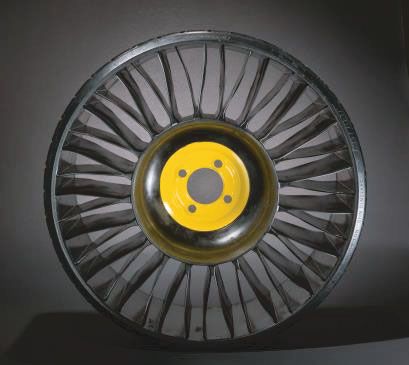
6                                                                                                                     Applied Bionics and Biomechanics

                                                                                    y

                                                                            z       x

                                                                    Figure 7: Finite element model.

                         4000                                                                                               Horizontal middle node
                                                                                                      Top node
                         3500

                         3000                                                                Upper quarter node
    Reaction force (N)

                         2500                                                               Vertical middle node

                         2000
                                                                                             Lower quarter node
                         1500
                                                                                                  Bottom node
                         1000                                                                                      Left quarter node   Right quarter node

                          500                                                                     Figure 9: Vibration marker nodes for spoke.

                           0
                                0      2        4       6       8   10      12
                                                                                        necting line (edge line) of the top and bottom points, which is
                                                                                        15 mm here. The shape of the arc is constructed based on the
                                                Displacement (mm)
                                                                                        method of cubic interpolation spline curve. The left-right and
                                    Narasimhan                                          up-down swing of the tire during rolling is realized by dis-
                                    Simulation value                                    tributing the arcs asymmetrically at both sides of the spoke
                                                                                        to the axial and radial bisecting lines accordingly. And the
Figure 8: Comparison of radial stiffness curve for simulation and
Narasimhan analysis value.
                                                                                        front-rear swing is also realized by the asymmetric arrange-
                                                                                        ment of the adjacent spokes. In ensuring the stability of tire
                                                                                        bearing capacity, the spokes are staggered along the circum-
    Inspired by the scallop-shaped spoke edges treatment                                ferential direction of the tire in accordance with the asym-
and the domestic cat’s paw pad vibration reduction mecha-                               metric arc of spokes 1 and 2, as displayed in Figure 12.
nism, an asymmetric structural design is carried out on the                             Consequently, the asymmetrical arc not only cuts off a part
spokes to enable the tire to achieve similar swing deformation                          of the spokes where the vibration is relatively large but also
characteristics in the rolling process. The bionic modification                          dissipates the impact from the ground in the swing deforma-
design is presented in Figure 11. The vertices (P) of the asym-                         tion of the spokes to attain the overall vibration reduction
metric arc are on the horizontal straight line where the upper                          effect.
and lower quarter nodes are located. The size of the arc is                                 To eliminate the influence of the bionic structural design
determined by the vertical distance h1 from the P to the con-                           and to assess the vibration reduction performance of the
Applied Bionics and Biomechanics                                                                                                           7

                                     Figure 10: The scallop-shaped treatment on the side edge of the spokes.

                                               Axial bisecting line
                                                                                        h2       P
            h1          P

                                                                  Spoke 1
                                                                                     Figure 13: Symmetrical arc structure of spoke.
             Radial bisecting line
Edge line
                                                                            linear hexahedral three-dimensional stress element with
                                                                  Spoke 2   reduced integration (C3D8R). The reinforcement layer has
                                                                            elements of 4-node and quadrilateral with reduced integra-
             h1                                                             tion (SFM3D4R). For simulation analysis, a radial load of
                                                                            3665 N and a speed of 60 km/h are applied to the rim. And
                        P                                                   the road condition is considered fixed. Then, the radial exci-
                                                                            tation force of the road in the time domain of 0.12 s (steady
                                                                            rolling 1.06 cycles) when the tire is rolling in a steady state
            Figure 11: Bionic modified design of spoke.                      is extracted. The comparison of the radial excitation force
                                                                            of three kinds of tires in the time domain is shown in
                                                                            Figure 14. The radial excitation force of the three types of
                                                                            tires fluctuates up and down at the applied load of 3665 N.
                        Spoke 1
                                                                            The fluctuation of the symmetrical arc tire is the most obvi-
                                                                            ous, followed by the original tire. In contrast, the radial exci-
                                                                            tation force of the asymmetric arc tire has been reduced,
                                                                            especially at the peak, and the excitation force fluctuates
                                                                            more uniformly in the entire time domain. Therefore, the
                                                                            application of asymmetric arcs on the spokes can signifi-
                                                                            cantly reduce the radial vibration of the tire.
                                                                                 To further demonstrate that the asymmetric arc tire is
                  Spoke 2                                                   superior to both the symmetric arc tire and original tire in
                                                                            vibration reduction and further clarify the reason why asym-
       Figure 12: Asymmetrical arc structure of spoke pair.                 metric arc tire can reduce the radial excitation force of the
                                                                            road surface, the FFT function in MATLAB is used to convert
asymmetric arc swing deformation, a comparison of asym-                     the excitation force in the time domain to the amplitude
metric and symmetric arc tires of the same weight is made.                  change in the frequency domain. Since the sound pressure
As depicted in Figure 13, the P of the symmetric arc is on                  level (SPL) with a frequency lower than 100 Hz has no signif-
the horizontal line where the vertical middle node is located,              icant effect on human perception of noise [14], and when the
and the vertical distance h2 from the P to the edge line repre-             frequency is greater than 1500 Hz, the amplitudes are small,
sents the size of the symmetric arc, which is 15 mm.                        and there are no significant peak amplitudes. So 100 Hz-
                                                                            1500 Hz is taken as the range of analysis in this paper.
3.3. Finite Element Analysis and Discussion of Bionic Design.               Figure 15 shows the spectrum comparison between the orig-
The vibration and noise of tires are closely related to the                 inal tire and the asymmetric arc tire. Figures 15 and 16 ,
radial excitation force of the road surface during rolling,                 respectively, show the comparison of the spectrum between
and the larger the excitation force value is, the higher the                the original tire and the asymmetric arc tire and the compar-
vibration and noise value will be [32, 35]. With the aid of                 ison of the asymmetric arc tire and the symmetric arc tire.
the Abaqus/Explicit method, the hub, spokes, inner and                      And the PA1 (peak amplitude 1, lower frequency) and PA2
outer coverages, shear layer, and tread adopt an 8-point                    (peak amplitude 2, higher frequency) have been marked.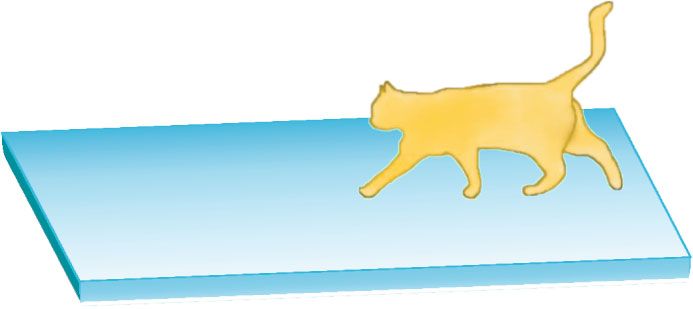
8                                                                                                                                        Applied Bionics and Biomechanics

                                                        7000

                                                        6000

                                                        5000

                                            Force (N)
                                                        4000

                                                        3000

                                                        2000

                                                        1000

                                                               4.38      4.40       4.42      4.44               4.46           4.48       4.50
                                                                                            Time (s)

                                                                      Original tire
                                                                      Asymmetric arc tire
                                                                      Symmetric arc tire

                              Figure 14: Comparison of time-domain distribution of radial excitation force of three kinds of tires.

            250         PA1                                                                                350           PA1

                                                                                                           300
            200         PA1
                                                                                                           250

            150                                                                                                           PA1
                                                                                               Magnitude
Magnitude

                                                                                                           200

                                                                                                           150
            100                                                            PA2
                                                                PA2                                        100                                                         PA2
                                                                                                                                                                 PA2
            50
                                                                                                            50

             0                                                                                               0
                  200         400     600     800     1000                1200     1400                            200          400     600     800     1000      1200       1400
                                         Frequency (Hz)                                                                                    Frequency (Hz)

                    Original tire                                                                                       Asymmetric arc tire
                    Asymmetric arc tire                                                                                 Symmetric arc tire

Figure 15: The spectrum comparison between the asymmetrical arc                               Figure 16: The spectrum comparison between the asymmetrical arc
tire and the original tire.                                                                   tire and the symmetric tire.

                                                                                              bionic modification of spokes. The comparison of the ampli-
Through comparison, it is found that the PA1, PA2, and                                        tudes of the three tires is shown in Table 2, and the formula
amplitudes corresponding to most frequencies in the entire                                    for calculating the root mean square value is defined as
frequency domain of the asymmetric arc tire are smaller than
                                                                                                                                        vffiffiffiffiffiffiffiffiffiffiffiffiffiffiffiffiffiffiffiffiffi
those of the original tire and the symmetric arc tire.                                                                                  u N
    Since the root mean square (RMS) value can reflect the                                                                               u1
                                                                                                                                  RMS = t 〠 ðxi Þ2 ,                            ð1Þ
amplitudes of the overall vibration in the entire frequency                                                                              N i=1
range, and the peak amplitude reflects the vibration intensity
at the local frequency; this paper uses both the root mean
square value and the peak amplitude to quantify the ampli-                                    where N is the total number of intervals in the step and xi is
tudes of the ground response to further clarify the effect of                                  the data on the ith interval.
Applied Bionics and Biomechanics                                                                                                   9

Table 2: The comparison of vibration amplitudes of three kinds          (3) Finite element analysis numerical test: a model data-
of tires.                                                                   base was established based on the DOE method, and
                                                                            ABAQUS simulations were performed on each
                                       Amplitude type                       model. The selection of the model simulation method
Tire type
                              PA1           PA2            RMS
                                                                            and the calculation settings remained the same as
Original tire                226.65         77.93          32.33            before
Asymmetric arc tire          215.37         44.24          27.01
                                                                        (4) Approximate model (AM) method: the AM method
Symmetric arc tire           349.45         63.34          34.97
                                                                            is a mathematical model that approximates a set of
                                                                            input variables (independent variables) and output
                                                                            variables (response variables) through a mathemat-
     As can be seen from Table 2 that the peak amplitude and
                                                                            ical model. It is established according to the rela-
root mean square value of the asymmetric arc tire are signif-
                                                                            tionship between the design variables and the
icantly reduced compared to the original tire. The PA1, PA2,
                                                                            simulation response. Here, the Kriging model was
and RMS are reduced by 4.98%, 43.23%, and 16.46%, respec-
                                                                            selected to build an approximate model
tively, indicating that the asymmetric arc can effectively
reduce the radial vibration of the tire. Although the PA2 of            (5) Optimization calculation: after constructing the
the symmetrical arc tire is lower than that of the original tire,           approximate model, a reasonable algorithm is used
the PA1 at the low-frequency band that has a greater impact                 to solve the objective function to obtain the optimal
on tire vibration is 35.14% higher than that of the original                design parameters. In this paper, a genetic algorithm
tire, significantly increasing the local vibration intensity and             (GA) was employed to obtain the optimal solution
its RMS is higher than that of the original tire.
     In the comparison between the asymmetric arc tire, the         4.1. Design of Experiments Method. The design of the exper-
symmetric arc tire, and the original tire, it is found that not     iment method can identify key experimental factors, deter-
only does the peak amplitudes of the asymmetric arc tire            mine the best combination of parameters, analyze the
decrease but also the overall vibration amplitudes decrease.        relationship between independent and dependent variables,
This indicates that the asymmetric arc tire can weaken the          and provide sample data for constructing an approximate
impact through the characteristics of swing deformation to          model [37]. In the process of designing the experiment, the
achieve a better vibration reduction effect and authenticates        design points of the experiment should cover the design
the feasibility of bionic vibration reduction.                      space evenly and avoid the repetition of sampling points as
                                                                    far as possible; the number of test analysis should be mini-
                                                                    mized to ensure that the calculation cost is not too high
4. Optimization for Vibration                                       under the premise of ensuring accuracy. All the above stated
   Reduction of Spokes                                              practical requirements were satisfied by applying the orthog-
                                                                    onal array (OA) method since it considers both the interac-
The feasibility of applying the vibration reduction mecha-          tion and the test accuracy and delivers an advantage of high
nism of cat’s paw pad to the spokes of nonpneumatic tires           efficiency, speed, and economy.
was verified. However, considering that other parameters of              According to the requirement of orthogonality, an OA
the spokes will also have a certain impact on the vibration         table in the form of Ln ðEP Þ is generated to design the exper-
of the tires, and therefore without changing the inner and
                                                                    iment, where L is the table, n is the total number of design
outer diameters of the tire (the length of the spokes remains
                                                                    solutions required (the number of rows in the table), E is
unchanged), the asymmetric arc is combined with the thick-
                                                                    the level of the factors, and P is the number of factors. In this
ness and curvature of the spokes to optimize the design of the      experiment, 3 factors and 3 levels were considered, so an
spokes to achieve a better damping effect. The specific
                                                                    orthogonal table of L9 ð33 Þ was used.
process of the design optimization of the spokes structure is
                                                                        The three factors of the orthogonal test are the size of the
illustrated in Figure 17.
                                                                    asymmetric arc (A), the thickness of the spoke (B), and the
    (1) Parameterization: the optimization design include           curvature of the spoke (C). The definition of the thickness
        choosing the right design variables and reducing the        and curvature of the spoke are shown in Figure 18; h3 depicts
        number of design variables to reduce complications          the vertical distance from the vertical middle node to the line
        and cost. [36]. The spoke could be parameterized by         connecting the top and bottom nodes. The size of the dis-
        three variables: the size of the asymmetric arc, the        tance expresses the magnitude of curvature, the thickness of
        thickness, and the spoke’s curvature                        the spoke is represented byh4 , and the size of the asymmetric
                                                                    arc was described in Section 3.2.
    (2) Design of experiments (DOE) method: the DOE                     The original values of the asymmetric arc is 15 mm, while
        method provides a reasonable and effective method            the thickness and curvature of the spoke are 4.2 mm and
        to obtain information and data, which directly affects       8 mm, respectively. The factors and level design of the
        the quality of the approximation model and is one of        orthogonal experiment are indicated in Table 3. The orthog-
        the most important statistical methods in the optimi-       onal table generated according to the factors and levels and
        zation process. Here, the orthogonal array (OA) was         the simulation results (RMS) of the nine groups of design
        chosen to generate the sample points                        schemes are shown in Table 4.
10                                                                                                Applied Bionics and Biomechanics

                                    Design cycle
                                                           FEA numerical tests
                                                             with ABAQUS

                                                                                    Parameterization
                                                               Design of
                                                           experiments (DOE)

                                    Optimization cycle
                                                             Approximation
                                                                models

                                                              Optimization
                                                               algorithm

                                                                  Output

                                             Figure 17: Flowchart of the design optimization

                              Top node                                              Table 4: Schemes for the OA method.

                                                                       No.            A                 B         C            RMS
                                                                       1             11.25             3.15     6.00           27.38
                                                                       2             15.00             4.20     6.00           18.38
                               h3
                                                                       3             18.75             5.25     6.00           17.00
                                         Vertical
                                         middle node                   4             15.00             3.15     8.00           23.06
                                                                       5             18.75             4.20     8.00           25.27
                                                                       6             11.25             5.25     8.00           23.55
                     h4
                                                                       7             18.75             3.15     10.00          29.33
                                                                       8             11.25             4.20     10.00          32.07
                                                                       9             15.00             5.25     10.00          30.79
                                        Bottom node

Figure 18: The definition of the thickness and curvature of the
spoke.
                                                                       spokes can effectively deliver a better vibration reduction
                                                                       effect.
              Table 3: Factors and levels of OAs.                           With the view of ascertaining the influence of design var-
                                                                       iables on the RMS value and the degree of contribution, a
                                      Level (mm)                       Pareto chart as shown in Figure 19 is drawn. It can be seen
Factor
                     1                     2                  3
                                                                       from the figure that for a single design parameter, the curva-
A                  11.25                 15.00              18.75      ture of the spoke has the greatest influence on the RMS value,
B                   3.15                  4.20               5.25      with a contribution rate of 31.71%, and the increase of the
C                   6.00                  8.00              10.00      curvature will increase the RMS value, followed by the size
                                                                       of the asymmetric arc and the thickness of the spoke, whose
                                                                       contribution rates are 8.69% and 3.75%, respectively, and as
                                                                       the size of the asymmetric arc and the thickness of the spoke
     As can be seen from Table 4, compared with the original           increase, the RMS values decrease. The nonlinear influence of
tire, the RMS values of all the nine schemes are reduced, with         a single variable on the RMS value is dominant. For example,
the smallest and the largest decreasing values being 4.21%             the contribution of C 2 to the RMS value is about 17.81%, that
and 47.42%; compared with asymmetric arc tires, the RSM                is, the influence on the RMS value is quadratic. Figure 20 fur-
values of the four groups of design schemes are reduced.               ther illustrates the effect of design variables on the RMS
The minimum decrease is 6.44%, and the maximum decrease                value. As can be seen from Figure 20 that the curve of C2
is 37.06%. The result proves that a proper combination of the          has a larger curvature, the trends of the curves of A and B
size of the asymmetrical arc, thickness, and curvature of the          are more synchronized, which explains that the size of the
Applied Bionics and Biomechanics 11
C
A-B
C2
B2
A
A2
B
A-C
–10 –5 0 5 10 15 20 25 30 35
Total effect on RMS (%)
Figure 19: Pareto chart for the RMS.
32
30
28
26
RMS
24
22
20
18
16
1 1.2 1.4 1.6 1.8 2
Leveis
A
B
C
Figure 20: Main effect plot for the RMS.
asymmetrical arc and the thickness of the spoke have a rela- network model, orthogonal polynomial, and Kriging model.
tively similar effect on the RMS value. In addition, the Pareto However, since RSM model is not capable of describing non-
chart also provides the correlation between the design vari- linear problems, the RBF model takes a long time to build a
ables and the target variables, in which, the correlation model, and considering that the problem studied in this
between A and B has the greatest impact on the RMS value; paper does not only have a high degree of nonlinearity but
a value of about 18.57%, indicating that both changes have also has random errors, the Kriging model was selected for
the greatest influence. A and C have the least influence on the construction of an approximate model [38]. The Kriging
the RMS value (about -1.33%). model can be expressed as
yðxÞ = f ðxÞ + Z ðxÞ, ð2Þ
4.2. Approximate Model Method
4.2.1. Kriging Approximation Model. Approximate models where yðxÞ is the unknown deterministic function, f ðxÞ is a
include the response surface model (RSM), RBF/EBF neural known approximation function, ZðxÞ is the realization of a12 Applied Bionics and Biomechanics
Table 5: Kriging model validation.
Group A (mm) B (mm) C (mm) Kriging model ABAQUS Error (%)
1 13.13 3.68 7 22.37 21.84 2.43%
2 16.88 4.73 9 27.47 26.47 3.78%
stochastic process with mean zero, variance σ2 , and nonzero Therefore, the constant term of the Kriging model is used
covariance f ðxÞ provides a global approximation model of for the global portion, while the Gaussian correlation func-
the design space, and ZðxÞ creates localized deviations so that tion (4) is used for the local deviations.
the Kriging model can interpolate the sample points [39]. In
many cases, f ðxÞ is taken as a constant, and β is also employed 4.2.2. Error Analysis. When constructing the Kriging model,
in the design of spokes structure of nonpneumatic tires. there will be errors caused by the polynomial model itself
The covariance matrix of ZðxÞ is formulated as or fitting. Therefore, the squared multiple correlation coeffi-
cient R2 is introduced to verify the reliability of the Kriging
model. The closer R2 is to 1, the more accurate the fitting will
cov Z xi , Z x j = σ2 M R xi , x j , ð3Þ
be. The final result shows that R2 = 0:99, for which, a conclu-
sion can be drawn that, the Kriging model has sufficient accu-
where Rðxi , x j Þ is the correlation function between any two racy to interpolate these 9 sample points for optimization
input points xi and x j of n observed points, and M is the calculations.
n × n correlation matrix with values along the diagonal In this case, two groups of variables were randomly
[40]. Gaussian correlation function was used to calculate selected, and the ABAQUS and Kriging models were, respec-
Rðxi , x j Þ and is given by: tively, used to obtain the RSM values. As illustrated in
" p # Table 5, the error between the calculation results of the
i j Kriging model and those of ABAQUS is small, which further
j 2
R x , x = exp − 〠 θk xk − xk
i
, ð4Þ verifies the accuracy of the Kriging model.
k=1
4.3. Optimization Calculation. The genetic algorithm (GA) is
j
where xik and xk are the kth components of sample points, a global optimization method that mainly uses the laws of
and θk are the unknown correlation parameters, which can biological evolution to solve optimization problems. GA
be obtained by the maximum-likelihood estimation (MLE) encodes the individuals and then performs the genetic oper-
[41] method according to ations of selection, crossover, and mutation on the encoded
individual to seek the optimal solution [44]. In this study,
1 the multi-island genetic algorithm (MIGA), which can be
max ½Φðθk Þ = − n ln σ∧2 + ln jM j : ð5Þ regarded as an improved genetic algorithm, was used to solve
θk >0 2
the optimal solution. MIGA divides a large population into
While any value for θk creates an interpolative Kriging several subpopulations, each of which carries out genetic
model, the ‘best’ Kriging model is found by solving the k- operations independently, and the individuals on each island
dimensional unconstrained nonlinear optimization problem transfer to other islands in a certain proportion periodically
given by equation (5) [42]. For a given θ, the closed-form to complete the periodic exchange of information [42].
solution for the optimal values of β and σ2 can be obtained Objective constrained optimization problem can be
defined as follows:
and formulated as
Objective function: minimize RMS
b = I T M −1 I −1 I T M −1 I Y,
Design variables with limits:
β (i)7:50 ≤ A ≤ 22:50
1 ð6Þ (ii)2:10 ≤ B ≤ 6:30
σ∧2 = ðY − Iβ∧ÞT M −1 Y − I β b , (iii)4:00 ≤ C ≤ 12:00
n
The RMS value was optimized by MIGA. The size of the
where I is a d-dimensional unit vector and Y = ½yðxi Þ, ⋯, subpopulation is 100, the number of islands is 100, and the
yðxm Þ is the vector of true limit state function values [43]. number of evolutionary generations is 10. The optimization
Predicted estimates, y at untried values of x, are given by result is A = 17:31, B = 4:85, and C = 6:04. The RMS value
for the optimization result is 16.30, which is 4.12% better
than the optimal value in the OA table. And the optimization
b + r T ðxÞM −1 Y − I β
̂yðxÞ = β b , ð7Þ values of A, B, and C are reduced by 7.68% and 7.62% and
increased by 0.67%, respectively, compared with the design
where r T is the correlation vector given by variables of the optimal vibration reduction in the orthogonal
experiment. The values of design variables and RMS of the
T two groups are not much different, which verifies the reliabil-
rT ðxÞ = R x, x1 , ⋯, R x, xi ði = 1, ⋯, nÞ: ð8Þ ity of the Kriging model from another perspective.Applied Bionics and Biomechanics 13
7000
6000
5000
Force (N)
4000
3000
2000
1000
4.38 4.40 4.42 4.44 4.46 4.48 4.50
Time (s)
Original tire
Asymmetric arc tire
Optimized tire
Figure 21: Comparison of the distribution of radial excitation force of three tires.
250
PA1
200
PA1
150
Magnitude
PA2
100
PA2
PA1 PA2
50
0
200 400 600 800 1000 1200 1400
Frequency (Hz)
Original tire
Asymmetric arc tire
Optimized tire
Figure 22: The spectrum comparison between the optimized tire, original tire, and asymmetric arc tire.
The values of optimized design variables are used for sim- Figure 22, which indicates that the PA1 value of the opti-
ulation analysis and compared with the original tire and the mized tire is much smaller than that of the original tire and
asymmetric arc tire, and the distribution diagram of the asymmetric arc tire, and the PA2 value and RMS value are
radial excitation force of the three is obtained, as depicted also significantly reduced. The result of the comparison
in Figure 21. It manifests that although several peaks of the proves that the optimized tire has a more prominent advan-
optimized tire are increased, the local fluctuations around tage of vibration reduction.
the peaks are reduced; and the green markers illustrate that According to the simulation results, the RMS value of the
the fluctuation curve is relatively straight, therefore, the optimized tire is 15.63, while the value obtained by MIGA is
fluctuations during the whole cycle are greatly reduced. The 16.30, with an error of only 4.11%. In addition, since the orig-
spectrum comparison of the three tires is shown in inal tire and the asymmetric arc tire both use the results of14 Applied Bionics and Biomechanics
Table 6: The comparison of amplitudes. the four toe pads showed a cumulative increasing
trend over time, while in the palm rest area, Ex and
Amplitude type Ey did not show a trend of increase over time, and
Tire type
PA1 PA2 RMS
each exhibited fluctuating changes and the trends
Original tire 226.65 77.93 32.33 were opposite to each other; in other words, when
Asymmetric arc tire 215.37 44.24 27.01 Ex increases or decreases, Ey correspondingly
Optimized tire 54.24 36.72 15.63 decreases or increases, which means that the palm
pad through front-rear, left-right swing deformation
to weaken the ground impact to achieve the purpose
Table 7: The comparison of spoke parameters. of vibration reduction
Parameter (2) First of all, the finite element model of the spoke-type
Tire type nonpneumatic tire was established, and its stiffness
A B C
curve was compared with those in the reference.
Asymmetric arc tire 15 mm 4.2 mm 8 mm
The small error between the two verified the feasibil-
Optimized tire 17.31 mm 4.85 mm 6.04 mm
ity of the model. After that, based on the principle of
Increase or decrease ↑15.40% ↑15.48% ↓24.50% bionics, the spoke structure of the asymmetric arc
was proposed. Through the comparative analysis of
radial vibration, it was found that the peak amplitude
values and root mean square value of the asymmetric
simulation calculations, the simulation values of the opti- arc tire were distinctly lower than those of the sym-
mized tire are used for comparative analysis. Table 6 shows metric arc tire and original tire, which proved that
the comparison of the values of PA1, PA2, and RMS value asymmetric arc tire had significant vibration reduc-
among the original tire, asymmetric arc tire and optimized tion characteristics. Finally, it can be concluded that
tire. Compared with the original tire, the PA1, PA2, and the swing deformation vibration reduction mecha-
RMS values of the optimized tire are reduced by 76.07%, nism of the cat’s paw pads had a positive vibration
52.88%, and 51.65%, respectively. The values of PA1, PA2, reduction effect when applied to the spokes of non-
and RMS of the optimized tire are 74.82%, 17.00%, and pneumatic tires
42.13% lower than those of the asymmetric arc tire, respec-
tively. Results show that using the size of the asymmetric (3) To maximize the vibration reduction performance of
arc, the thickness, and curvature of the tire as design variables the structural design of the spokes, based on the
to optimize the design has an excellent vibration reduction bionic design of the asymmetric arc, an optimization
effect. And combined with the comparison of the structural for vibration reduction using the OA method, the
parameters of the asymmetric arc tire and the optimized tire Kriging approximate model, and the MIGA was
in Table 7, it is found that increasing the size of the asym- employed to obtain the optimal design parameters
metric arc and the thickness of the spoke appropriately of the spokes. The DOE analysis revealed the curva-
and reducing the curvature of the spoke will have a better ture of the spokes as the most key parameter for
vibration reduction effect. vibration reduction, followed by the size of the asym-
metric arc and the thickness of the spokes, while
increasing the size of the asymmetric arc and the
5. Conclusion thickness of the spokes and decreasing the curvature
of the spokes appropriately will obtain a better vibra-
In this paper, the spokes of the nonpneumatic tire were tion reduction effect. Results showed that the optimal
treated with asymmetric arc using the vibration reduction combination of the design variables can reduce PA1,
mechanism of domestic cat’s paw pads, and the vibration PA2, and RMS values by 74.82%, 17.00%, and
characteristics of the asymmetric arc tire, symmetric arc tire, 42.13%, respectively, compared with the asymmetric
and original tire under rolling conditions were compared and arc tire, and 76.07%, 52.88%, and 51.65% lower than
analyzed. Furthermore, the size of the asymmetric arc, the those of the original tire, respectively
thickness and curvature of spokes were used as design vari-
ables for vibration reduction optimization, and the following
conclusions were drawn. Data Availability
(1) Using the pressure-sensitive walkway, high-speed The data used to support the findings of this study are
camera, and VIC-2D to carry out the grounding available from the corresponding author upon request.
mechanical tests of the paw pads of domestic cats, it
was found that the peak vertical ground reaction
force of the fore paw pad was greater than that of Conflicts of Interest
the hind paw pad, and there were significant differ-
ences in strain between the four toe pads and the The author states that there are no conflicts of interest related
palm pad. The strains in the X and Y directions of to the publication of this article.Applied Bionics and Biomechanics 15
Acknowledgments [17] Y. Q. Zhao, H. X. Fu, F. Lin, and Y. Q. Li, “Advancement of
non-pneumatic wheels and mechanical characteristics,” Jour-
This research is funded by the National Natural Science nal of Jiangsu University, vol. 37, no. 6, pp. 621–627, 2016.
Foundation of China (project no. 51605198, 51675240), [18] K. K. Manga, Computational method for solving spoke dynam-
Jiangsu Youth Fund (project no. KB20160528), Jiangsu Prov- ics on high speed rolling tweel, Clemson University, 2008.
ince Six Talents Summit Program (project no. JXQC-011), [19] S. Bezgam, Design and analysis of alternating spoke pair con-
and Jiangsu University Senior Talents Startup Fund Project cepts for a non-pneumatic tire with reduced vibration at high
(project no. 1291120046). speed rolling, Clemson University, 2009.
[20] A. Proddaturi, Robust parameter design and finite element
References analysis for a non-pneumatic tire with low vibration, Clemson
University, 2009.
[1] Y. Q. Zhao, “Research progress on kind of non-pneumatic [21] A. Narasimhan, A computational method for analysis of mate-
mechanical elastic safety wheel,” Journal of Mechanical engi- rial properties of a non-pneumatic tire and their effects on static
neering, vol. 55, no. 24, pp. 105–116, 2019. load deflection, vibration and energy loss from impact rolling
[2] Z. Z. Zhang, J. G. Lv, B. Song, S. Y. Guo, and F. Gao, “Develop- over obstacles, Clemson University, 2010.
ment of non-pneumatic tire technology,” Applied Mechanics [22] D. Romano, G. Benelli, and C. Stefanini, “Encoding lateraliza-
and Materials, vol. 427-429, pp. 191–194, 2013. tion of jump kinematics and eye use in a locust via bio-robotic
[3] T. B. Rhyne and S. M. Cron, “Development of a non- artifacts,” Journal of Experimental Biology, vol. 222, no. 2,
pneumatic wheel,” Tire Science & Technology, vol. 34, no. 3, 2019.
pp. 222–225, 2006. [23] X. Mo, W. Ge, D. Romano, E. Donati, and C. Stefanini,
[4] B. Corp, “Non-pneumatic tire,” vol. 9, 2013, European Patent “Modelling jumping in locusta migratoria and the influence
2210749. of substrate roughness,” Entomologia Generalis, vol. 38,
[5] J. J. Summers and D. Joshua, “Design of honeycombs for mod- no. 4, pp. 317–332, 2019.
ulus and yield strain in shear,” Journal of Engineering Mate- [24] Y. Mei, G. L. Wang, H. C. Zhou, and C. Z. Liu, “Investigation
rials and Technology, vol. 134, pp. 1–15, 2012. of the mechanical and grounding characteristics of the domes-
[6] Hankook Tire Co Ltd, “Non-pneumatic tire,” 2013, Korean tic cat's paw pads based on gait analysis,” Thai Journal of Vet-
Patent 0063254. erinary Medicine, vol. 51, no. 1, pp. 43–50, 2021.
[7] Z. D. Ma, Y. Y. Liu, X. M. Liu, C. Sun, and Y. S. Cui, “Ultra- [25] A. Biewener, “Biomechanics of mammalian terrestrial locomo-
lightweight non-pneumatic tire structure based on negative tion,” Science, vol. 205, pp. 1097–1103, 1990.
Poisson's ratio structure,” vol. 4, 2012Chinese patent [26] X. P. Zhang, J. L. Yang, and H. Yu, “Mechanical buffering char-
102529583A. acteristics of feline paw pads,” Journal of Biomedical Engineer-
[8] Y. Q. Zhao, L. G. Zang, Y. Q. Chen, B. Li, and J. Wang, ing, vol. 29, no. 6, pp. 1098–1104, 2012.
“Non-pneumatic mechanical elastic wheel natural dynamic [27] J. Ju, B. Ananthasayanam, J. D. Summers, and P. Joseph,
characteristics and influencing factors,” Journal of Central “Design of cellular shear bands of a nonpneumatic tire-
South University, vol. 22, no. 5, pp. 1707–1715, 2015. investigation of contact pressure,” SAE International Journal
[9] W. Wang, Y. Q. Zhao, C. Jiang, and J. Wu, “Characteristics of Passenger Cars – Mechanical Systems, vol. 3, no. 1,
analysis of mechanical transmission for a new mechanical pp. 598–606, 2010.
elastic wheel,” Journal of Jiangsu University, vol. 34, no. 3, [28] Y. Xu, H. H. Wang, and X. W. Sheng, “Research on the equiv-
pp. 261–266, 2013. alent modeling method of laying hexagon honeycomb plate
[10] J. S. Zhao, X. C. Liang, and X. Liu, “Space truss-type non- based on HyperWorks,” Journal of Vibration and Shock,
pneumatic tire,” vol. 29, 2014Chinese patent 104118276A. vol. 37, no. 23, pp. 45–51, 2018.
[11] C. X. Shi, Z. H. Meng, and M. Q. Song, “Non-pneumatic tire,” [29] W. H. Lu and R. H. Bao, “Mechanical behavior of materials
vol. 18, 2017Chinese patent 107053954A. with peak and nest under dynamic impact,” Journal of Vibra-
[12] K. Chen, G. L. Wang, K. Q. Li, C. Liang, and H. C. Zhou, “Gra- tion and Shock, vol. 24, no. 1, pp. 49–52, 2005.
dient elastic non-pneumatic tire,” vol. 1, 2017Chinese patent [30] M. F. Huang, H. C. Zhou, K. Q. Li, and G. L. Wang, “A calcu-
107116973A. lational aero-acoustic study of spokes of an isolated nonpneu-
[13] C. Lee, J. Ju, and D. M. Kim, “The dynamic properties of a non- matic tire,” Tire Science & Technology, vol. 48, no. 1, pp. 46–61,
pneumatic tire with flexible auxetic honeycomb spokes,” in 2018.
ASME 2012 International Mechanical Engineering Congress [31] Z. F. Zhang, H. X. Fu, Q. Zhao, D. Tan, and K. Yang, “Pattern
and Exposition, pp. 1–11, Houston, TX, USA, 2012. design and performance analysis of a flexible spoke bionic
[14] W. Rutherford, Use of orthogonal arrays for efficient evaluation non-pneumatic tire,” Journal of the Brazilian Society of
of geometric designs for reducing vibration of a non-pneumatic Mechanical Sciences and Engineering, vol. 43, no. 1, pp. 1–11,
wheel during high-speed rolling, Clemson University, 2009. 2021.
[15] C. Lee, J. Ju, and D. M. Kim, “Vibration analysis of non- [32] J. Yang, Research on analysis method of vehicle tire vibration
pneumatic tires with hexagonal lattice spokes,” in Proceedings noise characteristics and low tire noise structural design,
of the ASME 2012 International Design Engineering Technical Jiangsu University, 2015.
Conferences & Computers and Information in Engineering [33] M. Veeramurthy, Modeling, finite element analysis, and opti-
Conference, pp. 1–8, Chicago, IL, USA, 2012. mization of non-pneumatic tire (NPT) for the minimization
[16] J. C. Huang and W. Wang, “Comparison of non-pneumatic of rolling resistance, Clemson University, 2011.
tire and radial tire by finite element simulation,” China Rubber [34] M. Ramachandran, S. Bezgam, L. L. Thompson, J. C. Ziegert,
Industry, vol. 63, no. 1, pp. 31–34, 2016. T. B. Rhyne, and S. M. Cron, “On the effects of edge scalloping16 Applied Bionics and Biomechanics
for collapsible spokes in a non-pneumatic wheel during high
speed rolling,” in ASME 2009 International Mechanical Engi-
neering Congress and Exposition, pp. 1–13, Lake Buena Vista,
FL, USA, 2009.
[35] G. L. Wang, L. Qiao, and H. C. Zhou, “Study on the influence
of PCR tire grounding behavior on noise and rolling resis-
tance,” Chinese Journal of Mechanical Engineering, vol. 55,
no. 16, pp. 123–131, 2019.
[36] S. Krajnovic, “Aerodynamic optimization of vehicles using
computational fluid dynamics and response surface methodol-
ogy,” in Proceedings of the XXI International Automotive Con-
ference SCIENCE & MOTOR VEHICLES, pp. 1–11, Beograd,
Serbia, 2007.
[37] P. N. Koch, J. P. Evans, and D. Powell, “Interdigitation for
effective design space exploration using iSIGHT,” Structural
and Multidisciplinary Optimization, vol. 23, no. 2, pp. 111–
126, 2002.
[38] C. Y. Liu, Analysis and optimization of aerodynamic character-
istics of a FSC racing car, Hunan University, 2018.
[39] Y. P. Wang, C. Wu, G. F. Tan, and Y. D. Deng, “Reduction in
the aerodynamic drag around a generic vehicle by using a non-
smooth surface. Automobile Engineering,” Proceedings of the
Institution of Mechanical Engineers Part D Journal of Automo-
bile Engineering, vol. 231, no. 1, pp. 1–15, 2016.
[40] T. W. Simpson, T. M. Mauery, J. J. Korte, and F. Mistree,
“Comparison of response surface and Kriging models for mul-
tidisciplinary design optimization,” in AIAA Paper 7 Th
AIAA/USAF/NASA/ISSMO Symposium on Multidisciplinary
Analysis & Optimization, pp. 381–391, St. Louis, MO, USA,
1998.
[41] D. R. Jones, M. Schonlau, and W. J. Welch, “Efficient global
optimization of expensive black-box functions,” Journal of
Global Optimization, vol. 13, no. 4, pp. 455–492, 1998.
[42] T. W. Simpson, T. M. Mauery, J. J. Korte, and F. Mistree,
“Kriging models for global approximation in simulation-
based multidisciplinary design optimization,” AIAA Journal,
vol. 39, no. 12, pp. 2233–2241, 2001.
[43] B. Gaspar, A. P. Teixeira, and C. G. Soares, “Assessment of the
efficiency of Kriging surrogate models for structural reliability
analysis,” Probabilistic Engineering Mechanics, vol. 37, pp. 24–
34, 2014.
[44] X. Z. Hu, X. Q. Chen, Y. Zhao, and W. Yao, “Optimization
design of satellite separation systems based on multi-island
genetic algorithm,” Advances in Space Research, vol. 53,
pp. 870–876, 2013.You can also read