RESEARCH & DATA ANALYTICS INDUSTRY - TOP 50 REPORT U.S., 2020 AUTHORED BY DIANE BOWERS IN PARTNERSHIP WITH THE INSIGHTS ASSOCIATION & MICHIGAN ...
←
→
Page content transcription
If your browser does not render page correctly, please read the page content below
RESEARCH & DATA
ANALYTICS INDUSTRY
TOP 50 REPORT
U.S., 2020
AUTHORED BY DIANE BOWERS IN PARTNERSHIP WITH THE
INSIGHTS ASSOCIATION & MICHIGAN STATE UNIVERSITY

SPONSORED BY: AMA, ESOMAR AND GRBN

                                                   1
An Opening Note
Two thousand and twenty has been a huge shock for our The American Marketing Association advances the
personal, public, and professional life in the U.S. and around profession and excellence of marketing through a
the world. Our industry (like every industry) has struggled to membership of 30,000 professional marketers and
sustain business by adopting new and different ways of working, academicians. Once again, AMA will be publishing
communicating, marketing, and providing services. As we the U.S. Top 50 Report in “Marketing News” in the fall
navigate through this difficult time and (hopefully soon) control issue.
and even vanquish this pandemic, I am confident that working
ESOMAR is the global voice of the data, research, and
together we will reestablish a stable and predictable environment
insights community. For many years ESOMAR has
and economy for our lives, our communities, and our businesses.
included the U.S. Top 50 Report in either their monthly
With the publication of the 2020 U.S. Top 50 Report, we are magazine or in their annual industry report. This
continuing to document the development, progress and year, ESOMAR published the U.S Top 50 Report in the
transformation of our industry. Over the past 47 years, this report recently-released ESOMAR Global Market Research
has focused on survey research and marketing research. Now, Report 2020.
with the expansion and transformation of our products and
The Global Research Business Network is an
services, we showcase the U.S. Research and Data Analytics
association of research business associations
Industry. This year we will be taking a broader view of the 2019
around the world. Its members include four regional
U.S. industry to include the full scope of current services among
federations and over 40 national associations. Its
the Top 50 companies and in the industry as a whole.
mission is to promote and advance the business of
“The 2020 U.S. Top 50 Report” is produced in partnership with research.
Insights Association and Michigan State University.
All of the associations and institutions that have partnered or
Insights Association—the U.S. association for sponsored the 2020 U.S. Top 50 Report are committed advocates
professionals, businesses, and corporate clients for the industry, its professionals, and its businesses. Please
in research, insights, and data analytics—will be connect with them—you can depend on their interest, their care,
publishing the Top 50 Report on their website. Also, IA and their knowledge.
has provided information about 211 research and data
analytics company members (outside of the Top 50
companies) so that we can broaden the assessment of
the U.S. industry. Table of Contents
Michigan State University is represented through its
“Research Transformed Collaborative,” an initiative
AN OPENING NOTE 2
launched and led by Michael Brereton, Professor in
the Department of Marketing, Eli Broad College of
2019 IN SUM 4
Business. As he has done in previous Top 50 Reports,
2019 IN DETAIL 5
Michael Brereton has contributed an update on the
transforming industry, featuring a new approach
TOP 50 COMPANIES 8
to defining and measuring the key segments of our
insights and analytics services.
2020 TOP 50 REPORT 13
In addition, I am pleased to announce that the 2020 U.S. Top 50
Report is sponsored by AMA, ESOMAR, and GRBN.
A MORE EXPANSIVE VIEW OF INSIGHTS 17
TOP 50: COMPANY PROFILES 19
2
Recruiting Expertise and Advanced Technology
for Global Qual and Quant Research Success

          COMPREHENSIVE ONLINE SOLUTIONS

         ONLINE QUANT                              ONLINE QUAL

        Highly effective automated                    A unique suite of
       processes of sampling, panel             innovative proprietary online
       management, and integrated               qualitative platforms helping
       global panel access via high            you deliver the most impactful
             API connectivity                          global insights          3
2019 In Sum
Total 2019 U.S. research revenue for the Top 50 companies, along      information was disclosed and appropriate adjustments were
with 211 Insights Association (IA) research company members is        made to ensure an apples-to-apples comparison.
$15,609.3 million. All of these 261 companies are research and
                                                                      The Top 50 companies also provided Profiles of their
analytics businesses whose areas of expertise and specialization
                                                                      companies, describing their services and specializations, major
reflect the breadth of our changing and expanding research
                                                                      accomplishments in 2019, and new initiatives and services
industry, which includes data analytics, strategic consulting
                                                                      moving forward.
services, technology services and platforms, as well as market,
opinion, social, and survey research. They are all for-profit firms   The additional 211 IA member companies reported a total of
that are either U.S. companies or have a U.S. headquarters and        $735.0 million in U.S. revenue in 2019. The median U.S. revenue
operations.                                                           of these 211 companies is under $1 million; while the average is
                                                                      $3.5 million. 30% of the 211 companies conduct research outside
The U.S. research revenue for the Top 50 companies in 2019 is
                                                                      of the U.S. These 63 companies account for a total of $98 million
$14,874.3 million, or 50.2% of the worldwide total revenue for the
                                                                      non-U.S. revenue in 2019.
Top 50 of $29,608.1 million.

                                                                      The total 2019 revenue for the 261 companies included in the U.S.
Non-U.S. 2019 revenue for the Top 50 companies is $14,733.8
                                                                      Top 50 Report is $30,441.1 million ($15,609.3 million U.S. revenue
million, or 49.8% of worldwide revenue.
                                                                      and $14,831.8 million non-U.S. revenue).
These companies were asked to submit 2019 U.S. and non-U.S.
                                                                      In 2019, these 261 companies had an estimated 53,707 full-time
research revenues, as well as the comparable data for 2018, in
                                                                      U.S. employees.
order to determine the annual rate of revenue growth or decline.
If a company made an acquisition or divestiture in 2019 that

                                                                                                                                           4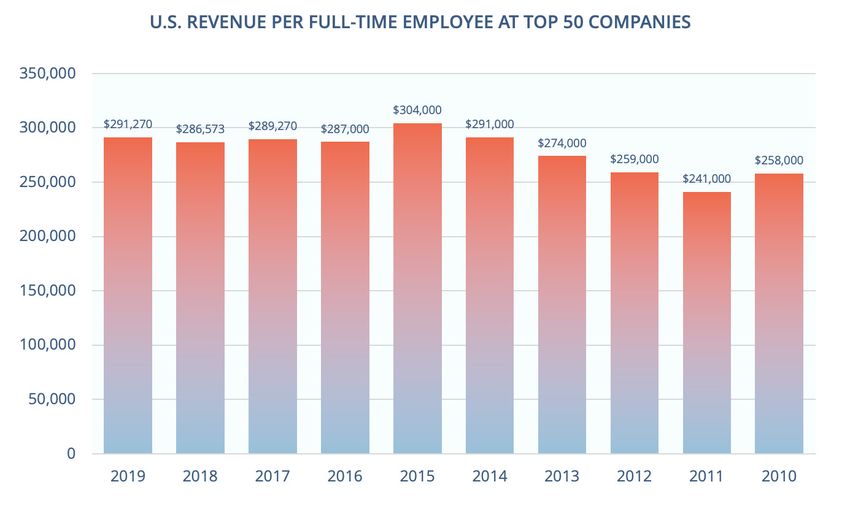
2019 In Detail
                                                Figure 1

TOP 50 & ALL OTHER IA
                                                 Top 50              Total # of               Total U.S.          Annual Revenue    “Real Growth”
MEMBERS GROWTH RATE                              Report In           Research                 Research            Growth Rate for   Rate (after CPI
                                                 Year . . .          Companies                Revenue (billion)   the Companies     adjustment)
The growth rate in the U.S. market for the
                                                                     included in the          included in the     included in the   in the Top 50
Top 50 companies in 2019 was 4.8%. The                               Top 50 Report            Top 50 Report       Top 50 Report %   Report %
growth rate for the Top 50 companies
and the 211 all other Insights Association       2008                196                      $8.9                1.6               -2.2
members was 4.6%. After adjustment
for inflation—Consumer Price Index (CPI)         2009                203                      $8.6                -3.7              -3.3
of 1.7%—the real-growth rate for 2019 is
                                                 2010                199                      $9.2                4.7               3.1
2.9%.
                                                 2011                204                      $9.2                5.1               2.9
Figure 1 compares the Top 50 Reports
for the past dozen years, showing the            2012                207                      $9.5                1.7               -.4

fluctuating recovery from the Great              2013                196                      $10.7               3.6               2.1
Recession in 2008 and 2009. There have
been three periods of back-to-back strong        2014                192                      $10.6               3.2               1.6

growth rates in the past twelve years:           2015                185                      $11.2               4.8               4.1
2010-2011; 2015-2016; and 2018-2019. In
                                                 2016                202                      $11.6               5.7               3.6
the first two back-to-back growth periods,
the growth rate increased YOY. The growth        2017                198                      $12.3               3.5               1.4
rate for 2018 and 2019, however, has
                                                 2018                269                      $14.5               5.6               3.7
reversed the pattern, with 2019’s 4.6%
growth rate declining one full percentage        2019                261                      $15.6               4.6               2.9
point from 2018’s 5.6% growth rate.

The annual U.S. Gross Domestic Product (GDP) growth rate offers                   Top 50 reports, the U.S. research industry’s annual growth rate,
another benchmark against which to measure the industry’s                         historically, has tracked ahead of the annual real GDP growth
annual growth. In Figure 2, the annual U.S. Real GDP Growth Rate                  rate, except in 2009 during the Great Recession and, again, in
shows the yearly growth of the estimated value of all the country’s               2012. In 2019 the 4.6% growth rate of the 261 companies in the
goods produced and services provided. As reported in previous                     Top 50 report doubled the Real GDP Growth Rate of 2.3%.

Figure 2

  Top 50 + “All Other”          2008     2009    2010         2011         2012        2013     2014       2015    2016      2017   2018      2019
  Members

  Real GDP Growth Rate*         -.3      -2.6    2.5          1.6          2.2         1.7      2.4        2.6     1.5       2.3    2.9       2.3
  %

  Top 50 Report U.S. Research   1.6      -3.7    4.7          5.1          1.7         3.6      3.2        4.8     5.7       3.5    5.6       4.6
  Growth Rate %

  U.S. Research Industry Net    1.9      -1.1    +2.2         +3.5         -.5         +1.9     +.8        +2.2    +4.2      +1.2   +2.7      +2.3
  Increase/Decline Compared
  to real GDP growth rate %
                                                                                                                                                      5
*Bureau of Economic Analysis and World Bank
TOP 50 GLOBAL GROWTH Figure 3
RATE
Top 50 U.S. Non-U.S. Worldwide % Non-U.S. Number of
Figure 3 shows the global growth rate and
Revenue $ Revenue $ Total Revenue Companies
percentage of total revenue for the Top (000) (000) Revenue $ without
50 companies for the past 10 years. There (000) International
was a surprising development in the Top Revenue
50 global revenue data for 2019. For the
2010 $9,246.2 $10,421.4 $19,697.7 52.9% 15
first time in many, many years, non-U.S.
revenue did not exceed U.S. revenue for 2011 $9,190.0 $10,686.5 $19,876.5 53.8% 12
the Top 50 companies. Top 50 global
2012 $8,693.2 $10,298.9 $18,992.1 54.2% 10
revenue in 2019 was $14,733.8 million or
49.8% of total Top 50 revenue. 2013 $9,825.6 $11,480.7 $21,306.3 53.9% 8
The global revenue growth rate for the 2014 $9,895.6 $11,962.5 $21,858.1 54.7% 10
Top 50 was 3.0% in 2019, which is one 2015 $10,464.2 $11,318.0 $21,782.2 52.0% 9
percentage point lower than the average
global revenue growth rate for the past 2016 $10,552.7 $12,195.0 $22,747.7 53.6% 8
four years, and 1.8% lower than the 2017 $11,249.7 $12,839.7 $24,089.4 53.3% 9
growth rate for U.S. revenue.
2018 $13,634.0 $14,793.1 $28,427.1 52.0% 8
2019 $14,874.3 $14,733.8 $29,608.1 49.8% 8
THE EMPLOYMENT PICTURE
In 2019 the number of full-time U.S. employees among the Top 50 companies was 51,067,
an increase of 7.3% over 2018.
For the Top 50 companies the U.S. revenue per full-time employee in 2019 was $291,270.
Figure 4 shows how revenue per employee for the Top 50 has trended since 2010.
Figure 4
6Connect the Dots
Elevate your research from
Information to Inspiration
7
inspiredinsight.io | inspiredhealth.ioTop 50 Companies
NEW THIS YEAR Top 50 companies in the Top 50 Reports for the past four years.
There are three returning Top 50 companies: In 2019, 28% (14) of the Top 50 companies reported double-digit
increases in YOY revenue, with an average increase of 17.2%. Five
At #25, Burke, Inc., established in 1931 and
out of the fourteen companies achieved 20% or more YOY growth
headquartered in Cincinnati, continues to push
in 2019.
the boundaries of what marketing research can be,
seamlessly uniting research, strategy, and education, #11, Forrester Research Services (Cambridge, MA),
with a long tradition of innovation. realized a 32.9% increase, in part because of the
acquisition of SiriusDecisions, providing operational
At #45, NAXION, established in 1911 and
research services to B2B firms.
headquartered in Philadelphia, guides strategic
business decisions globally in healthcare, information #39, The Link Group (Atlanta, GA), which provides
technology, financial services, energy, heavy quantitative and qualitative research for the
equipment, and other B2B markets. healthcare, retail, CPG, and finance industries,
increased their 2019 revenue by 23.9%.
At #50, RTi, established in 1979 and headquartered in
Norwalk, CT, turns data into meaning through smart #29, Cello Health plc (New York, NY), which includes
research design, flawless execution, and innovative four global capabilities-Insight, Consulting,
storytelling all of which helps clients influence Communication, and Signal (a digital platform),
organizational change. increased its 2019 revenue by 23.3%.
#29, Fors Marsh Group (Arlington, VA), which utilizes
NOT HERE THIS YEAR behavioral and data science to improve organizational
There are three previous Top 50 companies that are not on the list processes, business solutions, and customer
this year: experiences, increased their 2019 revenue by 22.1%.
FocusVision, in Stamford, CT, did not respond to the #42, Chadwick Martin Bailey (Boston, MA), a
invitation email. consultative primary research company providing
insights and strategy on brand development and
LRA, a Deloitte Company in Horsham, PA, chose not to
management, increased their 2019 revenue by 20.6%.
participate this year.
40% or 20 of the Top 50 companies reported single-digit increases
Research America, in Newtown Square, PA, chose not
in YOY revenue, with the average percent of increase at 3.9%.
to participate this year.
The 34 companies (68% of the Top 50) that had revenue increases
in 2019 exceeding the rate of inflation averaged 8.6% increase
NAMES CHANGES
in revenue. These 34 companies were responsible for $9,697.3
Only one company had a name change this year:
million (65.2%) of the total 2019 U.S. revenue of $14,874.3 million.
At #14, Material is the new brand name for Lieberman
32% of the Top 50 companies or 16 companies realized a
Research Worldwide (LRW Group), which acquired five
decrease in revenue or their 2019 revenue growth did not exceed
companies in 2018 and is taking steps to unify these
the rate of inflation (1.7%). These 16 companies represented
companies under one brand.
$5,177.0 million or 34.8% of total 2019 U.S. revenue for the Top
50 companies. It is notable that the average decrease in 2019
REVENUE INCREASES AND DECREASES revenue for these 16 companies was -1.6%, which is the lowest
average decrease in revenue growth in the last five years.
Figure 5 compares U.S. revenue increases and decreases for the
8Figure 5
Double-digit Revenue Increases Increases that are Single-digit and Flat (increase does not exceed TOTAL
exceed Inflation Rate inflation rate) and Revenue ANNUAL
decreases U.S.
REVENUE
from Top 50
Year # Cos. Avg. Rate Total # Cos. Ave. Total # Cos. Ave. Total Report
of YOY Revenue Rate Revenue Rate Revenue
Growth (% of Total of YOY (% of Total of YOY (% of
Top 50 U.S. Growth Top 50 U.S. Growth Total Top
Revenue) Revenue) 50 U.S.
Revenue)
2019 14 17.2% $1,569.0 20 3.9% $8,128.3 16 -1.6% $5,177.0 $14,874.3
(10.5%) (54.7%) (34.8%)
2018 13 22.7% $2,320.2 25 4.7% $9,467.5 12 -4.9% $1,846.3 $13,634.0
(17.0%) (69.5%) (13.5%)
2017 10 18.6% $1,880.7 16 5.5% $6,158.1 24 -4.7% $3,210.9 $11,249.7
(16.7%) (54.7%) (28.6%)
2016 19 21.2% $2,455.5 16 4.3% $3,498.9 15 -3.7% $4,598.3 $10,552.7
(23.3%) (33.1%) (43.6%)
2015 15 21.2% $1,437.9 19 4.0% $7,023.8 16 -8.8% $2,002.5 $10,464.2
(13.8%) (67.1%) (19.1%)
CHANGES IN TOP 50 RANKINGS of non-US research at 80% of their total revenue.
GfK connects data and science through innovative
The changes in ranking for the 47 Top 50 companies that were
research solutions to answer clients’ questions about
included in last year’s Top 50 report were fairly evenly divided,
consumers, markets, brands, and media.
with 13 companies moving up in the Top 50 ranking, 17 moving
down in the ranking, and 17 maintaining their same position as #9, comScore (Reston, VA) founded in 1999, provides
last year. Of the 30 companies that changed their ranking, 77% cross-platform measurement of audiences, advertising
moved only one or two positions up or down in the ranking. and consumer behavior through products and
solutions that are powered by industry-leading census,
THE TOP TEN big data and panel information assets that serve 3,200
clients around the world.
Nielsen, IQVIA, Gartner Research, Kantar, Information Resources,
Inc. (IRI), Ipsos, Westat, The NPD Group, comScore, and GfK #8, The NPD Group (Port Washington, NY) founded
together realized 2019 U.S. revenue of $11.93 billion and non-U.S. in 1966, combines data, industry expertise, and
revenue of $12.80 billion, for a total worldwide revenue of $24.73 prescriptive analytics across many industries to
billion. measure markets, predict trends, and improve
performance. NPD’s syndicated services include retail
The U.S. revenue for the Top Ten represents over 80% of the total
tracking, distributor tracking, and consumer tracking.
U.S. revenue for the Top 50 companies and 76.4% of the total
2019 U.S. revenue for the 261 companies included in this report. #7, Westat (Rockville, MD) founded in 1963, is a 100
The Top Ten’s non-U.S. revenue in 2019 represents 86.9% of the percent employee-owned research and professional
total non-U.S. revenue for the Top 50 companies, and 86.3% of services company that provides extensive survey
the total non-U.S. revenue for all 261 companies. design and operations capabilities in support of
modern data collection from households, institutions,
#10, GfK (New York, NY) founded in 1934, continues
businesses, and individuals.
to lead the Top Ten with the largest percentage
9 #6, Ipsos (New York, NY) founded in 1975, Ipsos covers helping healthcare clients find better solutions for
the whole information production and analysis chain, patients by applying human data science to enable
from the collection of raw data to the activation of companies to reimagine and develop new approaches.
the information generated with the client, along
#1, Nielsen (New York, NY) founded in 1923, provides
with a solid tradition of innovation through new
a comprehensive understanding of what consumers
methodological developments and products.
watch and what they buy and how those choices
#5, Information Resources Inc. (Chicago, IL) founded in intersect and it delivers critical media and marketing
1979, a provider of big data, predictive analytics and information, analytics and manufacturer and retailer
forward-looking insights that help CPG, OTC health expertise.
care organizations, retailers, financial services and
The Top 10 companies’ total 2019 revenue of $24.73 billion
media companies grow their businesses and connect
represents 83.5% of the total Top 50 companies’ 2019 revenue
with consumers and key constituents.
and 81.2% of total 2019 revenue for the 261 companies included
#4, Kantar (New York, NY) founded in 1993, is a in this year’s Top 50 Report. Nielsen itself with its $6.49
data, insights, and consulting company providing billion accounts for 21.3% of the total 2019 revenue for all 261
techniques and technologies, from purchase and companies.
media data to predicting long term trends; from
neuroscience to exit polls; from quantitative to
REVENUE BY INDUSTRY SERVED AND BY
qualitative research, incorporating ethnography and
semiotics. TYPE OF SERVICE
We asked the Top 50 companies (a) to estimate the percent of
#3, Gartner Research (Stamford, CT) founded in 1972, their annual U.S. revenue by the client industry and also (b)
is the largest of four business segments in Gartner to estimate the percent of revenue by the type of service they
Inc., delivering objective advice to leaders across the provided to their clients.
enterprise, primarily through a subscription-based
digital media service, combining proprietary research
methodologies with extensive industry relationships.
REVENUE BY INDUSTRY SERVED
The first question is included in the annual ESOMAR Global
#2, IQVIA (Danbury, CT; Durham, NC) founded in Market Research Report, so the data are useful for comparative
2016, provider of information, innovative technology purposes.
solutions and contract research services focused on
Figure 6
10REVENUE BY TYPE OF SERVICE PROVIDED The data in this second question provide a touchpoint for us to
gauge whether and to what extent the Top 50 companies are
The second question aligns with our efforts to assess and
exploring and/or investing in new services and new approaches.
measure the transformation of the industry, including new
markets, new methods, and new tools. Figure 7
2019 U.S. RESEARCH & ANALYTICS ABOUT THE AUTHOR
INDUSTRY: THE FULL SCOPE Diane Bowers is a consultant to research and data analytics
For many years I have measured the U.S. research industry for businesses and industry associations, in the U.S. and
ESOMAR’s annual Global Market Research Report. The scope of internationally. Formerly, she was the president of CASRO, Board
that process has expanded over time, and I now conduct research Chair of the Global Research Business Network, a Board member
and analysis of four broad industry segments in order to estimate of the Americas Research Industry Alliance, and a Board member
the annual revenue of the U.S. research and data analytics of The Roper Center for Public Opinion Research at Cornell
industry. University. She is also a past president of the Market Research
Council and the Research Industry Coalition, and a long-time
Here are the segments and my estimate of the annual U.S. member of AAPOR, AMA, and ESOMAR.
revenue for each segment. My estimates are conservative,
focusing on both avoiding double-counting of revenue and
ensuring that the revenue is attributable to our industry.
METHODOLOGY
”Traditional” survey/market/qual/quant research, for- Invitations to marketing research and analytics firms
profit companies-- $16,730.7 million with estimated revenue more than $12 million are
sent out requesting revenue information for the prior
Technology-enabled (includes DIY)-- $6,545.0 million calendar year and for the year preceding that, in
order to assess the growth rate. Other company data
Advisory/Consulting services-- $2,985.0 million
are also requested, including a description of the
Web, text, data analytics-- $2,525.0 million company’s management, services, specializations,
etc. Top 50 rankings are based on U.S. revenue. The
Based on the estimated revenue for these four segments, the
rate of growth from year to year has been adjusted to
2019 revenue for the U.S. research and data analytics industry
account for revenue gains or losses from acquisitions or
was $28,785.7
divestitures. Verification of revenue is required of each
This list of segments serves as an introduction to Michael private firm for ranking by a third party, generally it’s the
Brereton’s article, co-authored with Reg Baker and Melanie outside accounting firm.
Courtright, on “Measuring the Transformation of Insights &
Analytics,” which will be published separately as part of ESOMAR’s
Global Market Research Report 2020. 111 P R O T E C T C O N N E C T I N F O R M P R O M O T E
2020 Top 50 Report
                                                                                                       2019 Research Revenue                                         2018 Research Revenue

US      US                                                                                     U.S. Market                                      2019 US
Ranck   Rank                        U.S.              Year                                     YOY %          Non-US       Worldwide   %        Full Time   US            Non-US       Worldwide
2020    2019   Organization         Headquarters      Founded   Website            US Market   Change         Market       Total       Non-US   Employees   Market        Market       Total

1       1      Nielsen**            New York, NY      1923      nielsen.com        $3,875      1.6%           $2,623       $6,498      40.4%    10,300      $3,815        $2,700      $6,515

2       3      IQVIA* **            Danbury, CT;      2016      iqvia.com          $2,220      8.6%           $2,166       $4,386      49.4%    6,000       $2,045        $2,092      $4,137
                                    Durham, NC

3       2      Gartner Research**   Stamford, CT      1972      gartner.com        $1,800      4.7%           $1474.5      $3,274.5    45%      4,500       $1,720        $1,385.8    $3,105.8

4       4      Kantar**             New York, NY      1993      kantar.com         $950        2.7%           $2,900       $3,850      75.3%    3,585       $925          $2,890      $3,815

5       5      IRI (Information     Chicago, IL       1979      iriworldwide.com   $815.0      1.9%           $510         $1,325.0    38.5%    3,639       $800          $500        $1,300
               Resources, Inc.)**

6       6      Ipsos*               New York, NY      1975      ipsos.com          $682.0      16.2%          $1,685       $2,367      71.2%    2,025       $587          $1,389      $1,976

7       7      Westat**             Rockville, MD     1963      westat.com         $590        3.5%           $7.0         $597        1.2%     1,900       $570          $7.0        $577

8       9      The NPD Group        Port              1966      npd.com            $339.5      8.6%           $104.5       $444        23.5%    1,185       $312.7        $99.8       $412.5
                                    Washington, NY

9       8      comScore* **         Reston, VA        1999      comScore.com       $336.1      -6.5%          $52.5        $388.6      13.5%    870         $359.4        $60.1       $419.5

10      10     GfK**                New York, NY      1934      gfk.com            $320.0      3.2%           $1,280       $1,600      80.0%    860         $310          $1,275      $1,585

11      12     Forrester Research   Cambridge, MA     1983      forrester.com      $233.7      32.9%          $65          $298.7      21.8%    525         $175.9        $52.5       $228.4
               Services**

12      11     J.D. Power**         Costa Mesa, CA    1968      jdpower.com        $217        3.3%           $113         $330        34.2%    744         $210          $110        $320

13      13     ICF*                 Fairfax, VA       1969      icf.com            $173.7      0.5%           $52.6        $226.3      23.2%    5,311       $172.8        $65.8       $238.6

14      16     Material*            Los Angeles, CA   1973      materialplus.io    $166.7      0.3%           $57.9        $224.6      25.8%    1,038       $138.6        $48.9       $187.5

                                                                                                                                                                                                   13
2019 Research Revenue 2018 Research Revenue
US US U.S. Market 2019 US
Ranck Rank U.S. Year YOY % Non-US Worldwide % Full Time US Non-US Worldwide
2020 2019 Organization Headquarters Founded Website US Market Change Market Total Non-US Employees Market Market Total
15 14 Wood Mackenzie** New York, NY 1973 woodmac.com $150.0 3.4% $335.0 $485.0 69.1% 337 $145.0 $315.0 $460.0
16 15 DRG (Decision Burlington, MA 1990 ionresourcesgroup.com $140 2.2% $53 $193 27.5% 399 $137 $53.0 $190.0
Resources Group)**
17 17 MaritzCX** Lehi, UT 1973 maritzcx.com $118.0 0.0% $44.0 $162.0 27.2% 600 $118.0 $44.0 $162.0
18 20 NRC Health Lincoln, NE 1981 nrchealth.com $113.0 10.8% $3.6 $116.6 3.1% 448 $102.0 $4.2 $106.2
19 18 Informa Financial Boston, MA 2016 nancialintelligence. $107.0 1.9% $36.0 $143.0 25.2% 500 $105.0 $35.0 $140.0
Intelligence** informa.com
20 19 dunnhumby** Cincinnati, OH 2001 dunnhumby.com $100.0 -3.8% $335.0 $435.0 77.0% 230 $104.0 $356.0 $460.0
21 21 Escalent Livonia, MI 1975 escalent.co $97.1 -3.4% $5.5 $102.6 5.4% 352 $100.5 $3.4 $103.9
22 22 Concentrix** Fremont, CA 1983 concentrix.com $95.0 11.8% $130.0 $225.0 57.8% 253 $85.0 $115.0 $200.0
23 23 Phoenix Marketing Rhinebeck, NY 1999 phoenixmi.com $77.0 -3.8% $4.5 $81.5 5.5% 343 $80.0 $5.4 $85.4
International
24 27 YouGov* Redwood City, 2000 yougov.com $76.8 11.8% $107.5 $184.3 58.3% 212 $68.7 $98.1 $166.8
CA
25 - Burke Cincinnati, OH 1931 burke.com $71.1 9.0% $6.9 $78.0 8.8% 253 $65.2 $8.8 $74.0
26 25 Engine New York, NY 1938 engine-insights.com $71.0 4.4% $44.0 $115.0 38.3% 240 $68.0 $42.0 $110.0
Insights**
27 24 C Space** Boston, MA 1999 cspace.com $70.0 2.9% $18.0 $88.0 20.5% 354 $68.0 $18.0 $86.0
28 26 Macromill Group** Cincinnati, OH 2000 macromill.com $68.5 2.2% $260.0 $328.5 79.1% 275 $67.0 $260.0 $327.0
29 37 Cello Health plc* New York, NY 2004 cellohealthplc.com $64.5 23.3% $58.5 $123.0 47.6% 260 $52.3 $65.9 $118.2
**
30 28 NRG (National Los Angeles, CA 1978 nationalresearchgroup. $59.0 1.7% $4.0 $63.0 6.3% 200 $58.0 $4.0 $62.0
Research Group)** com
142019 Research Revenue 2018 Research Revenue
US US U.S. Market 2019 US
Ranck Rank U.S. Year YOY % Non-US Worldwide % Full Time US Non-US Worldwide
2020 2019 Organization Headquarters Founded Website US Market Change Market Total Non-US Employees Market Market Total
31 33 Fors Marsh Group Arlington, VA 2002 forsmarshgroup.com $57.5 22.1% $0.0 $57.5 0.0% 263 $47.1 $0.0 $47.1
(FMG)*
32 32 Directions Research Cincinnati, OH 1988 directionsresearch.com $54.2 17.8% $0.0 $54.2 0.0% 181 $46.0 $0.0 $46.0
33 31 Hanover Research Arlington, VA 2003 hanoverresearch.com $52.7 14.1% $2.6 $55.3 4.7% 358 $46.2 $2.8 $49.0
34 29 SMG** Kansas City, MO 1991 smg.com $52.0 4.0% $6.0 $58.0 10.3% 400 $50.0 $6.5 $56.5
35 30 Market Force** Louisville, CO 2005 marketforce.com $50.0 2.0% $7.0 $57.0 12.3% 375 $49.0 $7.5 $56.5
36 35 Radius GMR New York, NY 1960 radius-global.com $42.0 0.0% $1.0 $43.0 2.3% 127 $42.0 $1.0 $43.0
37 38 BVA Group** Teaneck, NJ 1970 bva-group.com/en $36.0 2.6% $147.0 $183.0 80.3% 120 $35.1 $146.9 $182.0
38 39 SSRS Glen Mills, PA 1983 ssrs.com $34.3 -1.2% $1.2 $35.5 3.4% 233 $34.7 $0.4 $35.1
39 42 The Link Group Atlanta, GA 1994 tlg.com $34.2 23.9% $0.3 $34.5 0.9% 85 $27.6 $1.7 $29.3
40 40 MarketVision Cincinnati, OH 1983 mv-research.com $33.2 2.5% $0.0 $33.2 0.0% 140 $32.4 $0.0 $32.4
Research
41 41 Screen Engine/ASI Los Angeles, CA 2010 screenengineasi.com $33.0 10.0% $1.9 $34.9 5.4% 132 $30.0 $0.0 $30.0
42 45 Chadwick Martin Boston, MA 1984 cmbinfo.com $28.7 20.6% $0.0 $28.7 0.0% 90 $23.8 $0.0 $23.8
Bailey
43 43 Maru/Matchbox** Chicago, IL 2016 marumatchbox.com $28.0 3.7% $14.0 $42.0 33.3% 150 $27.0 $14.0 $41.0
44 44 Gongos, Inc. Royal Oak, MI 1991 gongos.com $24.2 -3.6% $1.2 $25.4 4.7% 144 $25.1 $1.9 $27.0
45 - NAXION Philadelphia, PA 1911 naxionthinking.com $22.7 12.9% $0.0 $22.7 0.0% 78 $20.1 $0.0 $20.1
46 46 KS&R Syracuse, NY 1983 ksrinc.com $21.7 -1.4% $3.6 $25.3 14.2% 100 $22.0 $2.8 $24.8
47 49 Edelman Intelligence New York, NY 1999 edelmanintelligence. $21.0 12.9% $11.5 $32.5 35.4% 131 $18.6 $11.0 $29.6
com
152019 Research Revenue 2018 Research Revenue
US US U.S. Market 2019 US
Ranck Rank U.S. Year YOY % Non-US Worldwide % Full Time US Non-US Worldwide
2020 2019 Organization Headquarters Founded Website US Market Change Market Total Non-US Employees Market Market Total
48 47 Bellomy** Winston-Salem, 1976 bellomy.com $21.0 1.4% $0.0 $21.0 0.0% 116 $20.7 $0.0 $20.7
NC
49 48 Hypothesis Los Angeles, CA 2000 hypothesisgroup.com $18.3 -4.7% $0.0 $18.3 0.0% 61 $19.2 $0.0 $19.2
50 - RTi Norwalk, CT 1979 Rtiresearch.com $12.9 -3.0% $0.0 $12.9 0.0% 45 $13.2 $0.0 $13.2
$14,874.3 4.8% $14,733.8 $ 29,608.1 49.8% 51,067 $14,194.9 $14,300.2 $28,495.1
All Other Insights Association Research Company Members $735 1.4% $98.0 $833.0 11.8% 2,100 $725 $110 $835
(211 companies not included in the Top 50)
Total $ 15,609.3 4.6% $14,831.8 $30,441.1 48.7% 53,707 $ 14,919.9 $14,410.2 $29,330.1
* ‘’% Change’ calculation reflects adjustment of previously reported 2018 U.S. Research Revenue due to acquisition/divestiture activity or other business change during 2019
** ‘Some or all figures are not made available by this company so instead are based upon research and estimation by the Report author
- ‘This company did not participate in last year’s Top 50 Report
16A More Expansive View
of Insights
This Top 50 Report has long been the industry standard for Digital Data Analytics, Social Listening & Communities, and
annually documenting US market sizing and patterns in the Consulting Firms.
business of marketing research. It has traditionally focused
While the Top 50 Report lists companies yielding about USD
on only the ‘Full Service’ research agency segment, which
$15 billion in aggregate revenue, this new Insights & Analytics
now reflects only a limited portion of the broader market size
definition with its much-expanded list of ‘insights’ activities, tracks
assumed in a model of industry transformation.
companies yielding about USD $47 billion in aggregate revenue.
To assess the size, growth, and largest players in a more
Read More about Measuring the Transformation of
broadly defined insights landscape, a collaborative effort was
Insights & Analytics
undertaken this year by ESOMAR, the Insights Association,
and the Master of Science in Marketing Research Program at Access the Top 50 Expanded Insights & Analytics
Michigan State University. Market List
Using data provided by the analytics company Outsell, we View the 8 Market Segment Leader Lists
developed a taxonomy that defines a broadened Insights &
For a discussion of many of these same issues from a
Analytics market that includes eight industry segments: Full
global perspective, consult the ESOMAR Global Market
Service Research, Syndicated & Vertical Reports, Sample Panel
Research Report 2020
Providers, DIY Platforms, EFM (Enterprise Feedback Mgmt.),
17THROUGH THE PEAKS AND VALLEYS,
AND EVERYWHERE IN-BETWEEN.
WE’VE GOT IT COVERED.
ONLINE QUAL | ONLINE DIAL TESTING | IN-PERSON DIAL TESTING
18
www.dialsmith.com1
Connect’s set of guiding truths, businesses have the tools to
create new opportunities.
On November 7, 2019, Nielsen announced its plan to spin-off the
NIELSEN** company’s Global Connect business, creating two independent,
publicly traded companies -- the Global Media business and the
Global Connect business.
nielsen.com **Some or all figures are not made available by this company so instead are
Founded: 1923 based on research and estimation by the Report author
David Kenny
CEO and Chief Diversity Officer
MBA, Harvard University 2
2019 U.S Revenue:
Percent Change from 2018:
$3,875.0 million
1.6%
IQVIA* **
2019 Non-U.S. Revenue: $2,623.0 million
Percent from Outside U.S.: 40.4%
2019 Worldwide Revenue: $6,498.0 million iqvia.com
U.S. Employees: 10,300 Founded: 2016
Other Offices: Multiple offices in the U.S. and offices in over 100 Ari Bousbib
countries Chairman and CEO
MBA, Columbia University
Nielsen is a global measurement and data analytics company that
provides a complete and trusted view of consumers and markets 2019 U.S Revenue: $2,220.0 million
worldwide. Nielsen is divided into two business units: Nielsen Percent Change from 2018: 8.6%
Global Media and Nielsen Global Connect. 2019 Non-U.S. Revenue: $2,166.0 million
Percent from Outside U.S.: 49.4%
Nielsen Global Media provides media and advertising clients
2019 Worldwide Revenue: $4,386.0 million
with unbiased and reliable metrics that create the shared
U.S. Employees: 6,000
understanding of the industry required for markets to function,
enabling its clients to grow and succeed across the $600 billion Other Offices: Multiple offices in the U.S. and offices in more than
global advertising market. Nielsen Global Media helps clients 100 countries
to define exactly who they want to reach, as well as optimize
the outcomes they can achieve. The company’s cross-platform IQVIA is a global provider of information, innovative technology
measurement strategy brings together the best of TV and digital solutions and contract research services focused on helping
measurement to ensure a more functional marketplace for the healthcare clients find better solutions for patients. Formed
industry. through the 2016 merger of Quintiles and IMS Health, IQVIA
applies human data science – leveraging the analytic rigor and
Nielsen Global Connect provides consumer packaged goods clarity of data science to the ever-expanding scope of human
manufacturers and retailers with accurate, actionable information science – to enable companies to reimagine and develop new
and a complete picture of the complex and changing marketplace approaches to clinical development and commercialization,
that brands need to innovate and grow their businesses. Nielsen speed innovation, and accelerate improvements in healthcare
Global Connect provides data and builds tools that use predictive outcomes.
models to turn observations in the marketplace into business
decisions and winning solutions. The business’s data and IQVIA has three operating segments: Technology & Analytics
insights, combined with its open, cloud native measurement and Solutions, Research & Development Solutions, and Contract
analytics platform that democratizes the power of data, continue Sales & Medical Solutions. For purposes of this report on the
to provide an essential foundation that makes markets possible research and data analytics industry, only the revenue from the
in the rapidly evolving world of commerce. With Nielsen Global Technology & Analytics Solutions segment has been included.
19Powered by the IQVIA CORE™, we deliver unique and actionable Other Offices: Multiple offices in the U.S. and offices in over 100
insights at the intersection of large scale analytics, transformative countries
technology and extensive domain expertise, as well as execution
Gartner Research delivers independent, objective advice to
capabilities to help biotech, medical device, and pharmaceutical
leaders across an enterprise through subscription services that
companies, medical researchers, government agencies,
include on-demand access to published research content, data
payers and other healthcare stakeholders tap into a deeper
and benchmarks, and direct access to a network of approximately
understanding of diseases, human behaviors and scientific
2,300 research experts located around the globe. Gartner research
advances, in an effort to advance their path toward cures.
is the fundamental building block for all Gartner products and
IQVIA has one of the largest and most comprehensive collections services. We combine our proprietary research methodologies
of healthcare information in the world, which includes more than with extensive industry and academic relationships to create
800 million comprehensive, longitudinal, non-identified patient Gartner products and services that address each role across an
records spanning sales, prescription and promotional data, enterprise.
medical claims, electronic medical records, genomics, and social
Within the Research segment, Global Technology Sales (“GTS”)
media. Our scaled and growing information set contains over 35
sells products and services to users and providers of technology,
petabytes of proprietary data sourced from more than 150,000
while Global Business Sales (“GBS”) sells products and services to
data suppliers and covering over one million data feeds globally.
all other functional leaders, such as supply chain, marketing, HR,
Based on this data, we deliver information and insights on over
finance, legal and sales.
85% of the world’s pharmaceuticals, helping our clients run
their organizations more efficiently and make better decisions to Our research agenda is defined by clients’ needs, focusing on
improve their clinical, commercial and financial performance. the critical issues, opportunities and challenges they face every
* ‘% Change’ calculation reflects adjustment of previously reported 2018 U.S. day. We are in steady contact with over 15,000 distinct client
research revenue due to acquisition/divestiture activity or other business enterprises worldwide. We publish tens of thousands of pages of
change during 2019. original research annually, and our research experts have more
**Some or all figures are not made available by this company so instead are than 400,000 direct client interactions every year.
based on research and estimation by the Report author
Our proprietary research content, presented in the form of
reports, briefings, updates and related tools, is delivered directly
3 to the client’s desktop via our website and/or product-specific
portals. Clients normally sign subscription contracts that
provide access to our research content and advisory services
GARTNER RESEARCH** for individual users over a defined period. We typically have a
minimum contract period of twelve months for our research
and advisory subscription contracts and, at December 31, 2019,
a significant portion of our contracts were multi-year.delivers
gartner.com independent, objective advice to leaders across the enterprise,
Founded: 1972 primarily through a subscription-based digital media service.
Gartner research is the fundamental building block for all Gartner
Eugene A. Hall services. We combine our proprietary research methodologies
CEO with extensive industry and academic relationships to create
MBA, Harvard University Gartner solutions that address each role.
2019 U.S. Revenue: $1,800.0 million **Some or all figures are not made available by this company so instead are
Percent Change from 2018: 4.7% based on research and estimation by the Report author
2019 Non-U.S. Revenue: $1,474.5 million
Percent from Outside U.S.: 45.0%
2019 Worldwide Revenue: $3,274.5
U.S. Employees: 4,500
204
analytical capabilities from across the company into
one resource that unlocks deeper insights to fuel
growth.
KANTAR** Kantar’s strength lies in the unrivalled diversity of our people,
methodologies, specialisms and points of view that seamlessly
fuse to give us a unique and complete understanding of people,
kantar.com across the world. We go beyond the obvious – with intelligence,
Founded: 1993 passion and creativity – to discover new directions, set strategies
and plan actions that inspire extraordinary success.
Eric Salama* **Some or all figures are not made available by this company so instead are
Chairman and CEO based on research and estimation by the Report author
MSc, Birkbeck College, London
5
*Eric Salama stepped down as Kantar CEO in February 2020
2019 U.S Revenue: $950.0 million
Percent Change from 2018: 2.7%
2019 Non-U.S. Revenue: $2,900.0 million INFORMATION RESOURCES,
Percent from Outside U.S.: 75.3%
2019 Worldwide Revenue: $3,850.0 million INC. (IRI)**
U.S. Employees: 3,585
Other Offices: Multiple offices in the U.S. and offices in 100
iriworldwide.com
countries
Founded: 1979
Kantar is one of the world’s largest data, insights and consulting
companies, bringing together some of the world’s leading
Andrew M. Appel
President and CEO
research, data and insights expertise. Our offer covers the breadth
MBA, University of Chicago
of techniques and technologies, from purchase and media data
to predicting long term trends; from neuroscience to exit polls; 2019 U.S Revenue: $815.0 million
from large scale quantitative studies to qualitative research, Percent Change from 2018: 1.9%
incorporating ethnography and semiotics. 2019 Non-U.S. Revenue: $510.0 million
Percent from Outside U.S.: 38.5%
In April 2019, all services and offerings of the various Kantar
2019 Worldwide Revenue: $1,325.0 million
companies were combined under the Kantar brand name. This
U.S. Employees: 3,639
operational change enables Kantar to build platforms and offers
on a global scale and to remove barriers to collaboration and co- Other Offices: Multiple offices in the U.S. and Puerto Rico and in
creation within the organization to better meet client’s needs. Australia, Canada, France, Germany, Greece, Hong Kong, Italy,
Korea, Netherlands, New Zealand, South Africa, Spain, Sweden,
As part of this branding strategy, we launched several initiatives:
United Kingdom
Kantar Marketplace, a global on-demand research and
IRI is a leading provider of big data, predictive analytics and
insights store
forward-looking insights that help CPG, OTC health care
Kantar’s new Brand Guidance System that intelligently organizations, retailers, financial services and media companies
integrates validated survey measures with social, grow their businesses. A confluence of major external events — a
search, sales media, and behavioral data to provide change in consumer buying habits, big data coming into its own,
actionable insights to optimize brand or campaign advanced analytics and personalized consumer activation — is
performance leading to a seismic shift in drivers of success in all industries.
With the largest repository of purchase, media, social, causal
Integration of big data, artificial intelligence, and
and loyalty data, all integrated on an on-demand, cloud-based
21technology platform, IRI is empowering the personalization activates this vision for more than 5,000 customers through its
revolution, helping to guide its more than 5,000 clients around presence in 90 markets both globally and locally. Ipsos covers
the world in their quests to remain relentlessly relevant, capture the whole information production and analysis chain, from the
market share, connect with consumers, collaborate with key collection of raw data to the activation of the insights. It has a
constituents and deliver market-leading growth. solid tradition of innovation expressed by new methodological
developments and continuously renewed product range.
2019 was a year of significant achievements for IRI as we
announced the integration of artificial intelligence and machine 2019 was the first full year of Ipsos’ growth strategy, Total
leading into our leading suite of analytics solutions; retained Understanding, which created 17 Service Lines and brought
100% of our major CPG clients and welcomed new strategic together more than 75 different services for greater specialization,
partnerships with top retailers in the U.S. We continued to grow speed and consistency in all markets. It was also the first year
our team, adding several innovators to our leadership team, integrating our acquisitions of four key divisions of GfK Research,
while continuing to invest in our employees by providing ongoing and Synthesio, a leader in platforms dedicated to listening to the
training. web and analyzing social media data. The results were a clear
success, as 2019 was a milestone year as Ipsos passed the €2
**Some or all figures are not made available by this company so instead are
based on research and estimation by the Report author billion mark.
2020 has demonstrated the critical need for our services as
6
we have developed new offerings and new ways of working
to continue providing our clients with the data and analyses
that is irreplaceable for understanding their customers and
markets. Ipsos remains committed to improving its operational
IPSOS* performance by developing new tools, including Ipsos.Digital (a
Do-It-Yourself solution, enabling clients and Ipsos teams to carry
out surveys at competitive rates. In addition, Ipsos is stepping
ipsos.com/en-us up the development of data analyses and Artificial Intelligence
Founded: 1975 solutions, thus accelerating the process of optimizing, identifying
and using the data contained in the countless databases
Didier Truchot available to the company and its clients. Meanwhile, it continues
Chairman and CEO strengthening its Neuroscience, Behavioral Sciences and Data
Economics, Pantheon-Sorbonne Science offers.
University
Accelerating the use of multiple information channels allows
Pierre LeManh us to realize the promise of Total Understanding creating the
conditions for “research” and “advisory” divisions to work
CEO, North America
together to answer the challenges faced by businesses and client
MBA, Ecole Superiere Sciences
institutions.
Economiques et Commerciales
* ‘% Change’ calculation reflects adjustment of previously reported 2018 U.S.
2019 U.S Revenue: $682.0 million research revenue due to acquisition/divestiture activity or other business
Percent Change from 2018: 16.2% change during 2019.
2019 Non-U.S. Revenue: $1,685.0 million
Percent from Outside U.S.: 71.2%
2019 Worldwide Revenue: $2,367.0 million
U.S. Employees: 2,025
Other Offices: Multiple offices in the U.S. and offices in 89 other
countries
In this unique year, Ipsos has remained strong and reaffirmed its
ambition and sense of purpose to deliver reliable information
for a true understanding of Society, Markets and People. Ipsos
227
conducting evaluations, and providing technical
assistance
Transportation studies of travel behaviors, safety,
WESTAT** and human factors using advanced technologies
such as instrumented vehicles and simulators, field
observational studies, and online and mobile device
westat.com based surveys
Founded: 1963
To support our research projects, Westat designs tailor-made
approaches for clients as well as invests in many general and
Scott Royal specialized IT technologies and products. Westat also provides
President & CEO
licensing, training, and support for Blaise®, a major data
PhD, Johns Hopkins University
collection software system produced by Statistics Netherlands
2019 U.S Revenue: $590 million and used internationally.
Percent Change from 2018: 3.5%
Westat will continue its commitment to quality work as we grow
2019 Non-U.S. Revenue: $7.0 million
our capabilities in each of these areas to meet clients’ needs.
Percent from Outside U.S.: 1.2%
2019 Worldwide Revenue: $597.0 million **Some or all figures are not made available by this company so instead are
based on research and estimation by the Report author
U.S. Employees: 1,900
8
Other Offices: Multiple offices in the U.S. and in Costa Rica, South
Africa, Thailand
Westat is a 100 percent employee-owned research and
professional services company. Westat provides extensive
survey design and operations capabilities in support of modern
THE NPD GROUP
data collection from households, institutions, businesses, and
individuals. We apply multiple modes of data collection and
survey management to achieve maximum response rates. npd.com
Founded: 1966
The company’s focus areas and capabilities include:
Statistical analysis and methodological research in
Tod Johnson
Executive Chairman
survey design, experiments and testing, data science
M.S.I.A., Carnegie Mellon University
and analytics, statistical disclosure control, and
qualitative research
Karyn Schoenbart
Program, process, and outcome evaluation using CEO
diverse methodologies from design to implementation BA, University of Massachusetts
to guide each program to success
2019 U.S Revenue: $339.5 million
Health research, including behavioral and mental Percent Change from 2018: 8.6%
health, clinical studies and clinical trials, public and 2019 Non-U.S. Revenue: $104.5 million
international health, health care delivery, patient Percent from Outside U.S.: 23.5%
safety, and health communications campaigns 2019 Worldwide Revenue: $444.0 million
U.S. Employees: 1,185
Social policy research and technical assistance
for implementing innovative evaluation, quality Other Offices: Multiple offices in the U.S. and offices in 18
improvement, and service delivery systems countries
Education programs for supporting teachers, NPD’s global information and advisory services help the world’s
239
leading brands achieve data-driven growth. NPD combines data,
industry expertise, and prescriptive analytics across more than
20 industries to help our clients measure markets, predict trends,
and improve performance.
COMSCORE* **
NPD syndicated services include retail tracking, distributor
tracking, and consumer tracking. NPD offers weekly data, store-
level enabled data (for looking at geographies or custom store comScore.com
groupings), and account level information (for participating Founded: 1999
retailers). Point-of-sale data is collected from over 600,000 doors
worldwide plus e-commerce and mobile platforms. Consumer Bill Livek
information is collected via online surveys and NPD’s Checkout CEO & Executive Vice Chairman
service, which uses receipt harvesting to track and analyze B.S. Southern Illinois University
purchasing and behavior. Prescriptive analytics include market
forecasting, new product forecasting, pricing and promotion 2019 U.S Revenue: $336.1 million
evaluation, and segmentation. Percent Change from 2018: -6.5%
2019 Non-U.S. Revenue: $52.5 million
With deep expertise in more than 20 industries, NPD provides Percent from Outside U.S.: 13.5%
thought leadership to the C-suites of many of the world’s leading 2019 Worldwide Revenue: $388.6 million
brands. Senior industry advisors are available for strategy U.S. Employees: 870
sessions to guide long range planning or address specific needs,
such as preparing for earnings calls. Topics include industry and Other Offices: Multiple offices in the U.S. and offices in 25
category performance, the state of retail, and winning strategies countries
of best-in-class companies.
comScore is a global information and analytics company that
In 2019, NPD increased the size of its Checkout omnichannel measures advertising, content, and the consumer audiences of
panel to over 100,000 consumers, making it the largest each, across media platforms. comScore creates its products
longitudinal panel collecting receipts for online and in-store using a global data platform that combines information on
purchasing for general merchandise and foodservice. In 2019, digital platforms (smartphones, tablets and computers),
NPD signed an agreement with Nielsen, whereby Nielsen will television (“TV”) and movie screens with demographics and other
license Checkout data covering CPG categories on an exclusive descriptive information.
basis. As a longitudinal panel, Checkout offers clients the
comScore has developed proprietary data science that enables
opportunity to understand consumer behavior, such as online
measurement of person-level and household-level audiences,
and in-store shopping patterns, over time. In 2019, NPD also
removing duplicated viewing across devices and over time. This
launched new tracking services in the Americas (U.S. sports
combination of data and methods enables a common standard
equipment and B2B verticals, Brazil toys), Europe (Germany
for buyers and sellers to transact on advertising. This helps
beauty), and Asia (Japan foodservice and China toys).
companies across the media ecosystem better understand
Looking ahead, NPD will continue the expansion of the Checkout and monetize their audiences and develop marketing plans
panel and services and introduce new industry tracking services and products to more efficiently and effectively reach those
in Asia and other markets. The firm is also introducing faster data audiences. Our ability to unify behavioral and other descriptive
reporting options and additional advisory services for executives data enables us to provide audience ratings, advertising
as industries continue to grapple with the immediate and long- verification, and granular consumer segments that describe
term effects of COVID-19, which is impacting consumer behavior hundreds of millions of consumers.
and purchasing in new and unexpected ways.
comScore offers several solutions to help advertisers maximize
NPD Practice Areas cover apparel, automotive aftermarket, cross-platform marketing effectiveness – be it measuring brand
appliances, beauty, books, consumer electronics, e-commerce, impact, viewability, or ad and audience delivery validation – as
entertainment, fashion accessories, food, foodservice, footwear, well as power cross-platform advertising for better targeting and
home, juvenile products, mobile, office supplies, retail, sports, stronger advertising ROI. comScore Advanced Audience segments
technology, toys, video games, and watches. go beyond age and gender to help advertisers better target
24Leading companies and individuals across Companies listing in Blue Book have
insights and data analytics rely on Blue Book to agreed to abide by the IA Code of
connect with reputable business partners. We Standards and Ethics for Marketing
are committed to providing expert, personal Research and Data Analytics. A level
support to each of our 700+ clients. It’s this of trust and integrity found in no
dedication to serve and give back to the insights other directory.
community that keeps Blue Book the #1 trusted
business directory.
25consumers based on lifestyles, behaviors, demographics and and analytics partner, GfK promises its clients all over the world
interests. comScore pioneered this concept in digital, local and “Growth from Knowledge.”
national TV.
The increasing speed of product innovation, the rise of new
comScore’s customers include digital publishers, television channels, and emerging customer needs are all part of business
networks, movie studios, content owners, advertisers, agencies today. Our clients are businesses around the globe. To make
and technology providers. The platforms we measure include the best possible business decisions every day, they need
televisions, smartphones, computers, tablets, over-the-top more than purely descriptive data; they require actionable
(“OTT”) devices and movie theaters. The information we analyze recommendations based on advanced analytics and powered
crosses geographies, types of content and activities, including by leading-edge technology. We are in the unique position to
websites, mobile applications (“apps”), video games, television leverage proprietary and third-party data to create indispensable
and movie programming, electronic commerce (“e-commerce”) predictive market and consumer insights and recommendations.
and advertising.
Our industry focus provides GfK market researchers with a
* ‘% Change’ calculation reflects adjustment of previously reported 2018 U.S. thorough understanding of business issues and questions specific
research revenue due to acquisition/divestiture activity or other business
to their concerns. Industries we cover include Automotive,
change during 2019.
Consumer Goods, Fashion & Lifestyle, Media & Entertainment,
**Some or all figures are not made available by this company so instead are Retail, Technology, and Travel and Hospitality.
based on research and estimation by the Report author
An important event for GfK in North America has been the joint
10
venture between MRI and Simmons Research. MRI-Simmons is
the leading provider of insights on the American consumer. With
thousands of attitudinal and behavioral data points, gathered
through ongoing surveys and passive measurement, MRI-
GFK** Simmons empowers advertisers, agencies and media companies
with deeper insights into the “why” behind consumer behavior.
**Some or all figures are not made available by this company so instead are
gfk.com based on research and estimation by the Report author
Founded: 1934
Peter Feld
CEO
11
MSc, RWTH Aachen University
FORRESTER RESEARCH
Gregg Lindner
President of Americas SERVICES**
MS, University of Maryland
2019 U.S Revenue: $320.0 million
forrester.com
Percent Change from 2018: 3.2%
Founded: 1983
2019 Non-U.S. Revenue: $1,280.0 million
Percent from Outside U.S.: 80.0% George F. Colony
2019 Worldwide Revenue: $1,600.0 million Chairman and CEO
U.S. Employees: 860 A.B., Harvard University
Other Offices: Multiple offices in the U.S. and offices in 100 2019 U.S Revenue: $233.7 million
countries Percent Change from 2018: 32.9%
2019 Non-U.S. Revenue: $65.0 million
GfK connects data and science. Innovative research solutions
Percent from Outside U.S.: 21.8%
provide answers for key business questions around consumers,
2019 Worldwide Revenue: $298.7 million
markets, brands and media – now and in the future. As a research
26You can also read