Report by the Executive Board Chairman and CEO
Joachim Kreuzburg
←
→
Page content transcription
If your browser does not render page correctly, please read the page content below
Report by the Executive Board Chairman and CEO Joachim Kreuzburg
Note
     This presentation contains statements concerning the future performance of the Sartorius
        Group. These statements are based on assumptions and estimates. Although we are
      convinced that these forward-looking statements are realistic, we cannot guarantee that
    they will actually materialize. This is because our assumptions harbor risks and uncertainties
           that could lead to actual results diverging substantially from the expected ones.

                    It is not planned to update our forward-looking statements.

2
2020 was both an intense and highly successful year
Sartorius makes a valuable contribution towards
overcoming the coronavirus pandemic
Very significant profitable growth achieved across nearly
the entire portfolio and in all geographies
Complementary strengthening of the portfolios of both
divisions by completion of three acquisitions
Very strong outlook for 2021; mid-range targets for 2025
raised; extensive investment program
3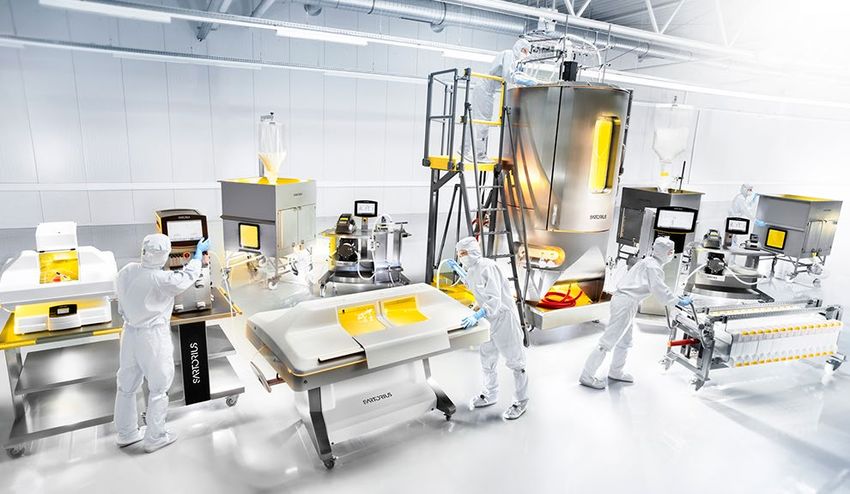
Sartorius is part of the solution

                          Companies and research institutions across
                           the globe are working on developing and
                           manufacturing coronavirus vaccines and
                                 medications to treat Covid-19

                               Every day many of them receive
                              deliveries of essential products and
                                  technologies from Sartorius

4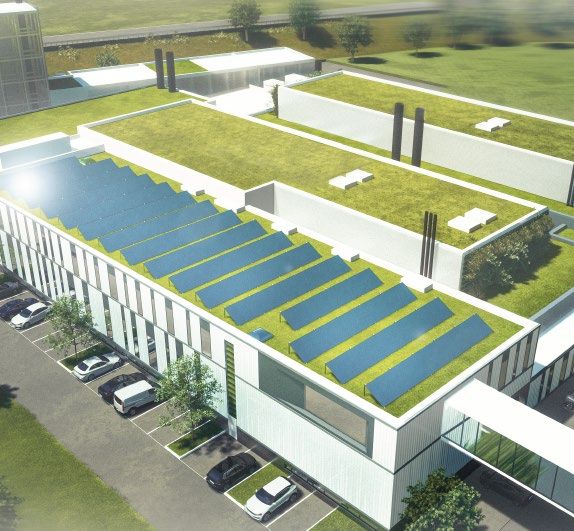
Workflows adapted to changed basic conditions
Safe working environment Changed collaboration Production largely running 24/7
Protection and testing policies at all sites Less personal, more digital interaction Working from home not always an option
R&D
Virtual meetings +160% >1,000
Seamless adaptation and change
Admin Operations
~1,500 ~5,000
-70% Business travel ~11,000
employees
Long term ~1/3 fewer business trips expected
New hires onboarded >2,500
Very limited number of infections
No severe cases Virtual formats reaching certain limits Marketing & Sales
>3,000
No transmission at work
5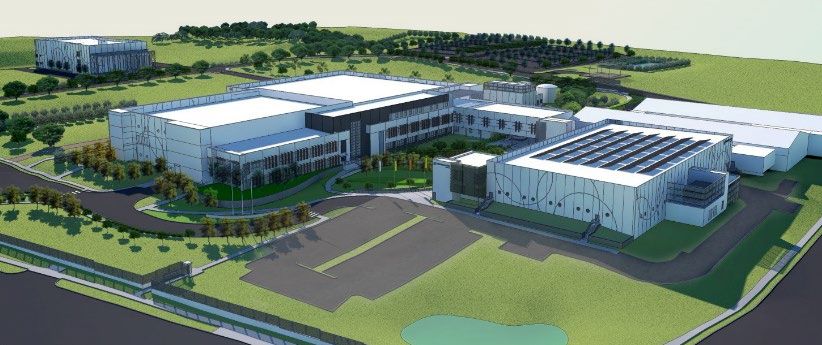
Pandemic as a catalyst: Customer requirements will change
Some products highly complex Customers’ expectations changed Implementing new approaches
Consulting and support essential Requirements on sales and services Digital interaction and training
Seamless combination of direct and
digital sales
Digital procurement processes
widely established
Even larger investments are
processed digitally
No return to pre-Covid-19
interaction model expected
6
Mid-range targets for 2020 exceeded
                                                                                                                                                              +30.2%

2400    Sales CAGR                               ~15%                                                                                                           ~€2.34bn   39

                                                                                                                                                  +14.8%
        EBITDA1 margin                           ~+10pp
2200                                                                                                                                                                       37

2000                                                                                                                                  +13.2%                               35

1800
                                                                                                                    +9.3%                                                  33
                                                                                                +18.2%
1600
                                                                            +16.0%                                                                                         31

1400                                                     +12.6%                                                                                                            29

                                     +8.8%                                          ~€1.12bn                                                                      29.6
                   +13.6%
1200                                                                                                                                                                       27

1000                                                                                                                                                   27.1                25

                                                                                                                               25.1        25.9
800     ~€650mn                                                                                           25.0                                                             23

600
                                                                                       23.6                                                                                21

                                                20.5                21.0
            19.7             20.1
400                                                                                                                                                                        19

200                                                                                                                                                                        17

    0                                                                                                                                                                      15

            2011             2012               2013                2014               2015               2016                 2017        2018        2019       2020
         Sales revenue             EBITDA1 margin in %           Intec Division divested in 2|2015
Sales growth and CAGR from 2011 to 2020 for continued operations, in constant currencies; 1 adjusted for extraordinary items

7
Exceptionally dynamic growth above expectations

Order intake1                                        Sales revenue1                                        EBITDA & margin2                                      Earnings per share3
in millions of €                                     in millions of €                                      in millions of €                                      in €

               +49.0%                                                +30.2%                                               +39.6%                                    +43.0%                   +42.9%
                        2,836.3
                                                                             2,335.7                                                                                        4.37                    4.38
       1,939.5                                               1,827.0
                                                                                                                                                                  3.06                    3.07
                                                                                                                                    692.2
                                                                                                                   495.8
                                                                                                                                                                 Ordinary shares        Preference shares
                                                                                                                                    29.6%
                                                                                                                   27.1%

          2019            2020                                 2019            2020                                 2019             2020                          2019 2020              2019 2020

1 Growth rates for order intake and sales revenue in constant currencies; 2 Underlying EBITDA = adjusted for extraordinary items; 3 After non-controlling interest, adjusted for extraordinary items and
non-cash amortization, as well as based on a normalized financial result and a normalized tax rate

8
Double-digit growth in all geographies

Americas                                             EMEA                         Asia | Pacific             Sales by region
in millions of €                                     in millions of €             in millions of €           in %

                                                                                                                               Americas
                  +32.8%                                            +28.4%                    +29.6%                            ~35%

                                                                          935.1
                         812.2
                                                                  733.4                                               ~€2.34
              629.9                                                                                  588.4
                                                                                           463.7                      billion

                                                                                                              EMEA
                                                                                                              ~40%       Asia | Pacific
               2019       2020                                    2019    2020             2019      2020                   ~25%

According to customers‘ location; growth in constant currencies

9
BPS: Strong demand in all product categories and across all geographies
Order intake Sales revenue Underlying EBITDA and margin
in millions of € in millions of € in millions of €
+56.4% cc + 34.4% cc +46.5%
2,238.1
1,782.6 575.9
1,457.6 1,350.5 393.1
29.1% 32.3%
2019 1 2020 2019 1 2020 2019 1 2020
High growth in “core business”
Sales increase: Pandemic-driven effects approx. 12pp; acquisitions accounted for close to 5pp of growth
Underlying EBITDA margin: increase due to economies of scale and lower costs in some areas due to the pandemic
1 Figures reported for 2019: Order intake €1,479.3 million; sales revenue €1,372.1 million; underlying EBITDA €406.8 million
10LPS: Catch-up effects after challenging first half
Order intake Sales revenue Underlying EBITDA and margin
in millions of € in millions of € in millions of €
+26.4% cc +18.1% cc +13.2%
598.2 553.0
481.9 476.5 116.3
102.7
21.6% 21.0%
2019 1 2020 2019 1 2020 20191 2020
High demand for products used for coronavirus testing (membrane, pipette tips)
Acquisitions contribute around 15pp to sales growth; net effect from pandemic approx. -1pp
Underlying EBITDA margin edged down slightly as a result of lower capacity utilization in H1 due to the pandemic
1 Figures reported for 2019: Order intake €460.3 million; sales revenue €454.9 million; underlying EBITDA €89.0 million
11The most recent acquisitions strengthen both divisions
Bioanalytics Downstream processing Tools for gene and cell therapies
Innovative instruments for label-free real-time Significant expansion of portfolio of Market-leading products for analysis and
analysis of biomolecules; integrated into the chromatography solutions for purification of large biomolecules, such as
Lab Products & Services Division purification of biopharmaceuticals viruses, plasmids and mRNA
Selected businesses from Selected businesses from WaterSep BIA Separations
Danaher Life Science Danaher Life Science BioSeparations (Nov. 2020)
(Apr. 2020) (Apr. 2020) (Dec. 2020)
12Financial indicators remain at a very solid level
Key financial indicators Net debt and
Net debt to underlying EBITDA1
Dec. 31, Dec. 31, 2,000 4.0
4.0
Sartorius Group
2019 2020
1,500
1,500 3.0
3.0
Equity ratio 38.1 29.9
in % 1,000 2.0
2.0
Net debt 1,014 1,884
500 1.0
1.0
in millions of €
0 0.0
0
Net debt | Q1-Q4 Q1-Q4 Q1-Q4 Q1-Q4 Q1-Q4 Q1-Q4 Q1-Q4
2.0 2.6 2014 2015 2016 2017 2018 2019 2020
Underlying EBITDA1
Net debt in millions of € (lhs)
Net debt | Underlying EBITDA (rhs)
1 Includes underlying pro forma EBITDA of the acquisitions completed in 2020
13Dividends to rise significantly again
Dividends in €
0.70 0.71 0.70 0.71 Total profit distributed would be €48.2 million;
0.61 0.62 payout ratio2 at 16.1%
0.50 0.51 Reminder: Dividends for 2019 adjusted due to the
0.45 0.46
pandemic
0.35 0.36
2016 2017 2018 2019 2020 1
Ordinary shares Preference shares
1 Proposal submitted to the Annual Shareholders’ Meeting; 2 Related to the relevant net profit of the Sartorius Group
14Sartorius shares outperformed the market yet again
Price development 2020
400%
SAG pref. +80.1%
350% SAG ord. +97.1%
300% MDAX +8.8%
MSCI Europe -4.3% SAG pref.
250%
SAG ord.
200% DAX
MDAX
150%
TecDAX
100% MSCI Europe
50%
0%
Jan-20 Feb-20 Mar-20 Apr-20 May-20 Jun-20 Jul-20 Aug-20 Sep-20 Oct-20 Nov-20 Dec-20 Jan-21 Feb-21 Mar-21
As of March 25, 2021; share prices of the major stock exchanges; source: Nasdaq
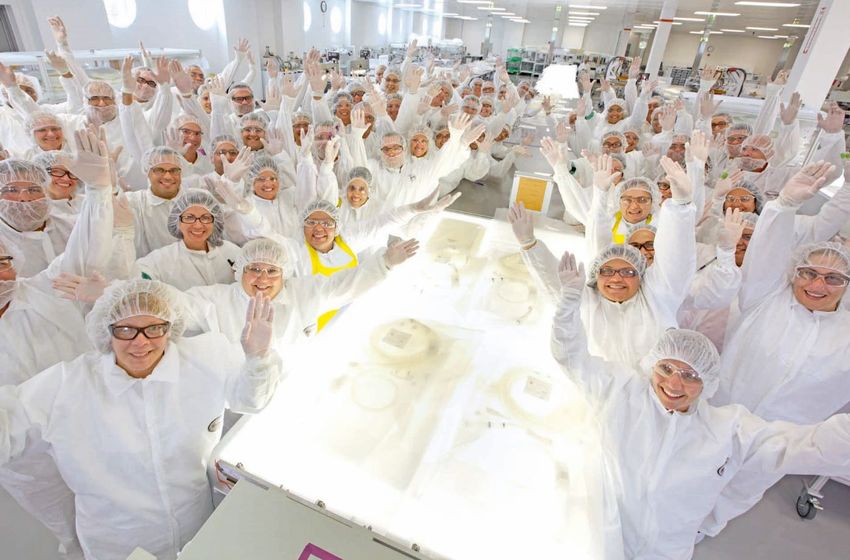
15Number of employees increases to over 10,600
Creation of jobs Key topic: people integration Dynamic spectrum of tenure
Total number of employees Over 2,500 new employees Length of employment
~900 additional jobs 31%
created on avg. per year Between 5 and
15 years
10,637 52%
9,036 Less than
7,501 8,125
6,911 5 years
17%
482 2,033
More than 15 years
2016 2017 2018 2019 2020 From M&A New hires
3.126
2.124 1.539
Reporting date: Dec. 31, 2020
16Becoming more international and younger; hiring more women
International workforce Many younger than 40 Proportion of women to further rise
Employees by nationality Workforce by age group Relatively high proportion of women at the
senior management level
~3,500 1,936
≤29 Percentages of the entire workforce
Top 5 864
~1,600 3,636 39% 61%
30-39
96 ~1,000 666
nations ~800
2,545 At the first level below the Executive Board
~650 40-49
300
~600 38% 62%
Other | ~2,500 2,520
≥50
203
71% Non-German Ø 40
managers Total New hires Women Men
Reporting date: Dec. 31, 2020; partially rounded figures
17Sustainability is an integral part of our corporate purpose
Our mission
We empower scientists and engineers to simplify
Good health and well-being at and accelerate progress in life science and
the focus of Sartorius‘ bioprocessing, enabling the development of new
business activities and better therapies and more affordable medicine.
18Further sustainability initiatives at Sartorius
Product responsibility Climate protection Supply chain
Our products increase safety and Significant improvement in emissions Already ~30% of the purchase volume2 externally
efficiency in the manufacture of medicines analyzed
Development of climate-relevant emissions1 Suppliers Purchase volume
in proportion to annual sales, in t | € in millions
25.1 25.5 24.3 24.2 18.5
40
7,923 81 30% €748m
30
20
7,842
10
Reduce the use of new plastic 0 Evaluation not yet available
Improve recycling options 2016 2017 2018 2019 2020 External assessment by EcoVadis
1 Emissions of production facilities acquired during the year are not included 2 based on figures for the year 2019
19Comprehensive documentation of our sustainability efforts
First-time publication of a separate
sustainability report
Applies the GRI Guidelines (Global Reporting
Initiative)
Will be published annually in addition to our
annual report
Download from:
www.sartorius.com/sustainability
20Guidance for 2021 raised; uncertainties remain higher than usual
Sales growth1 Underlying EBITDA margin1
Sartorius Group ~35% ~32%
- thereof from acquisitions | Corona demand ~5.5pp | ~15pp
Bioprocess Solutions ~40% ~34%
- thereof from acquisitions | Corona demand ~6pp | ~18pp
Lab Products & Services ~20% ~24%
- thereof from acquisitions | Coron demand ~5pp | ~5pp
CAPEX ratio ~14% (FY 2020: 10.3%)
Net debt to underlying EBITDA projected at approx. 2.0 (2020: 2.6)
1 In constant currencies
21Consistent strategic focus on life sciences and biopharma
Bioprocess Solutions Division (BPS)
Cell line and process Upstream &
Molecule development
development downstream production
Quality control & testing
Lab Products & Services Division (LPS)
22Strong macro trends in our target markets
Growing and aging population Expanding biosimilars market USA leading; China growing strongly
9 billion people by 2050 ~30% CAGR, 2019-20251 Biopharma market by region
World population in 2050 ~€250bn ~€365bn
~ 9bn |
> 2bn 2025
167
Over 60 > €50bn
years old ~30% 119
CAGR
67
2020
€14.5bn 38
World population in 2020 2020 2024
7.8bn | 1bn Over 60 years old USA Europe China Other
1 IQVIA
23Accelerated innovation dynamics in the sector
Established biopharmaceuticals Next generation
Proteins, peptides Virus-based therapies, advanced therapies
mAbs Plasma Vaccines Vectors Vaccines mRNA, Gene and cell CRISPR/Cas9
pDNA therapies CAR-T
Industrial products for Individually manufactured products as
many patients personalized medicines for each distinct patient
Cost, efficiency, Product yields, Robust manufacturing methods, closed
acceleration, automation scalability systems, production close to patients
24Increasing digitalization across the value chain
Bioanalytics Bioprocess data Artificial intelligence
Molecule development Production of active Interdisciplinary topic
pharmaceutical ingredients
Digital real-time analysis of complex data Data management and analysis, process Data analytics and artificial intelligence (AI)
in drug discovery optimization and automation for life science applications
Biolayer interferometry technology Leading software for process data Learning systems for life science
for label-free analysis applications
Improved process control and
High-throughput analytical platform robustness Sartorius a shareholder of the DFKI
for suspension cell screening since 2020
Deeper process understanding of
Incubators for real-time imaging and complex data sets Extension of joint Sartorius AI Lab
cell analysis (SAIL)
25Extensive program for expansion of production capacities
Finland
Investments moved ahead of Kajaani China
schedule and accelerated USA
Beijing
50
CAPEX in millions of €; ratio in % 450 Marlborough
45
400
40
350
South Korea
240 Songdo
35
238 226
300
30
209 250 Germany
Göttingen
25
14.9 15.2 12.3 ~14 200
10.3 Guxhagen
20
Puerto Rico
150
15
Yauco
100
10
50
5
0 0
2017 2018 2019 2020 2021 e
Production stable during the pandemic Separation Fluid Instruments Cell Culture Customer
Management & Systems Media Interaction
Supply chains partially under stress
High additional demand, especially from
vaccine manufacturers
26High investments in Europe; focus on Germany
Germany | Göttingen Germany | Guxhagen
Membrane manufacturing capacities Capacities for bioprocessing equipment;
New building for casting machines available by end of 2021
First machines available by end of 2022 Customer Interaction Center, planned for
2022/23
Research & Development
Finland | Kajaani
Additional laboratories
Germany | Göttingen, Guxhagen New manufacturing cells for pipette tips
Completion scheduled for Q3 2022
Finland | Kajaani Building extension by more than 1,000m2
Production capacities increasing
Separation Instruments Lab Products
& Systems
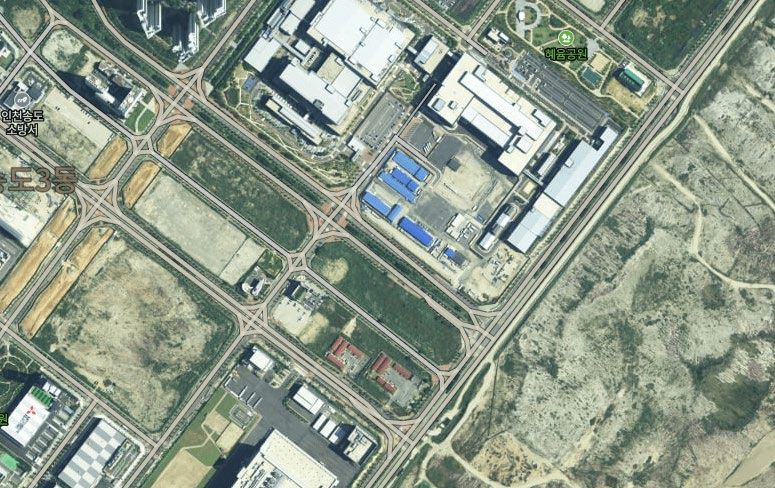
27Significant expansion of key sites in Asia
China | Beijing South Korea | Songdo
Additional manufacturing facilities New site
~3,000m2 cleanroom for single-use 25,000m2 for cell culture media, assembly,
products labs and application center
Completion scheduled for H2 2021 Close to Samsung Biologics
Customer Interaction Center Construction to begin in 2021
China and South Korea
~700m2 space, planned for Q1 2021 Operations to start in 2023
Capacities will be created
in selected areas
Samsung Biologics
Separation Fluid Cell Culture
Planned site
Management Media
28Ramp-up and extension of manufacturing in North America
Puerto Rico | Yauco USA | Marlborough, Massachusetts
Set up cell culture media manufacturing New Customer Interaction Center
Production scheduled to start in 2022 New site ~4,000m2
Completed by end of 2020
Additional cleanrooms
Fluid Management and Separation
Puerto Rico and USA Technology
Capacities will be ramped up
in selected areas
Cell Culture Fluid Customer
Media Management Interaction
29Mid-range targets up to 2025 significantly raised
Growth strategy BPS LPS Sartorius Group
Continued strong organic growth
targeted; additional acquisitions with Sales ~€3.8bn ~€1.2bn €5bn
complementary portfolios revenue
Above-average growth in the EBITDA
Americas and Asia
margin ~34% ~25% ~32%
Create >1,000 new jobs on
average per year
2025-Ziele auf Basis von Wechselkursen von 2020; EBITDA bereinigt um Sondereffekte
30Thank you for joining us
You can also read