Refillables. Just one word: How the soft drink industry can - right now - reduce marine plastic pollution by billions of bottles each year ...
←
→
Page content transcription
If your browser does not render page correctly, please read the page content below
Just one word:
refillables.
How the soft drink industry
can – right now – reduce
marine plastic pollution by
billions of bottles each year

January 2020
iiii                                                                                 Oceana    White
                                                                                      Just one word:    Paper
                                                                                                     refillables.

Contents
 Page:
       1   Executive Summary

       2   PET bottle ocean plastic pollution

       3   Recycling issues

       4   The refillables system

       6   If we increase our use of refillables, how much
           less waste would go into the ocean?

       8   Climate and environmental benefits
           of refillable bottles

10         How legislation and plastic taxes increase costs
           for single-use bottles and promote refillables

  11       Conclusion

                                                                      Just one word: refillables.
                                          Authors: Anne Schroeer, Matt Littlejohn, and Henning Wilts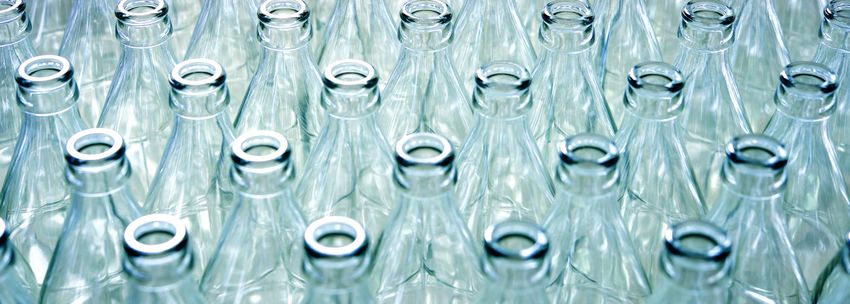
11                                                                                                  Oceana    White
                                                                                                     Just one word:    Paper
                                                                                                                    refillables.

Executive Summary
Oceana analyzed packaging market data for the non-            example, in Chile (35.7%), Germany (33.9%), and the
alcoholic beverages industry, the market share of PET         Philippines (46.5%). And, according to a recent report
bottles, and plastic marine pollution data in 76 coastal      by HSBC global beverage analysts, beverage companies
countries around the world to estimate the total              are beginning to grow their refillables businesses in
amount of PET plastic bottle marine pollution and the         important markets because of their appeal to more
potential of increasing the market share of refillable        price-driven customers (primarily in Latin America).
bottles to reduce marine pollution from PET bottles.          These analysts also report that beverage companies and
                                                              their owners are increasingly concerned about plastic
Our analysis found that, based on marine pollution            pollution.
rates from a recent scientific study published in Science
and on 2018 beverage and packaging sales information          Refillable bottles are multiple-use bottles, made of glass
from the market analytics firm GlobalData, between 21         or PET plastic, that beverage companies own and that
and 34 billion PET bottles, out of 445 billion liters of      are returned by customers, who are incentivized to
beverages sold in PET bottles, become marine pollution        return them through deposit return schemes, and then
every year. We also found that increasing the market          cleaned, re-labeled, refilled, and sold again. Beverage
share of refillable bottles by 10% in all coastal countries   companies report that they use refillable glass bottles
in place of single-use throwaway PET bottles could            up to 50 times and refillable PET bottles up to 20 times
reduce PET bottle marine plastic pollution by 22%.            before they are retired and recycled.
This would keep 4.5 billion to 7.6 billion PET bottles
per year out of the ocean. A 20% increase in refillable       Because of their high rate of reusability, both refillable
market share of glass and PET bottles in place of             PET and refillable glass bottles also have lower carbon
single-use throwaway PET bottles could reduce marine          emissions per liter, according to data from the German
plastic pollution by 39%, keeping 8.1 to 13.5 billion         Institute for Energy and Environmental Research (IFEU)
PET bottles out of the ocean every year, based on 2018        and a lifecycle analysis in Chile conducted for Oceana
data.                                                         by the engineering and consulting firm Dictuc SA.

Refillable bottle systems were formerly the primary           The non-alcoholic ready to drink market, worldwide,
delivery system for beverage companies around the             is driven by a relatively small number of companies.
world. Beverage companies have significantly reduced          According to Global Data, in 2018, just four companies
the market share of these systems and replaced them           accounted for over 40% of total sales (in terms of
with single-use plastic bottle systems. India’s refillable    revenue). Beverage companies have the ability to
beverages share, for example, went from 86% in 1999,          increase the sale of refillable bottles and to decrease
to just over 37% in 2018.                                     marine plastic pollution. Oceana is calling on companies
                                                              to commit to reducing single-use plastic production and
Despite this decline, refillable systems continue to have     use and to increase the share of refillable bottles.
high market shares around the world, including, for
22 Oceana White
Just one word: Paper
refillables.
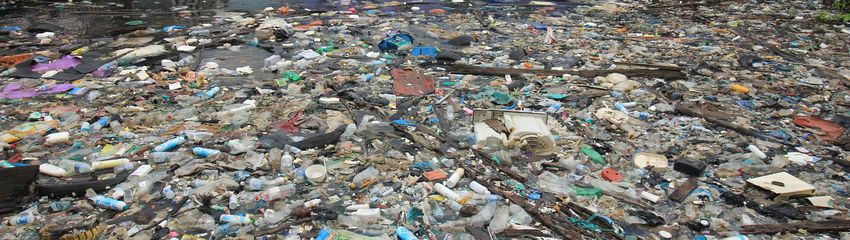
PET bottle ocean plastic pollution
Plastic bottles produced and sold by beverage of the range being roughly equivalent to dumping
companies are a major source of marine pollution. a garbage truck full of plastic into the oceans every
Based on data from the International Coastal Clean- minute.
up 1 analyzed by Oceana, plastic bottles were #1
out of the Top 10 most commonly found plastic According to the Jambeck study, the amount of
items in beach clean-ups in 2017, when measured mismanaged plastic waste generated by the coastal
by weight. The analysis of surveys organized by the population of a single country ranges from 1.1 metric
#breakfreefromplastic movement in 51 countries found tons to 8.8 million metric tons per year. Oceana
that soft drink companies are #1 and #3 in the Top 10 analyzed country-level data from the study along with
list of global polluter brands and PET bottles are the #3 2018 non-alcoholic beverage ready to drink (NARTD)
item found most often.2 Additionally, PET plastic bottles sales information from GlobalData for 76 coastal
– which sink when uncapped – have been found in the countries to determine PET bottle pollution by country.
water column and on the seafloor. As much as 94% PET bottles sold worldwide contain mostly water and
of ocean plastic has been estimated to be below the carbonated soft drinks; these two beverages account
surface of the ocean. 3 for 69% of global PET bottle volume sales. 5
A team of scientists led by Jenna Jambeck, a professor Our analysis found that in 2018, the equivalent of 21
at the University of Georgia, estimated the amounts to 34 billion one-liter PET bottles generated by the
of plastic waste going into the ocean from the land, non-alcoholic beverages industry reached the ocean,
country by country, in a study published in Science in representing 706,000 to 1.1 million metric tons of
2015. The study estimated that 4.8 to 12.7 million plastic bottle waste.
metric tons (10.5 to 27.9 billion pounds) of plastic enter
the marine environment every year 4, with the midpoint
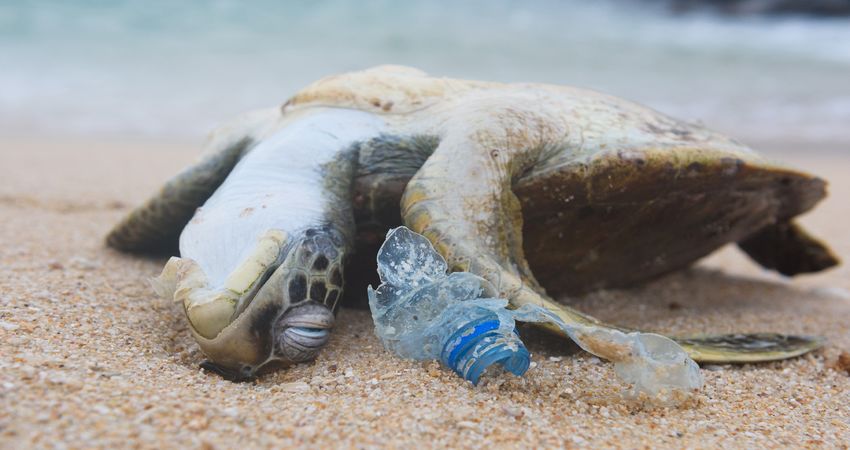
© Shutterstock | Nevodka
More than 50% of sea turtles are estimated to have ingested plastic debris, which can prove fatal.33 Oceana White
Just one word: Paper
refillables.
What plastic waste does to marine life
Plastic debris has been found floating on the surface of the sea, washing up on the world’s most
remote coastlines, melting out of Arctic sea ice, and sitting at the deepest point of the ocean floor. It is
everywhere. As plastics continue to flood into our oceans, the list of marine species affected by plastic
debris expands. 6
Tens of thousands of whales, sea birds, fish, and turtles have been observed suffering from entanglement
or ingestion of plastic permeating the marine environment. It is impacting everything from zooplankton
and fish, to sea turtles, marine mammals, seabirds, and whales.
The list of marine animals affected by plastic pollution is continually growing. Plastic has been consumed
by an estimated 90% of seabird species and eaten by every species of sea turtle. 7
Some organisms, such as corals, appear even more attracted to plastic than to their natural sources
of nutrition.8 And studies have shown that when corals come into direct contact with plastic debris,
their likelihood of contracting a disease increases from 4% to a staggering 89% 9. Seventeen percent of
the species observed to be affected by marine debris are listed as threatened or near-threatened with
extinction by the International Union for the Conservation of Nature. 10
Plastic is also affecting our climate. If plastic were a country, it would be the planet’s fifth-largest emitter
of greenhouse gases. 11 Studies have shown that plastic contributes to climate change by using fossil fuels
and emitting greenhouse gases throughout its life cycle, from production and transportation to waste
management. 12
Plastic never goes away. Instead, it breaks up into smaller and smaller pieces, ultimately becoming
microplastics that act as magnets for harmful chemical pollutants. When eaten by fish and shellfish, some
of the contaminants from microplastics work their way into our food supply. Everything from salt to
honey to beer has been found to contain microplastics. Scientists are still studying how humans might be
affected by the plastics that are making their way into our food, water, and air.
Recycling issues
Beverage companies have made pledges to increase increased recycled content still reach and pollute the
recycled content in their bottles and to buy more oceans without systems in place that effectively recover
recycled PET. 13 Unfortunately, just 9% of all of the these bottles.
plastic waste ever generated has been recycled.14
In the United States, plastic recycling rates declined Fortunately, the leading global beverage companies
from 2016 to 2017, according to the most recent already have a system in place around the world
data available from the United States Environmental that can, if scaled, effectively reduce marine plastic
Protection Agency.15 Additionally, PET bottles with bottle pollution.44 Oceana White
Just one word: Paper
refillables.
The refillables system
How refillables work Refillable bottles
Refillable bottles were introduced by Coca-Cola in the According to a PricewaterhouseCoopers (PwC) study
1940s. While many consumers remember the iconic about refillable delivery systems, circulation rates for
glass refillable bottles, both glass and PET plastic reusable glass bottles are higher (up to 50 refills) than
refillable bottles are now widely used in, for example, those of reusable PET bottles. The circulation rate
India, Germany, Chile, the Philippines, and Mexico. depends on breakage resistance, the stability of the
According to market data covering the global non- packaging, and how fast the material wears out. When
alcoholic beverages industry, refillable systems are refillable glass bottles are removed from the system,
currently in place in 94 countries. These countries they are melted down and then used to produce new
account for 80% of the worldwide sales of NARTD glass bottles.20 Refillable PET bottles, now widely used
beverages. 16 in markets around the world, can be cleaned and re-
filled up to 20 times. Refillable PET bottles are heavier
Consumers buy beverages in refillable bottles and, than single-use throwaway PET bottles. For example, a
after drinking them, return the bottles to the shop one-liter refillable PET bottle we weighed was 74 grams,
where they bought them. They can buy drinks in 2.2 times heavier than a one-liter single-use throwaway
refillable bottles at beverage-only retailers or in regular bottle from the same brand. Refillable PET bottles that
supermarkets with or without a specific department are deemed no longer usable are recycled and, largely,
for refillable drinks or at smaller food stores, and they not converted into new refillable PET bottles.
can return the bottles there. Refillable systems are also
common in hotels and restaurants. Refillable systems
work in combination with deposit return schemes in
which consumers pay a deposit per bottle for the first
bottle or bottles they buy, and the deposit is paid back
when the empty bottles are returned.
Once the bottles are returned, the retailers store the
bottles until they are picked up by the local bottlers
or outside transport firms working with them. These
bottles are delivered back to the plant where they are
sorted, washed, and put back into the manufacturing
process. Recently, these recovery systems have become
more efficient, with companies employing retreatment
systems to recycle the water used for washing and
using solar energy to heat it. 17
Refillable systems have empty bottle return rates of
nearly 100%. 18 The loss rate of these bottles (i.e.,
bottles thrown away, broken, or not returned) is less
than 5% overall. The refillable bottles are closely
© Shutterstock | Ulf Wittrock
managed in these systems because they have economic
value for the companies that own them, according to Refillable PET bottles are heavier than single-use throwaway
industry sources. 19 PET bottles and can be cleaned and re-filled up to 20 times.
© Shutterstock55 Oceana White
Just one word: Paper
refillables.
The business of refillables
The global non-alcoholic ready to drink (NARTD) beverage market is driven by a relatively small number
of companies. According to GlobalData, in the countries surveyed in 2018, just four companies accounted
for over 40% of total sales (in terms of revenue). 21
Carlos Laboy, Global Beverage Head, LatAm Food Analyst at HSBC, has noted in sector reports that,
after years of decline, some bottling companies (particularly in Latin America) are growing their refillables
businesses. HSBC cites the example of Brazil for evidence of this comeback, where market share has
rebounded from the low single digits to over 20%. HSBC also notes that the companies they term “the
market developers” – those with the highest margins – are increasingly committed to refillables. 22
Bill Taylor, a beverage industry consultant and former CEO of SPAIPA, a billion-dollar cola bottler in Brazil
(acquired by FEMSA in 2013), reported to Oceana in an interview that refillable systems with proper cost-
based accounting systems have been financially viable for decades and are becoming more profitable.
This is the result, he notes, of innovations such as managed micro-distribution of returnable packages,
which utilize mini-warehouses and small electric vehicle delivery systems such as those used in Curitiba,
Brazil for the past 25 years. 23
Companies such as Andina, a large bottler based in South America, are successfully growing refillables
sales by targeting price-sensitive customers since the bottles can be sold once and offer a longer-term
discount to soft drink consumers. Andina has also recently launched a highly efficient refillable LEED-
certified bottling plant in Brazil and is now promoting the sustainable benefits of refillables. 24
HSBC also reports that the plastic pollution problem could become economically troubling for companies
that are not investing in alternative package solutions as many companies in the industry are already
struggling to exceed their cost of capital in light of rising sugar taxes. The prospect of additional taxes
could profoundly damage the economics of many businesses, including distributors that operate on thin
margins. 25
Current refillable footprint by country Major markets lacking strong refillable footprints
In the data analyzed by Oceana, representing the include the United States, Japan, and the European
largest global non-alcoholic beverage markets, refillable Union. In the U.S. and Japan, only 4% of non-alcoholic
systems today have an overall market share of 23% by beverages are sold in refillable bottles. European Union
volume. countries, where consumers are thought to be more
likely to accept or demand less convenience in favor of
The most robust refillable markets can be found in Latin more sustainable solutions, are at the low end of the
America, where countries like Mexico, Chile, Peru, and refillable spectrum, with some of the lowest market
Brazil have strong refillable footprints — all well over shares for refillables globally. Finland has only 2%
30% market share by volume. Other standouts with market share of refillables; France, Sweden, Ireland, and
high market shares for refillable systems include the the UK have only 3%; Denmark, the Netherlands, and
Philippines, Indonesia, South Korea, India, and China. Greece 4%; Romania and Portugal 5%; and Spain 6%.
Most of the top 10 global non-alcoholic beverage The exception in Europe is Germany, with a refillable
markets, including China, Mexico, Indonesia, India, market share of 35%. 26
Brazil, Germany, and Turkey have refillable market
shares between 26% and 61%.66 Oceana White
Just one word: Paper
refillables.
Refillables lose ground
Before steel cans, aluminum cans, and plastic bottles bottles have not declined in absolute terms over the
were invented, beverages were sold in refillable glass past 20 years, but also have not grown along with the
bottles. In the 1960s and 1970s, when an average rest of the market. As a result, in the last 20 years, the
person bought between 200 and 250 packaged drinks market share of refillable bottles fell from 58% to 31%
every year, the majority came in refillable bottles. 27 in the 20 top countries in terms of volume of beverage
The PET plastic bottle was invented in the 1970s. sales. Worldwide, the refillable market share dropped
from 34% to 20% in the same period. 28
According to data from GlobalData and reports from
the nonprofit Reloop, sales of beverages in refillable
If we increase our use of refillables, how
much less waste would go into the ocean?
Replacing single-use PET bottles with refillable bottles – prevented from reaching the oceans when the volume
either with refillable glass or refillable PET bottles – has market share of refillable bottles in the non-alcoholic
enormous potential to quickly reduce marine pollution drinks sector is increased by 10%, 20%, or 50%,
globally. respectively, in every coastal country around the world
with a large non-alcoholic beverage market where data
Figure 1 below summarizes Oceana’s estimate of was available.29
how much plastic waste from PET bottles could be
Figure 1: Potential decrease of PET marine debris with an increase of refillable market share
Marine Debris
Status Quo Increase refillables by 10%
Million bottles Tons Million bottles Tons
Total 76
coastal Min Max Min Max Min Max Min Max
countries
20.675 34.459 705.506 1.175.844 16.805 26.809 553.620 922.699
Reduction of 4.590 7.650 151.887 253.144
marine debris
compared to 22.20% 21.53%
status quo
Marine Debris
Increase refillables by 20% Increase refillables by 50%
Million bottles Tons Million bottles Tons
Total 76
coastal Min Max Min Max Min Max Min Max
countries
12.563 20.939 438.035 730.088 2.810 4.684 118.976 198.294
Reduction of 8.112 13.520 267.453 445.756 17.865 29.775 586.530 977.550
marine debris
compared to 39.23% 37.91% 86.41% 83.14%
status quo
Source: Oceana calculation77 Oceana White
Just one word: Paper
refillables.
With a 10% 30 increase in the market share of refillable to 19%. The positive impact would be a 29% decrease
bottles in all countries we analyzed replacing single- in ocean pollution in Chile and a 24% decrease in the
use PET bottles, the number of plastic bottles ending Philippines.31
up in the oceans globally would be reduced by 22.2%,
or 4.6 to 7.6 billion PET bottles a year. This would In the United States, the second-largest global market
mean that, for example, in Chile, the market share of for non-alcoholic beverages, the equivalent of an
refillable glass bottles would grow from 11% to 16% estimated 300 million one-liter PET bottles per year
and that of refillable PET bottles would grow from ends up in the ocean. An increase of 10% in the share of
25% to 30%. In the Philippines, the market share of refillables in the U.S. market would reduce PET marine
refillable glass bottles would grow from 33% to 38% pollution by 34%, or 74 to 108 million bottles a year.
and that of refillable PET bottles would grow from 14%
Figure 2: Top 20 - Current estimated PET bottles marine debris
Total PET waste Total PET waste Total PET waste Total PET waste
Total NARTD
marine debris marine debris marine debris marine debris
Country volume
(million bottles) (tons) (million bottles) (tons)
(million liters)
15% low 15% low 25% medium 25% medium
China 148.180 9.894 336.400 16.490 560.666
India 33.559 1.805 63.163 3.009 105.272
Indonesia 44.383 1.068 36.320 1.780 60.533
Thailand 14.508 871 29.603 1.451 49.338
Pakistan 11.336 752 25.642 1.254 42.737
European Union 120.390 606 20.641 1.010 34.401
South Africa 9.335 605 20.587 1.008 34.312
Mexico 55.689 449 15.362 748 25.604
Nigeria 10.433 436 14.811 726 24.685
Philippines 9.306 395 13.734 658 22.889
Algeria 5.225 382 13.003 637 21.671
Vietnam 5.842 376 12.778 626 21.296
Egypt 4.938 308 10.501 514 17.502
Russia 13.773 262 8.902 436 14.837
Brazil 31.505 243 8.282 405 13.804
USA 127.024 215 7.324 359 12.207
Turkey 16.368 215 7.314 359 12.191
Iran 3.991 209 7.109 348 11.849
Tunisia 2.406 187 6.370 312 10.616
Ukraine 2.720 159 5.413 265 9.022
Total Top 20 670.912 19.438 663.259 32.397 1.105.432
Other 119.760 1.237 42.247 2.062 70.412
Total 76 coastal
790.673 20.675 705.506 34.459 1.175.844
countries
Source: GlobalData, Jambeck et. al, Oceana calculation88 Oceana White
Just one word: Paper
refillables.
Refillable systems at risk – the Philippines
In the Philippines – a country where over 80% of plastic waste is mismanaged and 21% of plastic waste
reaches the oceans – it is critical to replace single-use PET bottles with refillables. The waters of the
Philippines have the highest level of nearshore diversity in the world. There are more species of coral in
20 hectares of the Central Visayas of the Philippines than in the entire Caribbean. These marine waters
also support highly productive fisheries, providing livelihoods and food for millions of people. 32
While the country is already struggling with plastic pollution, the situation could soon get worse.
Currently, 47% of the soft drinks sold in the Philippines are sold in glass, PET, and other refillable bottles,
but unfortunately, the market share of refillables is shrinking, and refillable glass and PET bottles are being
replaced by single-use PET bottles. Despite a decrease in the overall volume of the Filipino market from
2017 to 2018, the share of PET bottles grew, and the share of refillable bottles fell. 33 This decrease in
the market share of refillables in a single year means that more than 16 million more PET bottles likely
reached the oceans than would have been the case if the refillables share had held steady.
Climate and environmental benefits
of refillable bottles
Because glass bottles are heavier than plastic bottles CO2e/1000 liter for refillable PET, 85kg CO2 e/1000
and require more energy to produce, transport, and liter for refillable glass bottles, and 139kg CO2e/1000
recycle, a common misconception is that refillables liter for single-use PET. 34
necessarily present challenges for the climate and
environment. In fact, life cycle analyses in countries as Additionally, a recent life cycle assessment by the
different as Germany and Chile have found that both Chilean Dictut Institute, conducted for Oceana,
glass and PET refillables create less environmental compared carbon footprint, water consumption, and
impact than single-use PET bottles. waste generation for refillable glass bottles, recyclable
single-use PET bottles, and aluminum cans. The
Germany’s Institute for Energy and Environmental assessment found that refillable glass bottles, despite
Research (IFEU) carried out a lifecycle assessment for weighing the most, produced the least environmental
the Association of mineral water producers, examining impact in terms of water consumption and waste
the different delivery systems for bottled mineral water. generation and produced 37% lower greenhouse gas
The analysis concluded that refillables had lower carbon emissions than single-use PET bottles. 35
footprints than single-use plastic bottles, with 68.7kg99 Oceana White
Just one word: Paper
refillables.
The carbon footprint of refillable bottle systems
Dr. Henning Wilts, Director Circular Economy, Wuppertal Institute
Dr. Henning Wilts is the Director Division Circular Economy at the Wuppertal Institute for Climate,
Environment, and Energy. He has a Master’s degree in economics, a Ph.D. in waste infrastructure
planning, and he is a lecturer of resource economics at the Schumpeter School of Economics in
Wuppertal, Germany. He coordinates several research projects on transition processes towards a
circular economy, waste prevention, and sustainable waste management, inter alia for the European
Commission, the European Environment Agency, and the OECD.
Various life cycle analyses have investigated the environmental benefits of refillable beverage containers
vs. single-use containers. 36 Looking at the specific case of refillable PET bottles as compared to single-use
bottles, these analyses found that refillables save up to 40% of raw materials and 50% of greenhouse gas
emissions. 37
The following are key factors affecting environmental impacts of refillables vs. single-use bottles:
Trippage rates measured as the number of trips a bottle makes until a bottle is taken out of
circulation: refillables are obviously better for the environment the more times the bottles are used.
Routes for waste collection as well as proper sorting of materials in order to use them as secondary
materials: low-quality waste management infrastructure is particularly problematic in single-use
systems.
Distribution systems and resulting transport distances: this is a key difference between the two
systems with often significant influences on the assessed environmental impacts; very long transport
distances, e.g. for washing and refilling, should be avoided.
Material transformation and handling processes: the local energy mix, share of recycled material,
and the use of allocation rules for by-products, for example, have a clear impact on environmental
burdens for single-use and refillable bottles.
© Shutterstock | Mark Agnor
Beverage companies report that they use refillable glass bottles up to 50 times before they are retired and recycled. © Shutterstock10
10 Oceana White
Just one word: Paper
refillables.
© Shutterstock
Governments around the world have begun passing legislation that aims to address the plastic pollution crisis.
How legislation and plastic taxes increase
costs for single-use bottles and promote
refillables
Governments have used legislation to increase the example, the current Finnish EU presidency states that
share of refillable bottles and to reduce the plastic a plastic tax has broad support from member states as
waste stream, including some combination of the a means to close the €13 billion gap in the EU’s 2020-
following seven policy approaches: 38 2027 budget. 44 The new UK government is proposing
a tax on the production and import of plastic packaging
• Establish or raise mandatory container deposits, with less than 30% recycled content, including PET
including establishing different deposit levels for bottles. 45 The tax would not apply to refillable bottles.
refillable and single-use bottles 39 Italy announced that the 2020 budget will include
• Implement “eco-taxes,” “eco-levies,” or “green-fees” new taxes on plastic and sugary drinks designed to
on single-use bottles 40 raise €1.3 billion. The plastic tax obliges firms to pay a
• Establish or raise quotas for refillable bottles as a one-euro levy per kilogram of plastic produced.46 The
percentage of beverage volume 41 new German packaging legislation includes a quota
• Establish distribution systems for beverages that of 70% refillables for beverages. 47 As the law does
are separate from conventional retail food stores as not contain specific measures to achieve that quota,
a way of making distribution more compatible with taxes on single-use bottles or similar measures are also
refilling being considered as ways to enforce and to achieve the
• Establish industry-specific policies with an aim quota. 48 In the European Union, the new single-use
to preserve existing market share for refillable plastics directive requires EPR schemes for beverage
containers containers until 2024.
• Ban single-use containers 42
• Require the use of standardized bottles 43 ASEAN countries including Indonesia, Vietnam, and
Malaysia have already imposed plastic or environmental
Container deposits, eco-taxes, and refillable quotas taxes.49 In October 2019, Prime Minister Narendra
are all elements of Extended Producer Responsibility Modi of India announced a proposal to ban small plastic
or EPR schemes, which governments use to build into bottles as part of a broader campaign to rid the country
the product life cycle environmental costs associated of single-use plastics by 2022. That initiative was
with it, e.g. adding costs for litter clean up and waste defeated, but some Indian states have enacted bans
management to production costs. on single-use plastics. 50 In Maharashtra, it is illegal to
sell and manufacture PET bottles holding less than 0.5
A growing number of governments are introducing liters. 51
plastic bans, plastic taxes, and EPR measures. For1111 Oceana White
Just one word: Paper
refillables.
The European Union and plastic pollution
Dr. Henning Wilts, Director Circular Economy, Wuppertal Institute
In 2018, the European Commission launched its “strategy for plastics in a circular economy.” The strategy
describes a vision for the year 2030 in which “plastics and products containing plastics are designed to
allow for greater durability, reuse, and high-quality recycling.” The goal is to have, by 2030, all plastics
packaging in the EU market be either reusable or be recycled in a cost-effective manner.
As the first step, the European Commission’s “Directive on the reduction of the impact of certain
plastic products on the environment” 52 has banned specific single-use plastic products for which
environmentally beneficial alternatives are already available, such as straws and plastic cutlery.
For a range of other products, including plastic bottles, new financing obligations as part of EPR schemes
or information requirements have been established. Article 9 of the Directive obligates EU member states
to achieve a minimum 90% recovery rate for plastic bottles by the year 2029. The recently appointed
Head of the European Commission Ursula von der Leyen has announced that an even more ambitious
Circular Action Plan 2.0, with a focus on single-use plastics, will be one of six strategic priorities in the
coming years. 53
The European Environment Agency has published a progress report on plastic waste prevention in the
EU member states recommending that countries adopt more stringent regulatory requirements including
taxes, levies, or specific penalties on single-use plastic products. 54
It is worth noting that even in Germany, which has a 90%+ rate of recovering plastic packaging waste,
the high level of recycling has a limited impact on reducing plastic production. Studies of recycling in
Germany have shown that the country’s high recovery rate leads to a reduction of 18.2% in the use
of virgin plastic, 55 suggesting that systems with circular business models, like refillables, are a crucial
element of a resource-efficient and climate-friendly circular economy.
Conclusion
Oceana is calling on global beverage companies Given that relatively few companies drive the beverage
to reduce the production and use of single-use market and that industry experts report that leading
throwaway plastic. Oceana’s analysis in this paper beverage companies have grown refillables’ share of
shows the beverage industry can reduce marine total sales in important markets, this change appears to
pollution from plastic bottles substantially by scaling up be achievable in the near term. The industry should also
refillable bottle delivery systems in place of single-use continue efforts to develop reusables, zero waste and
throwaway bottles. A 10% increase in refillable bottles other approaches that can reduce plastic production
would, in the countries surveyed, reduce marine plastic and waste in the longer term.
bottle pollution, currently estimated to comprise 34
billion bottles a year, by 22%.12
12 Oceana White
Just one word: Paper
refillables.
References
1
Ocean Conservancy (2019) Fighting Ocean Plastics in all places, 2019 Beachcleanup Report. Available at: https://oceanconservancy.
org/wp-content/uploads/2019/09/Final-2019-ICC-Report.pdf
² Branded (2019), Vol. II Identifying the World’s Top Corporate Plastic Polluters. Published under responsibility of Greenpeace
Philippines. In September 2019 Break Free From Plastic members in 51 countries united to conduct brand audits of single-use plastic
waste using a standard methodology. See details about the methodology at page 11 of the report. See details about limitations of the
report at page 13
3
EUNOMIA (2016) Plastics in the marine environment. Available at: https://www.eunomia.co.uk/reports-tools/plastics-in-the-
marine-environment/
4
Jambeck JR et al. (2015) Plastic waste inputs from land into the ocean. Science 13 Feb 2015: Vol. 347, Issue 6223, pp. 768-771 DOI:
10.1126/science.1260352. Available at: https://science.sciencemag.org/content/347/6223/768
5
GlobalData, Market Data Global NARTD market
6
Lavers JL and Bond JL (2017) Exceptional and rapid accumulation of anthropogenic debris on one of the world’s most remote and
pristine islands. PNAS 114: 6052-6055. doi: 10.1073/pnas.1619818114; Peeken I, Primpke S, Beyer B, et al. (2018) Arctic sea ice is an
important temporal sink and means of transport for microplastic. Nature Communications 9. doi: 10.1038/s41467018-03825-5; Chiba
S, Saito H, Fletcher R, et al. (2018) Human footprint in the abyss: 30-year records of deep-sea plastic debris. Marine Policy 96: 204-
212. doi: 10.1016/j.marpol.2018.03.022
7
Wilcox C, van Sebille E and Hardesty BD (2015) Threat of plastic pollution to seabirds is global, pervasive and increasing. PNAS 112:
11899-11904. doi: 10.1073/pnas.1502108112; Kuhn S, Bravo Rebolledo EL and van Franeker JA (2015) Deleterious Effects of Litter on
Marine Life. In: Marine Anthropogenic Litter. Cham: Spinger International Publishing.
8
Rotjan RD, Sharp KH, Gauthier AE, et al. (2019) Patterns, dynamics and consequences of microplastic ingestion by the temperate
coral, Astrangia poculata. The Royal Society. doi: 10.1098/rspb.2019.0726
9
Lamb JB, Willis BL, Fiorenza EA, et al. (2018). Plastic waste associated with disease on coral reefs. Science 26: 460-462. doi:
10.1126/science.aar3320
10
Gall SC and Thompson RC (2015) The impact of debris on marine life. Marine Pollution Bulletin 92: 170–179. doi: 10.1016/j.
marpolbul.2014.12.041
11
Zheng J and Suh S (2019) Strategies to reduce the global carbon footprint of plastics. Nature Climate Change 9: 374–378. doi:
10.1038/s41558-019-0459-z; -- CO2 Emissions | Global Carbon Atlas. Available: http://www.globalcarbonatlas.org/en/CO2-emissions.
Accessed Oct 9, 2019a.
12
Plastic and Climate (2019). The Hidden Costs of a Plastic Planet. Center for International Environmental Law. Available at: https://
www.ciel.org/reports/plastic-health-the-hidden-costs-of-a-plastic-planet-february-2019/
13
The Coca-Cola Company Announces New Global Vision to Help Create a World Without Waste. 01/19/2018 https://www.
coca-colacompany.com/press-releases/coca-cola-announces-new-global-vision-to-help-create-world-without-waste and PepsiCo
Accelerates Plastic Waste Reduction Efforts 09/13/2019https://www.pepsico.com/news/press-release/pepsico-accelerates-plastic-
waste-reduction-efforts09132019
14
Geyer R, Jambeck JR and Law KL (2017) Production, use, and fate of all plastics ever made. Science Advances 19 Jul
2017:Vol. 3, no. 7, e1700782 DOI: 10.1126/sciadv.1700782. Available at: https://advances.sciencemag.org/content/3/7/e1700782
15
Environmental protection Agency: National Overview: Facts and Figures on Materials, Wastes and Recycling. https://www.epa.gov/
facts-and-figures-about-materials-waste-and-recycling/national-overview-facts-and-figures-materials#Recycling/Composting
16
GlobalData (2019) Market Data NARTD and packaging industry.
17
Laboy, C, HSBC Securities (USA) Inc. (2019) Global Research report. Can´t drink this one away
18
Albrecht P, Brodersen J, Horts D, PricewaterhouseCoopers AG (2011) Reuse and Recycling Systems for Selected Beverage
Packaging from a Sustainability Perspective Available at: http://www.duh.de/fileadmin/user_upload/download/Projektinformation/
Kreislaufwirtschaft/PwC-Study_reading_version.pdf
19
Interview with Carlos Laboy, Global Beverage Head, LatAm Food Analyst, HSBC Securities (USA) Inc.
20
Albrecht P, Brodersen J, Horts D, PricewaterhouseCoopers AG (2011) Reuse and Recycling Systems for Selected Beverage
Packaging from a Sustainability Perspective Available at: http://www.duh.de/fileadmin/user_upload/download/Projektinformation/
Kreislaufwirtschaft/PwC-Study_reading_version.pdf
21
GlobalData, Market Data Global NARTD market
22
Interview with Carlos Laboy, Global Beverage Head, LatAm Food Analyst, HSBC Securities (USA) Inc.
23
Interview with Bill Taylor, Beverage Industry Consultant, Former Head of SAIPA.
24
Interview with Carlos Laboy, Global Beverage Head, LatAm Food Analyst, HSBC Securities (USA) Inc.
25
Laboy, C, HSBC Securities (USA) Inc. (2019) Global Research report. Can´t drink this one away.
26
GlobalData, Market Data Global NARTD market. Refillables here contains pack materials consisting of glass, PET, HDPE,
Polycarbonate, metal, polypropylene, and board.
27
National Geographic, How the plastic bottle went from miracle container to hated garbage, quoting Elizabeth Royte (Bottlemania),
citing data from Container Recycling Institute. Available at: https://www.nationalgeographic.com/environment/2019/08/plastic-
bottles/#close
28
Morawski, C. (2019) The Refillable Beverage Container – Is it Vanishing? And if it is, are there ways to stop it? Reloop Presentation
September 2019.
29
Based on: GlobalData (2019) Market Data NARTD and packaging industry. Jambeck et. al (2015). Plastic pollution rates calculated
for coastal populations by Jambeck et.al are used to calculate PET bottles waste pollution in 76 coastal countries, where data was
available. NARTD volume market data and refillable rates for glass and PET, available from GlobalData have been used to calculate
potential increases and decreases in ocean pollution.13
13 Oceana White
Just one word: Paper
refillables.
30
10% refers to 10% growth of market share in absolute terms, meaning an increase in market share of glass refillables from 5% to
15% and for PET refillables from 6% to 16%, for example, in relation to the entire NARTD market.
31
Oceana calculation
32
Oceana, About Us Philippines. https://ph.oceana.org/about-oceana/about-us
33
GlobalData, Market Data Global NARTD market
34
IFEU Heidelberg (2008) Im Auftrag der Genossenschaft Deutscher Brunnen eG Ökobilanz der Glas- und PETMehrwegflaschen der
GDB im Vergleich zu PET-Einwegflaschen, page 62, quoted in: Rethink Plastic Alliance (2019) Reusable solutions: How governments
can help stop single-use plastic pollution. Available at: https://rethinkplasticalliance.eu/wp-content/uploads/2019/10/bffp_rpa_
reusable_solutions_report.pd
35
Cifuentes L, Cabrera C, Busch P, Dictuc S.A (2019) Life Cycle Assessment of Single-Serve Beverage Packaging for Oceana Chile
36
See e.g. IFEU (2013) Handreichung zur Einweg-Mehrweg-Diskussion. Available at: https://www.ifeu.de/oekobilanzen/pdf/IFEU%20
Handreichung%20zur%20Einweg-Mehrweg-Diskussion%20 (13Juli2010).pdf
37
Albrecht P, Brodersen J, Horts D, PricewaterhouseCoopers AG (2011) Reuse and Recycling Systems for Selected Beverage
Packaging from a Sustainability Perspective Available at: http://www.duh.de/fileadmin/user_upload/download/Projektinformation/
Kreislaufwirtschaft/PwC-Study_reading_version.pdf
38
Morawski, C. The Refillable Beverage Container – Is it Vanishing? And if it is, are there ways to stop it? Reloop Presentation 2019.
39
A good overview on deposit return schemes for refillable and non-refillable bottles can be found in: Reloop, CM Consulting Inc.
(2016)Deposit Systems for One-way Beverage Containers: Global Overview. Available at: http://www.cmconsultinginc.com/wp-
content/uploads/2017/05/BOOK-Deposit-Global-24May2017-for-Website.pdf
40
Recent examples for proposals for plastic packaging taxes include the United Kingdom and Italy. Italy’s Budget Law for fiscal year
(FY) 2020 confirmed the introduction of a proportional tax on manufactured products in plastic for single use (also called “MACSI”),
aimed at reducing the production and consumption of plastic. https://taxnews.ey.com/news/2020-0097-italy-introduces-proportional-
tax-on-plastic-items?uAlertID=Sd%2fG8rua1oj6%2fl58EZ2AiA%3d%3d. In the United Kingdom, government announced in April 2022
that it would introduce a new tax on the production and import of plastic packaging with less than 30% recycled content. https://www.
gov.uk/government/consultations/plastic-packaging-tax#history
41
German legislation mandates a 70% quota for refillables. Verpackungsgesetz - VerpackG. https://www.bgbl.de/xaver/bgbl/text.
xav?SID=&tf=xaver.component.Text_0&tocf=&qmf=&hlf=xaver.component.Hitlist_0&bk=bgbl&start=%2F%2F*%5B%40node_id%3D%
27356083%27%5D&skin=pdf&tlevel=-2&nohist=1
42
Many municipalities around the world have enacted bans and/or limits on bottled water for certain areas. For example, the New
South Wales town of Bundanoon in Australia, several municipalities in Canada, and several municipalities in the United States. The
Indian government of Maharashtra banned all single-use plastic beverage bottles in March 2018
43
Morawski C. (2019) Global Overview of Refillable Bottles: A closer look at the data and trends. Reloop Presentation. Available at:
https://reloopplatform.eu/wp-content/uploads/2019/10/Reloop_Morawski_Global_Overview_of_Refillable_Bottles.pdf
44
Simon F. Broad support’ for EU-wide plastic tax. EURACTIV. 16.10.2019. https://www.euractiv.com/section/energy-environment/
news/broad-support-for-eu-wide-plastic-tax/1391469/
45
Hook L. UK to introduce plastics tax for packaging by April 2022. Financial Times 29.10.2018. https://www.ft.com/content/
ce4b8cfc-dba0-11e8-9f04-38d397e6661c
46
Italy to tax plastic and sugar, angering producers. Reuters. 28.19.2019. Available: https://www.reuters.com/article/us-italy-budget-
plastic/italy-to-tax-plastic-and-sugar-angering-producers-idUSKBN1X71XF
47
Gesetz zur Fortentwicklung der haushaltsnahen Getrennterfassung von wertstoffhaltigen Abfällen. Bundesgesetzblatt Jahrgang
2017 Teil I Nr. 45, ausgegeben zu Bonn am 12. Juli 2017.
48
Deutsche Umwelthilfe. Boykott der Mehrwegquote stoppen: Verbände-Allianz fordert Abgabe auf Einweg und startet neue
Verbraucherkampagne für klimafreundliche Mehrwegflaschen. Pressemitteilung. 29.04.2019. Available: https://www.duh.de/presse/
pressemitteilungen/pressemitteilung/boykott-der-mehrwegquote-stoppen-verbaende-allianz-fordert-abgabe-auf-einweg-und-startet-
neue-verbra/
49
Packaging Waste in the ASEAN Region. Deutsche Gesellschaft für Internationale Zusammenarbeit (GIZ) GmbH.
Available: https://www.giz.de/de/downloads/giz2018_ASEAN-Packaging-Waste_web.pdf Packaging Waste in the ASEAN Region.
Deutsche Gesellschaft für Internationale Zusammenarbeit (GIZ) GmbH.
50
India shelves plan on countrywide ban on single-use plastic products. Reuters. 01.10.2019. Available: http://news.trust.org/
item/20191001134611-ksu32
51
Plastic ban in Mumbai: Here’s a list of what’s banned, what’s not. 26.09.2019. Available: https://www.livemint.com/news/india/
plastic-ban-in-mumbai-here-s-a-list-of-what-s-banned-what-s-not-1569467749559.html
52
European Commission (2019) Directive (EU) 2019/904 of the European Parliament and of the European Council. Available at:
DIRECTIVE (EU) 2019/904 OF THE EUROPEAN PARLIAMENT AND OF THE COUNCIL
of 5 June 2019 on the reduction of the impact of certain plastic products on the environment
53
European Commission (2019) The European Green deal. Communication from the Commission to the European Parliament,
the European Council, the Council, the European Economic and Social Committee and the Committee of the Regions. 11.12.2019.
Com(2019) 640 final. Available at: https://ec.europa.eu/info/sites/info/files/european-green-dealcommunication_en.pdf
54
Wilts H, Bakas I (2019) European Evironment Agency, Preventing plastic waste in Europe. https://www.eea.europa.eu/publications/
preventing-plastic-waste-in-europe/download
55
Steger S. et al. (2019)Stoffstromorientierte Ermittlung des Beitrags der Sekundärrohstoffwirtschaft zur Schonung von
Primärrohstoffen und Steigerung der Ressourcenproduktivität Abschlussbericht. https://www.umweltbundesamt.de/sites/default/files/
medien/1410/publikationen/2019-03-27_texte_34-2019_sekundaerrohstoffwirtschaft.pdfJust one word: refillables. Oceana is the largest international advocacy organization dedicated solely to ocean conservation. Oceana is rebuilding abundant and biodiverse oceans by winning science-based policies in countries that control one-third of the world’s wild fish catch. With more than 225 victories that stop overfishing, habitat destruction, pollution, and the killing of threatened species like turtles and sharks, Oceana’s campaigns are delivering results. A restored ocean means that 1 billion people can enjoy a healthy seafood meal, every day, forever. Together, we can save the oceans and help feed the world. Visit www.oceana.org to learn more.
You can also read