RECIDIVISM IN ARKANSAS - A Roadmap to Reform
←
→
Page content transcription
If your browser does not render page correctly, please read the page content below

RECIDIVISM
IN ARKANSAS
A Roadmap to Reform
              Secretary Solomon Graves
    Director Dexter Payne         Director Jerry Bradshaw
    Division of Correction   Division of Community Correction

                    Dr. Tabrina Bratton, Ph.D.
    Quality Improvement and Program Evaluation Administrator
                             – 2022 –
RECIDIVISM IN ARKANSAS
                                         A Roadmap to Reform

Table of Contents
Introduction............................................................3

Recidivism Rates...................................................4

Demographics and Characteristics........................7

Predictors of Recidivism......................................19

Conclusion...........................................................21

Glossary of Terms and Measures........................22

References...........................................................24

                                                                            1
RECIDIVISM IN ARKANSAS
            A Roadmap to Reform

Summary
of Findings
Return Rates:
  The 36-month return rate for the DOC 2017
  release cohort was 46.1%, the lowest rate
  since the 2012 release cohort.                Predictors of Recidivism:
  The 36-month return rate for those              Those 18 to 24 years of age are 1.5
  released from the Division of Correction        times more likely to recidivate than older
  was 47.8%.                                      individuals.
  The 36-month return rate for those              The probability of recidivism is 1.8 times
  released from the Division of Community         higher for men than women.
  Correction was 37.5%.                           Previous incarceration predicts future
  The 36-month probation imposition rate          incarceration.
  was 4.5%.                                       The odds of security threat/terrorist group
  Half of those who returned did so within 13     (STTG) affiliates recidivating are 1.2 times
  months of their release.                        higher than non-affiliates.
  The median number of months for                 Reincarceration is more likely for
  receiving a probation sentence after            supervised individuals than for those who
  release was 19.                                 discharged their sentence.

        2
RECIDIVISM IN ARKANSAS
                                                                     A Roadmap to Reform

                                                               Introduction
                                   Recidivism is defined in Arkansas Code Annotated
                                (A.C.A.) § 5-4-101 as “a criminal act that results in the
                         rearrest, reconviction, or return to incarceration of a person
                    with or without a new sentence during a three-year period following
               the person’s release from custody.” Recidivism rates are often used to
          measure criminality among formerly incarcerated individuals and assess the
    impact of criminal justice interventions. To adhere to our commitment to transparency,
the Arkansas Department of Corrections (DOC) publishes a yearly report highlighting
recidivism rates and associated data among those released from DOC custody.

This report is similar to previous reports, in that we describe the characteristics of those
released from the DOC in 2017 and the return rates of those who returned to incarceration
within 36 months, but we have made some notable changes.1 Namely, the biggest change,
is the expansion of the conceptualization of recidivism by including probation impositions
within 36 months of release. Although this change eliminates our ability to compare past
recidivism rates, it better aligns with the statutory definition. To help formerly incarcerated
individuals avoid continued criminality, it is necessary to better understand factors
associated with recidivism. Thus, we also added a regression analysis to identify the
factors that increase the risk of recidivism among those released in 2017. This scientific
addition is important because the findings can inform correctional policies and practices
that aim to reduce criminality and recidivism rates.

1
  Due to data limitations, separate program evaluations, and scant empirical support, we excluded some of the items
included in previous reports: institutional programming, military history, unit of release, specific crime types, and county
of conviction.
*Recidivism rates are measured differently across states. This means Arkansas’ recidivism rates cannot be compared to
any other state.

                                                                                                            3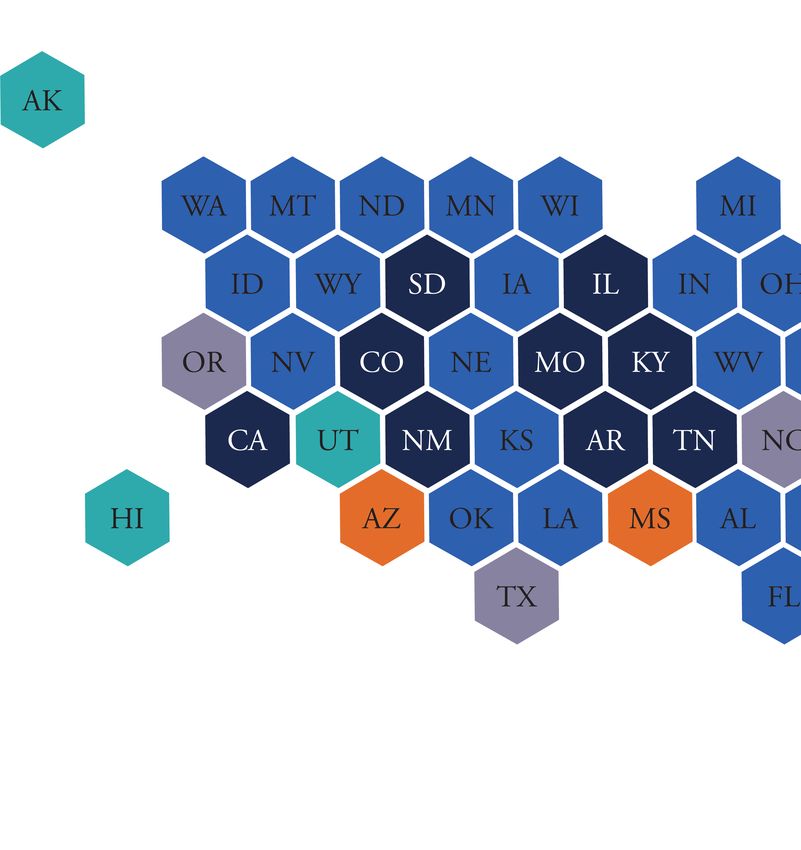
RECIDIVISM IN ARKANSAS
                 A Roadmap to Reform

Recidivism Rates
Despite the statutory definition                                 probation rate among those released in
of recidivism in Arkansas, DOC                                   2017, was 4.5%.
researchers do not have access to                                Although this report primarily focuses
arrest data. Therefore, in this report,                          on 36-month return rates for the DOC
recidivism was defined as a probation                            more broadly, division-specific rates
imposition or return to incarceration                            were calculated to better understand
in a DOC facility within 36 months of                            recidivism within 6, 12, and 36
their 2017 release.2 In 2017, 10,795                             months of release (see Graph 1 on
individuals were released from a                                 the following page). Namely, in 2017,
Division of Correction (ADC) prison,                             9,020 people were released from the
Division of Community Correction
(ACC) center, or a contracted
facility under the jurisdiction of
the DOC (e.g., an ACC Reentry
house; n = 577) or county jail (n
= 802).3 Within 36 months from
release, 4,981 individuals were
reincarcerated in a DOC facility
and 484 received a probation
imposition in Arkansas.4 This
means that the recidivism rate
for the 2017 release cohort was
50.6%. Throughout this report,
we largely discuss returns to
incarceration (i.e., return rates)
and probation impositions (i.e.,
probation rates) separately to
minimize the differences between
the past and current reports.
The return rate for the DOC was
46.1% – the lowest reported
rate since the 2012 release
cohort (Arkansas Department of
Corrections; see Table 1). The

2
  For those released multiple times in 2017, we employed data from their last release of the year. A return to incarceration was
defined as someone’s first return to an ADC facility or ACC center after their 2017 last release. For instance, 298 individuals
were reincarcerated and sentenced to probation during the 36 months after their release, they were only included in the returns
to incarceration cohort.
3
  Individuals released from incarceration in another state and from the Supervision Sanction Program (SSP) were excluded from
the release sample.

            4
RECIDIVISM IN ARKANSAS
                                                            A Roadmap to Reform

       ADC and 1,775 from the ACC. Within                 in 2017, 4.2% (n = 383) received a
       36 months, 47.8% (n = 4,315) of those              probation sentence within 36 months.
       released from the ADC and 37.5% (n                 The probation rate for those released
       = 666) of individuals from the ACC                 from the ACC was slightly higher than
       returned to incarcerated. For ACC, the             ADC at 5.7% (n = 101). Consistent
       return rate did not change from 2016 to            with past reports, we also explored
       2017. For ADC, the return rate slightly            the demographic characteristics of
       declined between the 2016 and 2017                 those released in 2017 and their
       release cohorts (from 48.7 to 47.8).               corresponding recidivism
       Among those released from ADC                      rates.

                                                             Table 1
                                                             DOC Return Rates for
                                                             the 2012 to 2017 Cohorts

                                                             Cohort Year    Return Rate

                                                                2012            43.6

                                                                2013            49.0

                                                                2014            51.1

                                                                2015            49.2

                                                                2016            47.5

                                                                2017            46.1
4
  Federal and other state prison admission data are not
tracked by the DOC. This means those reincarcerated or
sentenced to a term of probation outside of the DOC’s
jurisdiction were excluded from the return sample.

                                                                                          5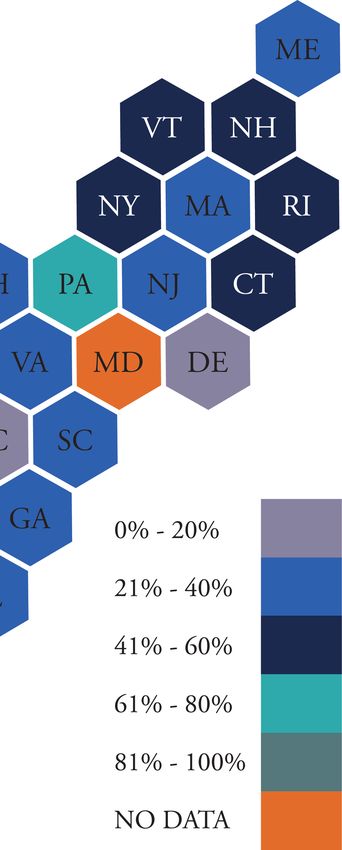
RECIDIVISM IN ARKANSAS
              A Roadmap to Reform

Graph 1
ADC, ACC, and DOC 6-, 12-, 36-Month Probation Impositions and Returns for the 2017 Release Cohort

          6
RECIDIVISM IN ARKANSAS
                                                                          A Roadmap to Reform

Demographics and Characteristics
Table 2
Demographics and Return Rates for the 2017 Release and Return Cohorts

                                Released                      Probation                      Return                 Recidivism
                               (N = 10,795)                   (N = 484)                    (N = 4,981)                Rate
                           f                  %          f                %            f                 %              %
GENDER
             Male        9,007            83.4           364              75.2       4,391           88.2              52.8
           Female        1,788            16.6           120              24.8         590               11.8          39.7
AGE AT RELEASE
          18 to 24       1,031                9.6            53           11.0         570               11.4          60.4
          25 to 34       4,124            38.2           203              41.9       2,042           41.0              54.4
          35 to 44       3,278            30.4           143              29.5       1,512           30.4              50.5
          45 to 64       2,291            21.2               84           17.4         843           16.9              40.5
              65+              71             0.6             1            0.2             14             0.3          21.1
RACE
            White         7,115           65.9           363              75.0       3,311           66.5              51.6
             Black       3,333            30.9           113              23.3       1,519           30.5              49.0
            Other          347                3.2             8            1.7         151                3.0          45.8
EDUCATION
RECIDIVISM IN ARKANSAS
                   A Roadmap to Reform

Gender                                  Table 3
Although the number            Release, Probation, and Return Frequencies by Division and Gender
of female inmates
                                              Released                Probation               Return
continues to increase                        (N = 10,795)              (N = 484)           (N = 4,981)
throughout the U.S.,
                                              f           %           f           %         f          %
the correctional
population is primarily        ADC       (n = 9,020)              (n = 383)           (n = 4,315)
composed of males                Male       7,723        85.6        298         77.8    3,844       89.1
(Harmon & Boppre,              Female       1,297        14.4         85         22.2      471       10.9
2015; Jeffries &
                               ACC       (n = 1,775)              (n = 101)            (n = 666)
Newbold, 2015). So,
it is not surprising             Male       1,284        72.3         66         65.3      547       82.1
that men made up               Female         491        27.7         35         34.7      119       17.9
83.4% (n = 9,007)
of the 2017 release                                  Gottfredson, 1983; Nieuwbeerta et al.,
cohort and 88.2% (n = 4,391) of those                2010). Consequently, we expected the
reincarcerated. Women, then, made up                 individuals in our sample to be younger,
the remaining 16.6% (n = 1,788) of those             but, regardless of gender or other factors,
released and 11.8% (n = 590) of the return           the average age was 35 (35.1, Min = 16,
cohort. A division-specific breakdown also           Max = 83) at intake and nearly 37 (36.6,
shows that males recidivated more often              Min = 18, Max = 86) at release.
than females (see Table 3). The 36-month
return rate was higher for the males                 Similarly, the average age of recidivists
(48.8%) than their female counterparts               was 35 (35.1, Min = 18, Max = 78).
(33.0%). There was even less parity                  Although the bulk of the release and
between the men and women sentenced                  return cohorts were between 25 and 64
to probation. Namely, 75% of those who               years of age, individuals between 18 and
received probation within 36 months were             24 years of age had the highest return
men (75.2%, n = 364).                                (55.3%) and probation (5.1%) rates of any
                                                     other age group. Those 65 years of age
Age                                                  and older had the lowest return (19.7%)
                                                     and probation (1.4%) rates.5 Regardless
Researchers have well established the                of the type of sanction received after
negative relationship between age and                release (i.e., reincarceration or probation),
criminal behavior. More specifically,                recidivism rates subsequently declined
criminality generally peaks around the               as age increased, which aligns with the
late teens and early twenties and steadily           existing literature on age and criminality
declines as age increases (Hirschi &                 (see Graph 2).

5
    Only one person over the age of 64 (N = 71) was sentenced to probation within 36 months of their 2017 release.

              8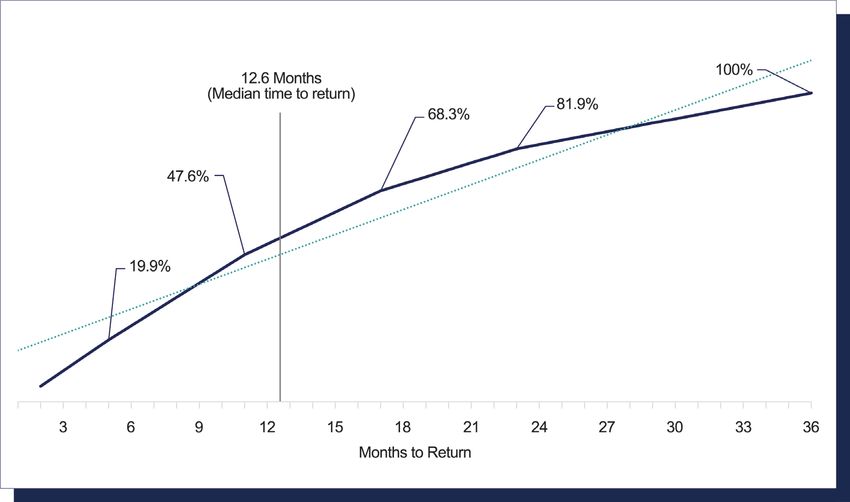
RECIDIVISM IN ARKANSAS
                                                            A Roadmap to Reform

Race
Though White
individuals
made up the
majority (65.9%,
n = 7,115) of
the released
sample, Black                                            1,512) were White, 14% (14.2%, n = 254)
individuals (30.9%, n = 3,333) were                      were Black, and only around 1% (1.2%,
overrepresented in relation to the larger                n = 22) were Hispanic, Pacific Islander,
population of Arkansas (see https://www.                 Asian, or Native American. The racial
census.gov/quickfacts/AR for census                      composition of the women who returned
information). Most of the sample were                    to incarceration (n = 590) and received a
men, so the racial composition of the males              probation sentence (n = 120), resembled
reflected that of the release and recidivism             the female release cohort. That is, 90%
cohorts. However, the racial breakdown                   of the women who received a probation
was less diverse among the 1,788 females                 imposition (n = 108) and 86% (86.1%; n =
released in 2017. Nearly 85% (84.6%, n =                 508) of those reincarcerated were White.
Graph 2
Release Frequencies and Recidivism Rates by Age Group

Note: “Percent Recidivated” is the percent of those who were placed on probation or
reincarcerated within 36 months of their release.
                                                                                       9
RECIDIVISM IN ARKANSAS
A Roadmap to Reform
Educational between criminality and socioeconomic
status, providing incarcerated individuals
Attainment with educational and vocational opportunities
Educational attainment among the released would likely lower recidivism rates.
cohort ranged from less than high school Table 4
to having a college degree (viz., bachelor’s
Demographics of STTG Affiliated Individuals
or master’s degree), but the majority had
a high school diploma (23.2%, n = 2,498) Release Probation Return
or a GED (44.9%, n = 4,841; see Table 2). (N = 1,774) (N = 72) (N = 1,005)
Those with a college degree (1.2%, n = Gender
126) were underrepresented relative to the Male 1,749 70 996
larger Arkansas population (https://www. Female 25 2 9
census.gov/quickfacts/AR). Among those Age at Release
who were reincarcerated, those with a GED 18 to 24 144 8 95
had the highest return rate (52.0%), and 25 to 34 748 35 445
those who had some college had the highest 35 to 44 680 24 365
probation (5.1%) rate, while those with a 45 to 64 199 5 99
college degree had the lowest rates (31.7%; 65+ 3 0 1
3.2%). Although the majority had a GED, we Race
were unable to identify whether they received White 711 27 439
their diploma during incarceration. Thus, Black 1,008 44 530
the numbers should not be used to make Other 55 1 36
inferences about the Corrections School or Educational Attainment
other educational institutions. More researchRECIDIVISM IN ARKANSAS
A Roadmap to Reform
STTG Table 5
Individuals affiliated with Descriptive Statistics for Return Types
a security threat / terrorist
Technical Violations Criminal Offense
group (STTG) made up (N = 2,635) (N = 2,346)
16.4% (n = 1,774) of the %
―
x %
―
x
release sample. Nearly Gender
all, of which, were male Male 89.2 – 87.0 –
(98.6%, n = 1,749). The Female 10.8 – 13.0 –
majority of the released Age at Intake – 33.9 – 33.6
STTG affiliates were Age at Release – 35.3 – 34.7
Black (56.8%, n = 1,008), Race
between 25 and 44 years White 60.9 – 72.7 –
Black 36.1 – 24.2 –
of age (80.5%, n = 1,428),
Other 2.9 – 3.1 –
and had a high school Educational Attainment
diploma or GED (69.6%,RECIDIVISM IN ARKANSAS
A Roadmap to Reform
Release Types Interestingly, over half of those who
returned for a drug-related crime were
and Returns (continued) serving time for a drug offense prior to
their 2017 release (56.1%, n = 654). Drug
To better understand the offense crimes were the most common return
associated with the cohort’s 2017 offense regardless of gender, race, or
incarceration and what type of crime led educational attainment. Though this was
to their return,6 release offenses were true for most of the age cohorts, 21%
explored. We found that one-fourth of (21.1%, n = 120) of those between 18 and
those released were serving time for a 24 years of age returned for a non-violent
violent offense before their 2017 release, offense,7 while 18% (18.1%, n = 103) were
but most were incarcerated for a drug reincarcerated for a drug crime. Of those
(38.5%, n = 4,155) or non-violent offense who returned for a criminal offense, 34.6%
(32.6%, n = 3,517; see Graph 3). Of the came back because of a non-violent crime
2,346 people who returned because of (n = 812), including the 80 individuals
a criminal offense, 49.7% (n = 1,167) (female, n = 4; male, n = 76) who failed to
were reincarcerated for a drug offense. register as a sex offender.
Graph 3
Release and Return Offense Types and Technical Violations
12RECIDIVISM IN ARKANSAS
A Roadmap to Reform
Table 6
Release and Return Types by Gender Time to Probation
Offense Type
Release
(N = 10,795)
Return
(N = 4,981)
and Return to
f % f % Incarceration
Male (n = 9,007) (n = 4,391)
For formerly incarcerated individuals the
Violent & Sexual 363 4.0 18 0.4
likelihood of recidivating is the highest
Violent 2,354 26.1 317 7.2
within the first year of release (Benda,
Sexual 94 1.0 7 0.2
2005; Caudill, 2010; Jung et al., 2010;
Drug 3,241 36.0 969 22.1
Schmidt & Witte, 1989). In line with the
Non-Violent 2,955 32.8 729 16.6
literature, half of those in the release
Technical Violation – – 2,351 53.5
sample were reincarcerated 13 months
Female (n = 1,788) (n = 590)
(12.6 months) after their release (see
Violent & Sexual 11 0.6 1 0.2 Graph 4). This was particularly true for
Violent 299 16.7 24 4.1 those 34 years of age and younger,
Sexual 2 0.1 0 – who made up 54.6% of all the 12-month
Drug 914 51.1 198 33.6 returns. The youngest age cohort, those
Non-Violent 562 31.4 83 14.1 between 18 and 24 years of age, had
Technical Violation – – 284 48.1 the fastest return average (13 months)
of the age cohorts (see Table 7).
Graph 4
Time to Return to Incarceration
6
Individuals who returned to incarceration could have been convicted of multiple crimes; however, return offense was measured using
only the most serious offense.
7
For the return criminal offense types, failure to register as a sex offender (n = 80) was included in the non-violent offense category. This
means that failing to register as a sex offender was their most serious offense leading to their return. Of the return sample, less than 2%
(n = 96) failed to register as a sex offender before they were incarcerated regardless of other offenses or violations.
13RECIDIVISM IN ARKANSAS
A Roadmap to Reform
Table 7
Time to Probation Time to Return by Age Group (N = 4,981)
and Return to Age Groups
Average Time to
Probation (N = 484)
Average Time to
Return (N = 4,981)
Incarceration 18 to 24 17.2 13.0
(continued) 25 to 34 18.6 14.2
35 to 44 17.8 14.7
Despite the existing literature and the
time to return rates, for those who 45 to 64 19.2 14.9
received a probation sentence after 65+ – 13.9
release the median time to probation Note:
was 19 months (19.3 months, X̅ = 18. 3 Time to return to incarceration ranged from less than
months). In fact, only 28.3% (n = 137) of one month (0.3) to 36 months.
the 484 probation impositions received Time to probation ranged from 1 day to 36 months.
by the release cohort occurred within Only one person placed on probation was person 65
years of age or older.
12 months of release. Like time return,
though, the youngest individuals
received a probation imposition faster Those without a college degree returned
than their older counterparts (see Table between 14 and 15 months. Among those
7). More specifically, those between the with a bachelor’s or master’s degree,
ages of 18 and 24 accounted for the the average time to return was nearly
smallest age cohort (10.9%, n = 53) of 17 months (16.5 months). On average,
the probation sample, but had the fastest individuals with a bachelor’s or master’s
time to probation average (17.2 months). degree received probation after nearly 17
Additionally, the oldest cohort, those months (16.8 months) from their release.
between 45 and 64 years have the slowest Those with a GED, received probation
time to probation average (19.2 months). after almost 19 months (18.8 months),
the slowest time to probation of the
Like age group differences, time to educational cohorts.
probation and return to incarceration
varied by gender, levels of educational Finally, those under community supervision
attainment, and whether someone was returned nearly 14 months (14.3 months)
under community supervision. For women, after their 2017 release, while individuals
the average time to probation and return who discharged their sentence were
was slightly longer than for men. That is, reincarcerated after nearly 16 months (15.6
the females returned to incarceration after months). The average time to probation
16 months (16.4 months) and received among the individuals who discharged
probation after 20 months (20.6 months), their sentenced and were released in 2017
while men received probation at 17.5 was 15.5 months. For those who were
months and returned to incarceration 14 released to supervision, the average time
months after release. to probation was 18.9 months.
14RECIDIVISM IN ARKANSAS
A Roadmap to Reform
Length of served 18.5 months, while their female
counterparts were incarcerated for 12.5
Incarceration months.
and Criminal History Criminal history or frequent criminal
justice system involvement can also
Sentence length can impact future influence recidivism (Doerner & Demuth,
criminality among formerly incarcerated 2014; Kurlychek et al., 2006). As a
individuals (Collins, 2010; Rydberg & proxy measure for criminal history,
Clark, 2016). To better understand how we explored previous incarcerations
long someone spent incarcerated before among those released in 2017. Previous
their 2017 release, we included an incarcerations ranged from one to
item for sentence length (measured in 19. The average number of previous
months). For the 2017 release cohort, the incarcerations for those released in
average length of incarceration was 17.5 2017 was 2.9 and 3.2 for those who
months and 15 months (14.8 months, recidivated within 36 months. We also
N = 5,465) for those who recidivated. found that previous incarcerations
Sentence length also differed by type differed by recidivism type. Also, on
of recidivism and gender. Namely, average, those who were reincarcerated
people who received probation spent after their release had been previously
an average of 12.5 months incarcerated incarcerated more times (M = 3.2, N =
before their release, while the average 4,981) than those who received a probation
length for those who were reincarcerated imposition after their release in 2017 (M =
was 15 months. On average, the males 2.8, N = 484).
Table 8
Descriptive Statistics for the 2017 Release, Probation, and Return Cohorts
Release Probation Return
(N = 10,795) (N = 484) (N = 4,981)
― ― ―
x Range x Range x Range
Age
at Intake 35 16 to 83 34 17 to 67 34 16 to 77
at Release 37 18 to 86 35 18 to 68 35 18 to 78
Length of Incarceration
ACC 15.2 .9 to 242 17.5 – 14.8 – Note:
ADC 17.9 .1 to 492 21.0 – 15.1 – Age was rounded to the
DOC 17.5 .1 to 494 20.3 – 15.0 – nearest whole number.
Time to Return Previous incarcerations
Released from ACC – – 20.3 0 to 36 15.7 0 to 36 include the sentence in which
they were released in 2017.
Released from ADC – – 17.8 0 to 36 14.2 0 to 36
DOC – – 18.0 0 to 36 14.3 0 to 36
Previous Incarcerations 2.9 1 to 19 2.8 1 to 14 3.3 1 to 19
15RECIDIVISM IN ARKANSAS
A Roadmap to Reform
Restrictive Housing with the best practices literature.
Restrictive housing is when an
incarcerated individual is confined to a cell
Transitional Facilities
for at least 22 hours a day.8 Restrictive The transitional housing program
housing is reserved for those posing a provides housing to formerly incarcerated
direct threat to themselves or those around individuals who were released to
them. Of the 10,795 people released in supervision by the Arkansas Parole Board
2017, 1,152 individuals had spent some or placed on probation by a circuit court.
time in restrictive housing within the last Of the 10,795 released individuals, 1,174
year of their incarceration. Of the 1,152 lived in a transitional facility after their
individuals, 54 received a probation 2017 release. Individuals in transitional
imposition, while 641 were reincarcerated housing had a 53.8% recidivism rate, with
within 36 months of their release. This 56 receiving a probation imposition and
means that the recidivism rate for those 576 being reincarcerated. Though we
who spent time in restrictive housing include transitional facilities in the current
before release was 60.3% (n = 695). report, these individuals are released
then they go to a transition house. Thus,
Reentry Program they are not released from a transitional
house. The recidivism, return, and
The Reentry Program is a 180-day
probation rates presented here should
program designed to ease incarcerated
not be used to make causal assumptions
individuals’ transition from imprisonment
about crime or the effectiveness of the
to society. Program participants live in
transitional facilities. This is particularly
one of the reentry facilities licensed by
important considering homeless and
the DOC, but they are still considered
marginally housed people are more at
an “ADC inmate.” After participants
risk to recidivate than those with stable
complete the program, they are released
housing (Lutze et al., 2014). Additionally,
to community supervision. In 2017,
each transitional facility offers different
577 individuals were released from the
programming and resources. Therefore,
Reentry Program. Within 36 months,
the return rates for those in transitional
266 former program participants were
facilities are likely due to their housing
reincarcerated (46.1%) and 20 received a
situation, not the facility or its practices.
probation imposition (3.5%). This means
that the recidivism rate for those released
from the Reentry Program in 2017 was
Supervision
49.6%. Recently, the Reentry Program Sanction Program
was evaluated by the DOC’s QI/PE staff. The Supervision Sanction Program
The purpose of the qualitative evaluation (SSP) is a short-term (viz., 90 or 180 day)
was to assess the extent to which the residential alternative sanction program.9
program adhered to best practices. The
study’s findings resulted in programmatic 8
Arkansas Department of Corrections, Administrative Directive 2021-15.
and curriculum changes that better align 9
Recently, the length of the SSP changed from 90 and 120 days to 60
and 90 days.
16RECIDIVISM IN ARKANSAS
A Roadmap to Reform
The purpose of SSP is to reduce completed the SSP after their
revocations among probation 2017 release. Of which, 316 SSP
and parole violators and alleviate participants were reincarcerated,
overcrowding in DOC correctional making the return rate for overall SSP
facilities. Overall, 408 individuals completions 77.4% (see Table 9).
Table 9
Descriptive Statistics for the Supervision Sanction Program (SSP)
Participants Returned Return Time to
(N = 408) (N = 316) Rate Return
―
SSP Participation f f % x
1 Time 285 234 82.1 22.0
2 Times 123 82 66.7 25.2
Overall 408 316 77.4 31.3
Predictors of Recidivism
To better understand the impact of X2 (9) = 825.45, p < .001 (see Table 11).
specific factors on reincarceration we Namely, age, gender, race, restrictive
employed binary logistic regression, a housing, previous incarcerations,
statistical technique that allowed us to STTG affiliation, and release type are
regress empirically and theoretically statistically significant predictors of
sound variables on reincarceration. reincarceration. Conversely, the results
Specifically, we regressed age, gender, showed that educational attainment and
race, educational attainment, restrictive release offense were not associated with
housing, previous incarcerations, STTG recidivism.
affiliation, release offense, and release The results were consistent with previous
type on reincarceration within 36 months research, revealing that older individuals
among a sample of 10,714 individuals are less likely to be reincarcerated than
released from a DOC facility in 2017.10 their younger counterparts (b = -.43, p
This scientific addition to the current report < .001). Compared to those between 25
not only helped us identify statistically and 34 years of age, people between
significant predictors of reincarceration, 18 and 24 are 1.5 times more likely to
but the findings lay the foundation for be reincarcerated within 36 months
future research and can be used to inform of their release (OR = 1.54, p < .001).
our policies and practices. Unsurprisingly, then, people 35 years of
The results of the binary logistic age and older are less likely to return to
regression revealed that the model incarceration than those between 25 and
significantly predicts reincarceration, 34 years of age.
10
Diagnostics for binary logistic regression were run but omitted from this report. None of the assumptions of binary logistic regression were
violated. For more information on sample demographics, variables, diagnostics, and findings please contact Dr. Tabrina Bratton at
Tabrina.Bratton@arkansas.gov.
17RECIDIVISM IN ARKANSAS
A Roadmap to Reform
Predictors of Recidivism (continued)
The effects of gender and race also incarceration. That is, those released
align with the existing scholarship. to community supervision are two times
The probability of males returning to more likely to recidivate than those
incarceration is 1.8 times higher than who discharged their sentence (OR =
their female counterparts (OR = 1.76, 2.13, p < .001). This could be related to
p < .001). Though men are more likely sentence length rather than supervision
to be reincarcerated than women, the itself, considering individuals with
female prison population is rapidly shorter probation sentences are more
increasing. Thus, research that focuses on likely to complete their probation than
incarcerated women and gender-specific those with longer terms.11 Finally, for
programming and services is needed. every previous incarceration, the odds
Race also predicted recidivism. Compared of reincarceration increased by 1.3 times
to those whose race was reported as (OR = 1.23, p < .001).
Black, Asian, Hispanic, Pacific Islander,
and Native American individuals were The results suggest that carceral
less likely to return to incarceration than programming, behavioral interventions, and
White individuals. This finding is surprising policy aimed to address the factors that
considering that much of the existing influence criminality should be designed
research suggests that White individuals for those between 18 and 24 years of
are less likely than non-White individuals to age, STTG-affiliates, individuals who have
be incarcerated (Monk, 2018). been in restrictive housing, and those
with a history of incarceration. These
Experiences and associations during individuals have the highest risk of being
incarceration also influence reincarceration. reincarcerated. Further, future research is
Namely, an STTG affiliate is 1.2 times more needed on the relationship between race
likely to be reincarcerated within 36 months and educational attainment and recidivism.
of release than non-affiliates (OR = 1.18,
p < .05). Spending time in restrictive Of the variables in the Model, educational
housing within one year of release attainment and release offense were
increases the probability of returning to not statistically significant predictors.
incarceration. The results showed that Educational attainment is associated
being in restrictive housing increases the with criminality.12 That is, people with
odds of reincarceration by 1.4 times (OR = higher levels of educational attainment
1.382, p < 0.001). typically commit less crime than those
with less education. Surprisingly, in our
Method of release and one’s history Model, educational attainment was not
of incarceration matters for future statistically significant. This finding warrants
more research to better understand the
relationship between education and
11
Sims & Jones, 1997. recidivism in Arkansas.
12
Fella & Gallipoli, 2014; Swisher & Dennison, 2016.
18RECIDIVISM IN ARKANSAS
A Roadmap to Reform
Table 10 Conclusion
Binary Logistic Regression Results
Incarceration adversely impacts families,
Variable OR b RSE the economy, public health, marriages,
Age (25 to 34) communities, and crime and delinquency
18 to 24 1.54 .43** .07 rates.13 The far-reaching effects warrant an in-
35 to 44 .74 -.30** .05 depth look at the Arkansas carceral population
45 to 64 .43 -.84** .06 and the return rates of those released from
65+ .19 -1.64** .33 the DOC. Thus, like previous recidivism
Gender (Female) reports, we explored the characteristics
Male 1.76 .57** .06 and return rates of those released in 2017.
Race (White) Additionally, we added a logistic regression
Black .77 -.26** .05 model to the current report. By employing
Other .82 -.20 .12 this statistical technique, we were able
Educational Attainment (RECIDIVISM IN ARKANSAS
A Roadmap to Reform
Glossary of Terms and Measures
BINARY LOGISTIC REGRESSION. in 2017. This means everyone in the
A statistical technique that explores the release cohort had at least one previous
regressive abilities of predictor variables incarceration. Previous incarcerations
on a dichotomous outcome variable. ranged from one to 19.
EDUCATIONAL ATTAINMENT. PROBATION. A court-imposed sanction
Educational attainment categories include that allows an individual convicted
less than high school, high school diploma, of a criminal offense to remain in the
GED, some college, and college graduate. community under supervision. Although
The “some college” category included people convicted of an offense can
those who reported taking at least some receive probation and be sentenced to
college classes and those who earned incarceration, we looked at the sanctions
an associate of arts degree. The “college separately. For those who did receive
graduate” group includes individuals who probation and returned to incarceration
earned a bachelor’s or master’s degree. (n = 298), we only counted their return.
There were no doctoral degrees in the
sample. Educational data were missing for PROBATION RATE. The number of
20 individuals. people who received probation/number of
those released in 2017.
FAILURE TO REGISTER. Though failure
to register as a sex offender was included RACE. The racial composition was
in the non-violent return offense variable, broken down into three groups: White,
we created a separate item for whether Black, and “Other.” Due to the relatively
someone failed to register regardless small number of Hispanic, Asian, Pacific
of their other crimes or violations. Here, Islander, and Native American individuals,
failure to register may not be their most they were combined to create the “Other”
serious offense, but it occurred during the racial group.
36-month follow-up period. Of the return
sample, less than 2% (n = 96) failed to RECIDIVISM. The legal definition for
register as a sex offender before they were Arkansas is “a criminal act that results
incarcerated. in the rearrest, reconviction, or return to
incarceration of a person with or without
LENGTH OF INCARCERATION. The a new sentence during a three-year
number of months an individual was period following the person’s release from
incarcerated before release in 2017. custody” (A.C.A. § 5-4-101). However,
DOC researchers do not have access to
NUMBER OF PREVIOUS rearrest data. Thus, we defined recidivism
INCARCERATIONS. The number of as a return to incarceration in a facility
times an individual was admitted to a under the jurisdiction of the DOC or
DOC correctional facility includes the receiving a probation imposition within 36
incarceration in which they were released months of their last release in 2017.
20RECIDIVISM IN ARKANSAS
A Roadmap to Reform
RECIDIVISM RATE. The (number of community supervision by the Arkansas
people who returned to incarceration + Parole Board.
number of people who received probation)/
number of those released in 2017.
RETURN OFFENSE. Return offense
was the most serious crime someone
REENTRY PROGRAM. The Reentry released in 2017 was convicted of.
Program is a 180-day program for These offenses were classified into five
incarcerated individuals who transferred crime types: violent and sexual, violent
from the ADC to one of seven licensed only, sex only, drug, and non-violent
reentry facilities located throughout the offenses. For the return offenses, non-
state. During the program, participants violent crime includes failure to register
work full-time and attend Alcoholic and as a sex offender. There were 80 failures
Narcotics Anonymous meetings. to register in the non-violent return
offenses, which means that was their
RELEASE DIVISION. Individuals most serious offense.
were released from DOC’s institutional
(viz., ADC) and community (viz.,
ACC) correctional facilities. Although RESTRICTIVE HOUSING. Restrictive
we considered the release division a Housing (viz., being placed in a confined
dichotomy (i.e., released from ACC or cell for at least 22 hours a day) is
ADC), this variable was composed by commonly used for individuals who pose
combining ACC centers (n = 1,198) and a threat to those around them, themself,
reentry facilities (n = 577) releases and or the safe and secure operations of the
releases from ADC prisons (n = 7,693), facility. We used a binary item indicating
county jails backup (n = 802), 309 (n = whether a person was in restrictive
57), work release (n = 463), and Arkansas housing at any point in the 12 months
State Police (n = 5). before their release.
RELEASE OFFENSE. The most SECURITY THREAT / TERRORIST
serious active offense on record at the GROUP (STTG). Individuals who were
time of release was considered their affiliated with a group that poses a threat
release offense. These offenses were to the security of the institution or the
classified into five crime types: violent physical safety of other inmates and staff.
and sexual, violent only, sex only, drug,
and non-violent offenses.
TRANSITIONAL FACILITY. In 2017,
1,174 people listed in their approved
RETURN RATE. The number of people parole plan that they would be going to
who returned to incarceration/number of live in a transitional facility. The transitional
those released in 2017. housing program provides housing to
formerly incarcerated individuals who were
RELEASE TYPE. Incarcerated released to supervision by the Arkansas
individuals are released by discharging Parole Board or placed on probation by a
their sentence or being transferred to circuit court.
21RECIDIVISM IN ARKANSAS
A Roadmap to Reform
Supplemental Information
Figure 1
Supplemental Figure from Arkansas Department of Corrections’ “2016 Recidivism Study”
22RECIDIVISM IN ARKANSAS
A Roadmap to Reform
The graphic represents the 2016 recidivism rates
reported by state correctional agencies. It is
important to note that states define and measure
recidivism differently. Thus, recidivism rates
should not be compared across states. Below
are examples of some of the various recidivism
measurements and reporting practices from state
agencies across the U.S.
Recidivism Defined:
Iowa, Michigan, Utah’s recidivism rate is
defined as reincarcerations
Connecticut, Oregon, and Texas define
recidivism as arrests, convictions, and
incarcerations after release
Virginia counts someone as a recidivist if they
were “convicted of a felony in Virginia with
a sentence of one year or more or a parole
violation with a sentence of two years or more.”
Alabama counts those who have had a
revocation due to technical violations after
three 45-day confinements
Vermont includes those who have been
incarcerated for at least one year in their
release cohort and only those who have
returned for at least 90 days as a recidivists
Recidivism Time Frames:
Missouri measures recidivism by fiscal year
Kansas measures recidivism by calendar year
North Carolina and Kentucky explore
recidivism within two years of release
Louisiana explores recidivism within five years
of release
Recidivism Reported:
Montana exclusively reports recidivism by gender
Oregon reports parole and probation separately
Delaware separates their rates by returns to
prison by sentence length
Minnesota separately reports reconvictions
and reincarcerations
23RECIDIVISM IN ARKANSAS
A Roadmap to Reform
References
Aaron, L., & Dallaire, D. H. (2010). Parental Incarceration and Multiple Risk Experiences: Effects on Family
Dynamics and Children’s Delinquency. Journal of Youth and Adolescence, 39(12), 1471–1484.
Benda, B. B. (2005). Gender Differences in Life-Course Theory of Recidivism: A Survival Analysis.
International Journal of Offender Therapy and Comparative Criminology, 49(3), 325–342.
Caudill, J. W. (2010). Back on the Swagger: Institutional Release and Recidivism Timing Among Gang
Affiliates. Youth Violence and Juvenile Justice, 8(1), 58–70.
Collins, R. E. (2010). The effect of gender on violent and nonviolent recidivism: A meta-analysis. Journal of
Criminal Justice, 38(4), 675–684.
Doerner, J. K., & Demuth, S. (2014). Gender and Sentencing in the Federal Courts: Are Women Treated
More Leniently? Criminal Justice Policy Review, 25(2), 242–269.
Fella, G., & Gallipoli, G. (2014). Education and Crime over the Life Cycle. Review of Economic Studies, 81(4),
1484–1517.
Harmon, M. G., & Boppre, B. (2015). Women of color and the war on crime: An explanation for the rise in
Black female imprisonment. Journal of Ethnicity in Criminal Justice, 16(4), 309–332.
Hirschi, T., & Gottfredson, M. (1983). Age and the Explanation of Crime. American Journal of Sociology,
89(3), 552–584.
Jeffries, S., & Newbold, G. (2015). Analysing Trends in the Imprisonment of Women in Australia and New
Zealand. Psychiatry, Psychology and Law, 23(2), 184–206.
Jung, H., Spjeldnes, S., & Yamatani, H. (2010). Recidivism and Survival Time: Racial Disparity among Jail
Ex-Inmates. Social Work Research, 34(3), 181–189.
Kurlychek, M. C., Brame, R., & Bushway, S. D. (2006). Scarlet Letters and Recidivism: Does an Old Criminal
Record Predict Future Offending? Criminology, 5(3), 483–504.
Lutze, F. E., Rosky, J.W., & Hamilton, Z. K. (2016). Homelessness and Reentry: A Multisite Outcome
Evaluation of Washington State’s Reentry Housing Program for High Risk Offenders. Criminal Justice and
Behavior, 41(4), 471–491.
Massoglia, M., Remster, B., & King, R. (2011). Stigma or Separation? Understanding the Incarceration-
Divorce Relationship. Social Forces, 90(1), 133–156.
Monk, E. (2018). The Color of Punishment: African Americans, Skin Tones, and the Criminal Justice System.
Ethnic and Racial Studies, 42(10), 1,593-1,612.
Nieuwbeerta, P., Blokland, A. A. J., Piquero, A. R., & Sweeten, G. (2010). A Life Course Analysis of Offense
Specialization Across Age: Introducing a New Method for Studying Individual Specialization Over the Life
Course. Crime & Delinquency, 51(1), 3–28.
Pettit, B., & Lyons, C. J. (2009). Incarceration and the Legitimate Labor Market: Examining Age-Graded
Effects on Employment and Wages. Law & Society Review, 43(4), 725–756.
Rydberg, J., & Clark, K. (2016). Variation in the incarceration length-recidivism dose–response relationship.
Journal of Criminal Justice, 46, 118–128.
Schmidt, P., & Witte, A. D. (1989). Predicting Criminal Recidivism Using “Split Population” Survival Time
Models. Journal of Econometrics, 40, 141–159.
Sims, B., & Jones, M. (1997). Predicting Success or Failure on Probation: Factors Associated With Felony
Probation Outcomes. Crime & Delinquency, 43(3), 314–327.
Swisher, R. R., & Dennison, C. R. (2016). Educational Pathways and Change in Crime Between Adolescence
and Early Adulthood. Journal of Research in Crime and Delinquency, 53(6), 840–871.
United States Census Bureau. (2020). QuickFacts Arkansas. https://www.census.gov/quickfacts/AR.
24You can also read