MI COVID response Data and modeling update - December 7, 2021 - State of ...
←
→
Page content transcription
If your browser does not render page correctly, please read the page content below

MI COVID response
Data and modeling update
December 7, 2021

Executive Summary
Michigan remains at High Transmission
Percent positivity (19.5%) is increasing (up from 18.9% last week)
Case rate (522.9 cases/million) has decreased for one week, but this is due to lull in reporting over Thanksgiving (556.9 cases/million prior week)
   In the last 7 days, Michigan reported the most cases (last week’s rank: 2nd highest) and the 2nd highest case rate (last week’s rank: 2nd highest)
   Cases among pediatric populations < 12 years have decreased 16% since last week
Percent of inpatient beds occupied by individuals with COVID (21.3%) is increasing for 18 weeks (up from 20.0% last week)
   In the last 7 days, no other state or territory has reported a higher inpatient bed utilization than Michigan (last week: highest) and 3rd highest adult
   ICU bed utilization (7th highest last week)
   Daily pediatric hospital census have increased from last week and are near 2021 highs
Death rate (8.5 deaths/million) is increasing for three weeks (6.3 last week). There were 594 COVID deaths between Nov 23-Nov 29
   Michigan has the 4th highest number of deaths (6th highest last week), and 8th highest death rate (14th highest last week) in the last 7 days
7-day average state testing rate is 4326.0 tests/million/day. Daily diagnostic tests (PCR) is 43.1K per day, and the weekly average for PCR and
   antigen tests conducted in Michigan is 55.3K.
Nearly 13.1 million COVID-19 vaccine doses administered, 55.3% of the population is fully vaccinated (5.5 million people)
133,401 administrations in 5- to 11-year-olds as of 12/2

SCIENCE ROUNDUP
19 states and territories in the United States have reported identification of the Omicron variant
Non-pharmaceutical interventions remain effective against all variants of SARS-COV-2
Vaccines remain effective public health measure to protect people from COVID-19, and slow transmission
Despite the increased attention of Omicron, Delta continues to be the main variant circulating in the United States
Global, National and
Michigan Trends
Global and National Trends

  Globally, 266,004,858 cases and 5,258,833 deaths (Data* through 12/6/2021)
  •    European case rates are increasing rapidly; & cases in South Africa are increasing rapidly following identification of Omicron variant
  United States: Nearly all US jurisdictions have High or Substantial community transmission¶
  •    The U.S. is at High transmission level (223.8 cases/100,000 in last 7 days); metrics are underestimates as reporting lags nationwide over the Thanksgiving holiday
  Midwest states maintain High transmission levels† and are increasing
  •    Michigan has the highest case rate in Midwest
     Source: * Johns Hopkins Coronavirus Resource Center; ¶ CDC COVID Data Tracker Weekly Review; † CDC COVID Data Tracker – CDC recently updated their methodology for reporting case rates

                                     National                                                                                              Public Health                            Other      Science
Special Populations                                                        Spread                            Severity
                                    Comparison                                                                                                Response                           Indicators    Roundup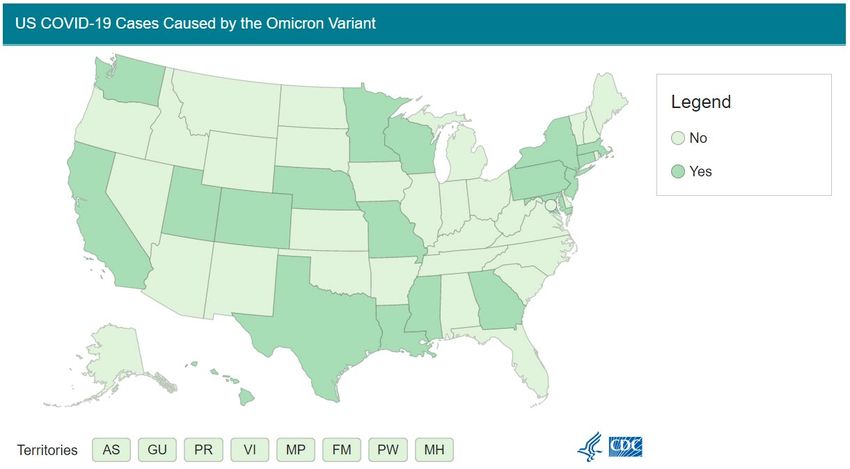
State Comparisons: Wisconsin and Michigan
Wisconsin Confirmed New Cases / 1M (7 days average)                                                        Michigan Confirmed New Cases / 1M (7 days average)
                                                                                                           1000
1000

                                                                                                            500
 500

   0                                                                                                          0
       May 1, 20   Aug 1, 20       Nov 1, 20       Feb 1, 21   May 1, 21     Aug 1, 21   Nov 1, 21                May 1, 20   Aug 1, 20       Nov 1, 20     Feb 1, 21   May 1, 21   Aug 1, 21   Nov 1, 21

60K
           Percent Positive (7 day average)                                                                80K
                                                                 New Tests                       14.0%
                                                                                                           70K
40K                                                                                                        60K          Percent Positive (7 day average)                                                18.9%

                                                                                                           50K
                                                                                                                                                                                    New Tests
                                                                                                           40K
20K                                                                                                        30K
                                                                                                           20K
                                                                                                           10K
 0K
       May 1, 20   Aug 1, 20       Nov 1, 20       Feb 1, 21   May 1, 21     Aug 1, 21   Nov 1, 21                May 1, 20   Aug 1, 20       Nov 1, 20     Feb 1, 21   May 1, 21   Aug 1, 21   Nov 1, 21

   0                                                                                                          0

               Mobility retails and recreational                                                            -50
                                                                                                                        Mobility retails and recreational
 -50
                                                                                                           -100
 400                                                                                                        400                                                                                             425

 300                                                                                                 278                      Hospitalizations / 1M
                    Hospitalizations / 1M
 200                                                                                                        200
 100
                                                                                                              0
       May 1, 20    Aug 1, 20      Nov 1, 20       Feb 1, 21   May 1, 21     Aug 1, 21   Nov 1, 21                May 1, 20    Aug 1, 20      Nov 1, 20     Feb 1, 21   May 1, 21   Aug 1, 21   Nov 1, 21

                                                                                                                                                                                                            5
State Comparisons: Ohio and Indiana
Ohio Confirmed New Cases / 1M (7 days average)                                                             Indiana Confirmed New Cases / 1M (7 days average)

                                                                                                           1000
1000

                                                                                                            500
 500

   0                                                                                                          0
       May 1, 20   Aug 1, 20       Nov 1, 20       Feb 1, 21   May 1, 21     Aug 1, 21   Nov 1, 21                May 1, 20   Aug 1, 20       Nov 1, 20     Feb 1, 21   May 1, 21   Aug 1, 21   Nov 1, 21

                                                                                                           60K
60K
           Percent Positive (7 day average)                      New Tests
                                                                                                                        Percent Positive (7 day average)
                                                                                                                                                                                                        14.4%
                                                                                                           40K
40K                                                                                              14.1%
                                                                                                                                                                                    New Tests

20K                                                                                                        20K

 0K                                                                                                         0K
       May 1, 20   Aug 1, 20       Nov 1, 20       Feb 1, 21   May 1, 21     Aug 1, 21   Nov 1, 21                May 1, 20   Aug 1, 20       Nov 1, 20     Feb 1, 21   May 1, 21   Aug 1, 21   Nov 1, 21

   0                                                                                                          0

 -50           Mobility retails and recreational                                                                        Mobility retails and recreational
                                                                                                            -50

 400                                                                                                        400
                                                                                                     343                                                                                                    326
                    Hospitalizations / 1M                                                                                        Hospitalizations / 1M
 200                                                                                                        200

   0                                                                                                          0
       May 1, 20    Aug 1, 20      Nov 1, 20       Feb 1, 21   May 1, 21     Aug 1, 21   Nov 1, 21                May 1, 20    Aug 1, 20      Nov 1, 20     Feb 1, 21   May 1, 21   Aug 1, 21   Nov 1, 21

                                                                                                                                                                                                            6
State Comparisons: Illinois and Minnesota
Illinois Confirmed New Cases / 1M (7 days average)                                                          Minnesota Confirmed New Cases / 1M (7 days average)

1000                                                                                                        1000

 500                                                                                                         500

   0                                                                                                           0
       May 1, 20   Aug 1, 20       Nov 1, 20       Feb 1, 21   May 1, 21     Aug 1, 21   Nov 1, 21                 May 1, 20   Aug 1, 20       Nov 1, 20     Feb 1, 21   May 1, 21   Aug 1, 21   Nov 1, 21

                                                                                                            100K
                                                                                                                                                                                                       14.2%
           Percent Positive (7 day average)                      New Tests
100K                                                                                                                     Percent Positive (7 day average)

                                                                                                            50K                                                                      New Tests
50K

                                                                                                     6.0%
 0K                                                                                                          0K
       May 1, 20   Aug 1, 20       Nov 1, 20       Feb 1, 21   May 1, 21     Aug 1, 21   Nov 1, 21                 May 1, 20   Aug 1, 20       Nov 1, 20     Feb 1, 21   May 1, 21   Aug 1, 21   Nov 1, 21

   0                                                                                                           0

 -50
               Mobility retails and recreational                                                                         Mobility retails and recreational
                                                                                                             -50
                                                                                                            -100
 400
                                                                                                             300                                                                                             276
 300                                                                                                                           Hospitalizations / 1M
                    Hospitalizations / 1M                                                                    200
 200                                                                                                  193

 100                                                                                                         100
                                                                                                               0
       May 1, 20    Aug 1, 20      Nov 1, 20       Feb 1, 21   May 1, 21     Aug 1, 21   Nov 1, 21                 May 1, 20    Aug 1, 20      Nov 1, 20     Feb 1, 21   May 1, 21   Aug 1, 21   Nov 1, 21

                                                                                                                                                                                                             7
Key Messages: All COVID-19 Transmission Metrics Increasing
     Michigan continues above the High Transmission level
     •   All counties in Michigan are at High transmission level
     •   CDC recommends all individuals, regardless of vaccination status, should mask indoors

     Statewide positivity is 19.5% (last week: 18.9 %)
     •   The trend is increasing for 6 weeks
     •   Positivity is increasing in most MERC regions
     •   Positivity in all regions is above 15% and five regions are above 20%

     Case rate has decreased to 522.9 cases/million (last week: 556.9 cases/million):
     • Reported cases per million are delayed due to Thanksgiving holidays
     • Cases per million are decreasing among all age groups
     • In the past 7 days, 30-39-years-olds are experiencing the highest number of cases (876.3 daily cases), and highest case rate (722.3
       cases/mil)
     • Approximately 2.0% of people who were fully vaccinated have been reported with a breakthrough infection

     Cases and outbreaks saw decreases in the long-term care setting following the Thanksgiving Holiday

                          National                                                     Public Health            Other                Science
Special Populations                              Spread               Severity
                         Comparison                                                      Response             Indicators            Roundup
Michigan experiencing highest daily
      case count of pandemic

      Dashboard | CDC | MI Start Map for most recent data by
      reporting date

  •    Referrals declined over the holiday weekend

                          National                                  Public Health     Other      Science
Special Populations                             Spread   Severity                                          9
                         Comparison                                  Response       Indicators   Roundup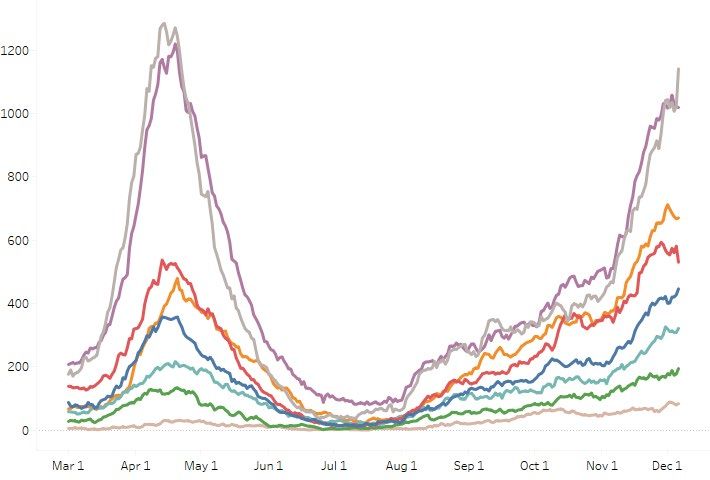
Michigan Lag-adjusted new COVID cases by onset date
 New confirmed cases by onset actual and adjusted as of December 6, 2021 (-2 days)

    8K
                              • The gray line is cases reported
              ADJUSTED
                                as of 12/6 by onset date.
              NEW_CASES
    7K                        • The blue line is the expected
                                adjustment for cases by onset
    6K                          date as data is backfilled
                              • The increasing delay between
    5K
                                onset of symptoms and date
    4K
                                of testing means that recent
                                case numbers underestimate
    3K                          the true number of cases

    2K

    1K

    0K
             Jun 4       Jun 19   Jul 4   Jul 19   Aug 3   Aug 18   Sep 2   Sep 17   Oct 2   Oct 17   Nov 1   Nov 16   Dec 1

                                                                                                                               10
Confirmed and probable case indicators Risk levels
Table Date: 12/06/2021 (7 days from date table was produced: 11/29/2021) Low A B C D E
Cases Positivity
National Public Health Other Science
Special Populations Spread Severity 11
Comparison Response Indicators RoundupTime Trends – Positivity, Case Rates, Hospitalizations, Deaths
Core COVID-19 indicators show burden remains high in Michigan
Daily Positive Test Rate Daily Inpatient Beds Occupied by COVID patients
Daily Case Rate Daily Deaths
National Public Health Other Science
Special Populations Spread Severity 12
Comparison Response Indicators RoundupTime Trends – Annual Comparison
Case rates are now at the same level as this time last year (by onset date).
Trend is experiencing lull over Thanksgiving holiday as was experienced last year
7- day rolling average of Rates 2020 vs 2021
800 2020 Holiday wave
Alpha (B.1.1.7) wave
700
600
500
400
Delta (B.1.617.2) wave
300
200
First wave
100
0
3/1 4/1 5/1 6/1 7/1 8/1 9/1 10/1 11/1 12/1 1/1 2/1
2020 2021
National Public Health Other Science
Special Populations Spread Severity 13
Comparison Response Indicators RoundupCase Rate Trends by Age Group
Daily new confirmed and probable cases per million by age group (7-day rolling average)
Increase Expected
0-9 30-39 60-69
10-19 40-49 70-79
1000 20-29 50-59 80+ 1000
800 800
600 600
400 400
200 200
0 0
3/1 5/1 7/1 9/1 11/1 1/1 3/1 5/1 7/1 9/1 11/1 7/1 8/1 9/1 10/1 11/1 12/1
• Case rate trends for most age groups were impacted by reporting over Thanksgiving holiday but are increasing again
• Case rates by onset date for all age groups are between 315 and 722 cases per million (through 11/29)
• Case counts and case rates are highest for 30-39-year-olds this week
Note: Case information sourced from MDHHS and reflects date of onset of symptoms
Source: MDHHS – Michigan Disease Surveillance System
National Public Health Other Science
Special Populations Spread Severity 14
Comparison Response Indicators RoundupNumber of Cases and CaseRates by Age Group, data as of Dec 6
Daily new confirmed and probable cases per million by age group (7-day rolling average)
Age Average† Average† One Week
Group daily cases Daily Case % Change (Δ #)* • Trend numbers and comparisons are
Rate being impacted by longer backfill times –
0-9 550.7 477.7 -21% (-147) the data in this table are comparing the
two time points from the most recent data
10-19 705.9 562.5 -20% (-181)
file
20-29 772.0 559.6 -4% (-36)
• Average daily number of cases (876.3) and
30-39 876.3 722.3 -6% (-53) average daily case rate (722.3 case/mil) are
40-49 702.7 595.8 -14% (-111) highest for those aged 30-39
50-59 702.4 520.2 -6% (-47) • Case rates over the last week have
60-69 524.7 411.3 -9% (-53) decreased due to decline in testing and
reporting over the Thanksgiving holiday. It is
70-79 242.3 316.0 -13% (-37)
anticipated that case rates will increase in
80+ 133.7 322.8 -13% (-20) next week.
Total¶ 5228.1 522.9 -11% (-685.9)
† Rolling 7-day average; ¶ Total may not reflect state due to missing age data
Note: Case information sourced from MDHHS and reflects date of onset of symptoms
Source: MDHHS – Michigan Disease Surveillance System
National Public Health Other Science
Special Populations Spread Severity 15
Comparison Response Indicators RoundupOverview of metrics for individuals < 12 and
Case Rates by Reported Racial and Ethnic Group
           Daily new confirmed and probable cases per million                                                           Daily new confirmed and probable cases per
           (7 day rolling average) by race category                                                                     million (7 day rolling average) by ethnicity category
                           American Indian/Alaska Native                   Black/African American                                   Hispanic or Latino       Not Hispanic or Latino
             500           Asian/Pacific Islander                          White
                                                                                                                        500                              Race              Case Rate
                            Race                      Case Rate

                            American Indian/          341.4                                                                                              Hispanic/Latino   341.5
             400            Alaskan Native                                                                              400                              Non-Hispanic      318.6
                            Asian/Pacific Islander    173.1

             300            Black/African American    246.7
                                                                                                                        300
                            White                     357.5

             200                                                                                                        200

             100                                                                                                        100

                 0                                                                                                        0
                     7/1               8/1               9/1              10/1               11/1            12/1             7/1           8/1            9/1             10/1        11/1     12/1

     Updates since last week:
     •    Cases per million are decreasing for most reported racial and ethnic groups, but the delay in reporting is impacting trend analysis
     •    The high number of cases with missing race/ethnicity data, and those multiracial or other are also impacting the case rates shown here
     •    In the past 30 days, 28% (↑1%) of race data and 38% (↑1%) ethnicity data was either missing or reported as unknown
     Note: Case information sourced from MDHHS and reflects date of death of confirmed and probable cases.
     Source: MDHHS – Michigan Disease Surveillance System

                                      National                                                                                      Public Health                    Other                Science
Special Populations                                                          Spread                          Severity                                                                               17
                                     Comparison                                                                                      Response                    Indicators              Roundup
Identified COVID-19 Cases Caused by Variants of Concern (VOC) in
US and Michigan
SARS-CoV-2 Variants Circulating in the Variants of Concern in Michigan, Dec 6
United States, Nov 21 – Nov 27 (NOWCAST)
• CDC has reclassified other VOCs
as variants being monitored
• Variants are downgraded when
there has been a significant and
sustained reduction in
Currently, CDC is not yet prevalence, or variant no longer
reporting prevalence of poses significant risk to public
AY.4.2 (i.e., Delta plus) health
• Currently, only Delta (B.1.617.2)
remains a VOC
• Information on Omicron in
Science Round Up
395 cases in Wayne attributed to Detroit
Variant MI Reported Cases¶ # of Counties MDHHS VOC Sequenced Prev.
Data last updated Dec 6, 2021 B.1.617.2 (delta) 17,240 83 100%
Source: MDSS
National Public Health Other Science
Special Populations Spread Severity
Comparison Response Indicators RoundupK-12 school clusters and outbreaks, recent and ongoing, week ending Dec 2
Number of reported outbreaks/clusters decreased since last week (627 to 557), with decreases in Pre K-Elementary (343 to 323). Declines in
Middle/Jr High (142 to 115), High Schools decreased (141 to 119) and Administration (1 to 0).
Number of Range of cases
Region Number of reported cases, # # Ongoing - Excluding New # New outbreaks per outbreak
Region 1 1,576 16 116 2-71
Region 2n 402 48 58 3-44
Region 2s 528 19 48 3-44
Region 3 3,014 58 156 2-92
Region 5 192 19 32 3-21
Region 6 637 49 97 3-50
Region 7 231 6 19 2-45
Region 8 604 0 31 4-51
Total 7,184 215 557 2-92
Number of Range of cases
Grade level Number of reported cases, # # Ongoing - Excluding New # New outbreaks per outbreak
Pre-school - elem. 3,031 140 323 2-56
Jr. high/middle school 1,601 36 115 2-71
High school 2,552 39 119 3-92
Administrative 00 0 4
Total 7,184 215 557 2-88
Many factors, including the lack of ability to conduct effective contact tracing in certain settings, may result in significant underreporting of outbreaks. This chart does not provide a complete picture
of outbreaks in Michigan and the absence of identified outbreaks in a particular setting in no way provides evidence that, in fact, that setting is not having outbreaks.
NOTE (10/4): MDHHS adopted the new CSTE school cluster and outbreak definition which impacts how transmissions within school-sponsored settings are reported to the health department
Source: LHD Weekly Sitreps
National Public Health Other Science
Special Populations Spread Severity 19
Comparison Response Indicators RoundupLong term care facility focus
National Public Health Other Science
Special Populations Spread Severity 20
Comparison Response Indicators RoundupReported Outbreaks within Long Term Care Facilities: Adult Foster Care,
Homes for the Aged, and Skilled Nursing Cases
Number of SNFs with 3 or more Confirmed Cases
Number of AFC/HFAs with 3 or more Confirmed Cases
70 70
60 60
Number of Facilities
50
Number of Facilities
50
40 40
30 30
20 20
10 10
0 0
3/24 4/24 5/24 6/24 7/24 8/24 9/24 10/24 11/24 3/26 4/26 5/26 6/26 7/26 8/26 9/26 10/26 11/26
• The number of Long-Term Care Facilities reporting 3 or more cases within a single reporting period has decreased 38 from a peak of 62 for
Skilled Nursing Facilities, and 24 from 30 for AFC/HFA facilities in past week
• These decreases coincide with statewide decreases that have occurred in case reporting over the Thanksgiving holiday
COVID-19 outbreaks within Long-Term Care Facilities are defined as three or more cases with an epidemiological linkage by place and time indicating a shared exposure outside of a household
(https://www.michigan.gov/coronavirus/0,9753,7-406-98163_98173_102057---,00.html and https://www.michigan.gov/coronavirus/0,9753,7-406-98163_98173-526911--,00.html)
The data is from w eekly reporting by facilities w ith bed occupancy of at least 13 beds.
National Public Health Other Science
Special Populations Spread Severity 21
Comparison Response Indicators RoundupReported Cases within Long Term Care Facilities: Adult Foster Care, Homes
for the Aged, and Skilled Nursing Cases for Residents and Staff
STATE OF MICHIGAN WEEKLY TOTAL CONFIRMED COVID-19 CASES IN STATE OF MICHIGAN WEEKLY TOTAL CONFIRMED COVID-19 CASES IN
AFC/HFA RESIDENTS AND STAFF SNF RESIDENTS AND STAFF
03/24/2021 TO 12/01/2021 03/26/2021 TO 12/03/2021
600 600
500 500
Number of Cases
Number of Cases
400 400
300 300
200 200
100 100
0 0
3/24 4/23 5/23 6/22 7/22 8/21 9/20 10/20 11/19 3/26 4/26 5/26 6/26 7/26 8/26 9/26 10/26 11/26
Weekly Total Confirmed Cases Resident Weekly Total Confirm Cases Staff Weekly Total Confirmed Cases Resident Weekly Total Confirm Cases Staff
• In the past week, the number of reported cases have plateaued or deceased in AFC/HFA/SNF, however, these decreases may be attributed to
decreased reporting over the Thanksgiving holiday
• Case counts in LTCF have reverted to more staff case count than residents case count
The data is from w eekly reporting by facilities w ith bed occupancy of at least 13 beds.
National Public Health Other Science
Special Populations Spread Severity 22
Comparison Response Indicators Roundup• Michigan’s LTC Visitation
Guidance recently update to
align with new standards
from CMS
• Concept is that if core
principles of infection control
are met (next slide), the risk
of COVID-19 transmission
as a result of visitation is
low.
• Visitation should be permitted at all times
• Visitors and residents should wear masks
• MDHHS strongly recommends testing anyone entering the building, including
visitors
https://www.michigan.gov/coronavirus/0,9753,7-406-98178_100722---,00.html
National Public Health Other Science
Special Populations Spread Severity
Comparison Response Indicators RoundupCore Principles of COVID-19 Infection Prevention
https://www.cms.gov/files/document/qso-20-39-nh-revised.pdf
Visitors who have a positive viral test for COVID-19, symptoms of COVID-19, or currently meet the criteria
for quarantine, should not enter the facility. Facilities should screen all who enter for these visitation
exclusions
Face covering or mask (covering mouth and nose) and physical distancing at least six feet between people, in
accordance with CDC guidance
Hand hygiene (use of alcohol-based hand rub is preferred)
Instructional signage throughout the facility and proper visitor education on COVID19 signs and symptoms,
infection control precautions
Cleaning and disinfecting high -frequency touched surfaces in the facility often, and designated visitation areas
after each visit
Appropriate staff use of Personal Protective Equipment (PPE)
Effective cohorting of residents
Resident and staff testing conducted as required
National Public Health Other Science
Special Populations Spread Severity
Comparison Response Indicators Roundup, Nursing Homes/Skilled Nursing Facilities
https://data.cms.gov/covid-19/covid-19-nursing-home-data
National Public Health Other Science
Special Populations Spread Severity
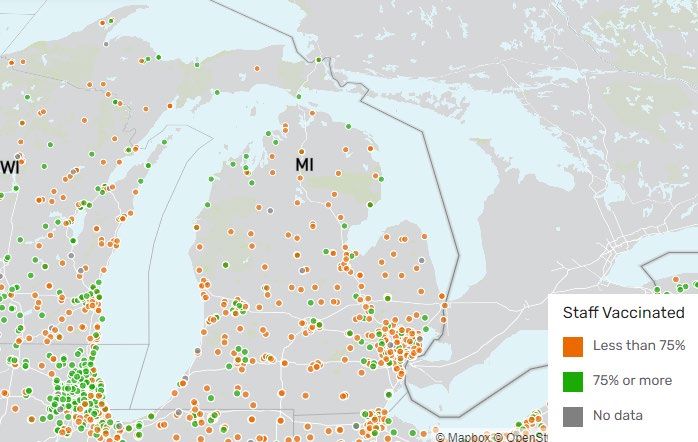
Comparison Response Indicators RoundupMichigan Nursing Homes/Skilled Nursing Facilities with more or less
than 75% of Staff Vaccinated
Data for individual facilities
available through interact map
at Centers for Medicaid and
Medicare Services
https://data.cms.gov/covid-19/covid-19-nursing-home-data
National Public Health Other Science
Special Populations Spread Severity
Comparison Response Indicators Roundup, Nursing Homes/Skilled Nursing Facilities
https://data.cms.gov/covid-19/covid-19-nursing-home-data
National Public Health Other Science
Special Populations Spread Severity
Comparison Response Indicators RoundupMichigan-specific trend in nursing/skilled
nursing facility staff vaccination coverage
https://www.cdc.gov/nhsn/covid19/ltc-vaccination-dashboard.html
National Public Health Other Science
Special Populations Spread Severity
Comparison Response Indicators RoundupNursing Home/Skilled Nursing Facility COVID-19 Trend Summary
New guidance from CMS discusses how visitation can be safe when infection prevention
standards are followed correctly and consistently
MDHHS strongly recommends those entering nursing home test negative before
visiting
Michigan nursing homes/skilled nursing facilities are seeing increases in COVID -19 cases,
outbreaks, and deaths
Increases in staff cases have been identified prior to increases in cases among residents
Michigan nursing home staff have low vaccination coverage (63%) compared nationally, which
lends to increased transmission and introduction of SARS-CoV-2 within vulnerable populations
Trends in staff vaccination coverage are not rapidly changing
Michigan staff nursing home vaccination coverage ranks 49th of 53 U.S. states and territories
National Public Health Other Science
Special Populations Spread Severity
Comparison Response Indicators RoundupUpdate on breakthrough
cases
National Public Health Other Science
Special Populations Spread Severity
Comparison Response Indicators Roundup`
Potential COVID-19 Vaccination Breakthrough Cases
Michigan part of CDC’s nationwide investigation (COVID-19 Vaccine Effectiveness | CDC)
Cumulative Michigan Data (1/1/21 through 11/19/21):
• 104,081 cases met criteria based on a positive test 14 or more days after being fully vaccinated
• Approximately 2% of people who were fully vaccinated met this case definition
• Includes 1,170 deaths (1,004 in persons ages 65 years or older)
• 2,370 cases were hospitalized
COVID-19 Vaccines Work
• Research provides evidence that COVID-19 vaccines are effective at preventing COVID-19.
• COVID-19 vaccination helps protect adults and children ages 5 years and older from getting sick or severely ill with
COVID-19 and helps protect those around them.
• To receive the most protection, adults and children ages 5 years and older should receive all recommended doses of a
COVID-19 vaccine.
• Some people who are fully vaccinated against COVID-19 will still get sick because no vaccine is 100% effective.
Experts continue to monitor and evaluate how often this occurs, how severe their illness is, and how likely a vaccinated
person is to spread COVID-19 to others.
National Public Health Other Science
Special Populations Spread Severity
Comparison Response Indicators RoundupCumulative COVID-19 Cases by Vaccination Status, Michigan, Jan 15 – Nov 19
Fully Vaccinated People (5,107,217)
Cases Hospitalization Deaths
Percent of Cases In People Not Percent of Hospitalizations In People Percent of Deaths In People Not
Fully Vaccinated Not Fully Vaccinated Fully Vaccinated
(630,878 / 734,959) (15,907 / 18,277) (7,404 / 8,574)
85.8% 87.0% 86.4%
630,878 15,907 7,404
Total Cases Not Fully Vaccinated Total Hospitalized Not Fully Vaccinated Total Deaths Not Fully Vaccinated
Total Breakthrough Cases Total Breakthrough Hospitalizations Total Breakthrough Deaths
104,081 2,370 1,170
2.038% 0.046% 0.023%
Percent of Fully Vaccinated People who Percent of Fully Vaccinated People Who Were Percent of Fully Vaccinated People Who Died of
Developed COVID-19 (104,081 / 5,107,217) Hospitalized for COVID-19 (2,370 / 5,107,217) COVID-19 (1,170 / 5,107,217)
14.2% 13.0% 13.6%
Percent of Cases Who Were Fully Vaccinated Percent of Hospitalizations Who Were Fully Percent of Deaths Who Were Fully Vaccinated
(104,081 / 734,959) Vaccinated (2,370 / 18,277) (1,170 / 8,574)
Total Cases: 734,959 Total Hospitalizations: 18,277 Total Deaths: 8,574
Michigan Disease Surveillance System may underestimate the frequency of COVID-19 hospitalizations:
- Case investigation and follow-up is more difficult for individuals who get hospitalized (e.g., they are too ill to speak to investigators, don’t answer their phone, or otherwise).
- These hospitalizations include individuals who are hospitalized for issues other than COVID19 (the same as breakthrough COVID-19).
- Individuals who get hospitalization will lag after infection and may occur after case investigation.
National Public Health Other Science
Special Populations Spread Severity
Comparison Response Indicators RoundupNational Age-Standardized Rates of COVID-19 Cases and Deaths by `
Vaccination Status
Footnotes: Incidence rates were age-standardized using the 2000 U.S. Census standard population; and rates are not adjusted for time since vaccination, underlying conditions, or other demographic factors
besides age. | Incidence rate ratios for the past one month were calculated by dividing the average weekly incidence rates among unvaccinated people by that among fully vaccinated people.
National Public Health Other Science
Special Populations Spread Severity
Comparison Response Indicators RoundupMichigan Age-Standardized Rates of COVID-19 Cases and Deaths by `
Vaccination Status
In September, unvaccinated persons had:
4.4 X AND 9.3 X
Risk of Testing Positive for COVID-19 Risk of Dying from COVID-19
compared to fully vaccinated persons
Footnotes: Incidence rates were age-standardized using the 2000 U.S. Census standard population; and rates are not adjusted for time since vaccination, underlying conditions, or other demographic factors
besides age. Incidence rate ratios for the past one month were calculated by dividing the average weekly incidence rates among unvaccinated people by that among fully vaccinated people.
National Public Health Other Science
Special Populations Spread Severity
Comparison Response Indicators RoundupRisk of becoming ill or dying much higher in unvaccinated individuals
Age-Adjusted Case and Death Rates per 100,000 People
In September 2021: by Vaccination Status, September 2021
Unvaccinated persons had 4.4 times the risk of
testing positive for COVID-19 compared to fully
vaccinated persons
• 436.1 cases per 100,000 unvaccinated
persons compared to 99.8 cases per
100,000 fully vaccinated persons
Unvaccinated persons had 9.3 times the risk of
dying from COVID-19 compared to fully
vaccinated persons
• 6.2 deaths per 100,000 unvaccinated
persons compared to 0.7 deaths per
100,000 fully vaccinated persons
Footnotes: Incidence rates were age-standardized using the 2000 U.S. Census standard population; and rates are not adjusted for time since vaccination, underlying conditions, or other demographic factors
besides age. Incidence rate ratios for the past one month were calculated by dividing the average weekly incidence rates among unvaccinated people by that among fully vaccinated people.
National Public Health Other Science
Special Populations Spread Severity
Comparison Response Indicators RoundupKey Messages: Healthcare Capacity and COVID Severity
Emergency Department visits, Hospital Admissions, and Hospital Census for COVID are mostly increasing
10.6% of ED visits are for COVID diagnosis (up from 10.4 % last week)
Hospital admissions for most age groups are decreasing over the past 3 days
Hospital census has increased 7% since last week (vs. 13% increase week prior)
The current wave’s hospitalizations is highest to date since the beginning of the pandemic
Most regions have increasing trends in hospital census this week
Four regions (1, 2N, 2S, 3, 6) now have greater than 400/Million population hospitalized; Region 2N more than
500/Million
Overall, volume of COVID-19 patients in intensive care has increased 10% (vs. 8% increase last week)
ICU census now exceeds the spring 2021 peak
Death rate is 8.5 daily deaths/million residents over last 7 days (Last week: 6.8 deaths/million)
Trends for daily average deaths are increasing for most reported racial and ethnic groups
In the past week, Whites have the highest death rate (6.9 deaths/million)
In the past 30 days, the proportion of deaths among those over 60 is steady
National Public Health Other Science
Special Populations Spread Severity
Comparison Response Indicators RoundupMichigan Trends in Emergency Department (ED) Visits for
Diagnosed COVID-19
10.6%
• Trends for ED visits have increased to 10.6% since last week (up from 10.4% last week, but down from 11% on 11/29), and are near Alpha surge
high of 11.3%
• Over past week, those 50-64 years saw highest number of avg. daily ED CLI visits (14.6%), but those between 40+ all above state average
Source: https://covid.cdc.gov/covid-data-tracker/#ed-visits; data extracted on 10/18/2021
National Public Health Other Science
Special Populations Spread Severity
Comparison Response Indicators RoundupAverage Hospital Admissions Are Increasing for all Age Groups
• Trends for daily average hospital admissions have increased 7% since last week (vs. 2% increase prior week)
• Nearly all age groups saw increases this week with largest increases in those between 70 and 79 years (23%, +10)
• More than 80 daily hospital admissions was seen for each of the age groups of 50-59, 60-69, 70-79, and 80+
Source: CHECC & EM Resource
National Public Health Other Science
Special Populations Spread Severity 38
Comparison Response Indicators RoundupAverage Hospital Admissions by Age Groups
• Trends for daily average hospital admissions have increased 7% since last week (vs. 2% increase prior week)
• Nearly all age groups saw increases this week with largest increases in those between 70 and 79 years (23%, +10)
• More than 80 daily hospital admissions was seen for each of the age groups of 50-59, 60-69, 70-79, and 80+
Source: CHECC & EM Resource
National Public Health Other Science
Special Populations Spread Severity 39
Comparison Response Indicators RoundupHospital Admissions and Admission Rates by Age Group
Daily new hospital admission per million by age group (7 -day rolling average)
Age Average† daily Average† Daily One Week • Through Dec 6, there were an average of 520.4
Group number of hospital Hospital % Change (Δ #) hospital admissions per day due to COVID-19; an
admissions Admission Rate* increase from last week (+7%, +34 admission)
0-11 8.1 5.9 +0% (+0) • Most age groups saw modest increases this week
12-17 3.1 4.2 -19% (-1) • The largest one-week increases were among those
18-19 2.6 9.7 +50% (+1) 70-79 (+17, +19%)
20-29 21.0 15.2 +11% (+2) • Average daily hospital admission count (115 hospital
30-39 39.0 32.1 +21% (+7) admissions per day) are highest among those 60-69
40-49 44.9 38.0 -13% (-7) • Average daily hospital admission rate (198.0 hospital
50-59 88.6 65.6 +10% (+8) admissions/million) are highest for those aged 80+
60-69 115.3 90.4 +5% (+6) • More than 80 daily hospital admissions were seen for
those aged 50-59, 60-69, 70-79, and 80+
70-79 107.1 139.7 +19% (+17)
80+ 82.0 198.0 +0% (+0)
Total¶ 520.4 52.1 +7% (+34)
Note: for some age groups, small changes in number of
hospitalization admissions can cause large change in
* Rate per 1 million residents; † Rolling 7-day average; ¶ Total may not reflect state due to missing age data
Note: Hospital Admission data reflects date data was submitted One Week Percent Change
Source: CHECC and EM Resource
National Public Health Other Science
Special Populations Spread Severity 40
Comparison Response Indicators RoundupStatewide Hospitalization Trends: Total COVID+ Census
The COVID+ census in hospitals has
Hospitalization Trends 3/1/2021 – 12/6/2021
Confirmed Positive & Persons Under Investigation (PUI) increased by 4% in the past week
(previous week was 13% growth).
The current wave’s hospitalizations
are now at the highest point since the
beginning of the pandemic.
Confirmed Positive
Hospitalized COVID Positive Long Term
Trend (beginning March 2020)
PUI
41Statewide Hospitalization Trends: Regional COVID+ Census
Hospitalization Trends 3/1/2021 – 12/6/2021 The COVID+ hospital census increased across all
Confirmed Positive by Region regions except Region 2S and 3. The fastest growth
was in Regions 2N, 7 and 8.
Region 1
Region 2N Regions 1, 2N, 2S, 3 and 6 now have greater than
Region 2S 400/Million population hospitalized and Region 2N
Region 3
Region 5 is now >500/Million population hospitalized.
Region 6
Region 7 Region COVID+ Hospitalizations COVID+
Region 8 (% Δ from last week) Hospitalizations /
MM
Region 1 446 (8%) 412/M
Region 2N 1141 (14%) 515/M
Region 2S 1019 (-1%) 457/M
Region 3 530 (-10%) 467/M
Region 5 321 (7%) 337/M
Region 6 670 (1%) 457/M
Region 7 194 (15%) 388/M
Region 8 83 (19%) 267/M
42Statewide Hospitalization Trends: ICU COVID+ Census
The census of COVID+ patients in ICUs has increased 10%
Hospitalization Trends 3/1/2021 – 12/6/2021 from last week. ICU census now exceeds the spring 2021
Confirmed Positive in ICUs peak.
All Regions except 2N and 8 have adult ICU occupancy
greater than 85% with Regions 1, 3 and 7 above 90%
occupancy. Regions 1, 5, 6, 7 and 8 have >40% of adult ICU
beds occupied with COVID+ patients while Regions 6 and 7
have >55% of adult ICU beds used for COVID+ patients.
Region Adult COVID+ in Adult ICU % of Adult ICU
ICU (% Δ from Occupancy beds COVID+
last week)
Region 1 100 (0%) 94% 48%
Region 2N 199 (20%) 82% 34%
Region 2S 220 (10%) 86% 31%
Confirmed Region 3 126 (-2%) 93% 36%
Positive in ICU
Region 5 66 (8%) 89% 43%
Region 6 176 (12%) 87% 57%
Region 7 81 (29%) 90% 56%
Region 8 25 (-11%) 79% 40%
43Statewide Hospitalization Trends: Pediatric COVID+ Census
Hospitalization Trends 1/1/2021 – 12/6/2021
Pediatric Hospitalizations, Confirmed + PUI
44Multisystem Inflammatory Syndrome in Children (MIS-C)
Michigan Surveillance
• Higher community transmissions is followed by
higher incidence of MIS-C cases
• 187 cases identified in Michigan
• More than 60% of those children are elementary
and pre-school aged
• Black/African American children are
disproportionately impacted
• 70.6% children with MIS-C are treated in the ICU
Source: MDHHS and MIS-C Data and Reporting
National Public Health Other Science
Special Populations Spread Severity
Comparison Response Indicators RoundupAverage and total new deaths, by age group
Daily COVID-19 deaths in confirmed and probable cases per million by age group (7 day rolling average)
200
0-19 40-49 70-79
20-29 50-59 80+
30-39 60-69 Total
150
100
50
0
3/1 4/1 5/1 6/1 7/1 8/1 9/1 10/1 11/1 12/1 1/1 2/1 3/1 4/1 5/1 6/1 7/1 8/1 9/1 10/1 11/1 12/1
Lag 0-19 20-29 30-39 40-49 50-59 60-69 70-79 80+ Statewide
• Through 12/6, the 7-day avg. death rate is more than 70 daily deaths per million people for those over the age of 80
• COVID-19 death rates for those 80+ now are higher than the death rates during the Alpha (B.1.1.7) surge but not as high
as the first two surges
Note: Death information sourced from MDHHS and reflects date of death of confirmed and probable cases.
Source: MDHHS – Michigan Disease Surveillance System (MDSS)
National Public Health Other Science
Special Populations Spread Severity 46
Comparison Response Indicators RoundupAverage and total new deaths, by age group
Daily COVID-19 deaths in confirmed and probable Total COVID -19 deaths in confirmed and probable
cases per million by age group (7 day rolling average) cases by age group (past 30 days, ending 11/29/2021)
75
0-19 40-49 70-79 • 20% of deaths below age sixty
20-29 50-59 80+
60 30-39 60-69 Total 755
45 507
421
30
218
15
122
49
6 13
0
7/1 8/1 9/1 10/1 11/1 12/1 0-19 20-29 30-39 40-49 50-59 60-69 70-79 80+
• Through 12/6, the 7-day avg. death rate is more than 70 daily deaths per million people for those over the age of 80
• In the past 30 days, the proportion of deaths among those over 60 is steady
Note: Death information sourced from MDHHS and reflects date of death of confirmed and probable cases.
Source: MDHHS – Michigan Disease Surveillance System (MDSS)
National Public Health Other Science
Special Populations Spread Severity 47
Comparison Response Indicators Roundup30-day rolling average daily deaths per million people by race and
ethnicity
Average daily deaths per million people by race Average daily deaths per million people by
American Indian/Alaska Native Black/African American ethnicity
Asian/Pacific Islander White
10 Hispanic or Latino Not Hispanic or Latino
10
8
8
6 6
4 4
2 2
0 0
7/1 8/1 9/1 10/1 11/1 12/1 7/1 8/1 9/1 10/1 11/1 12/1
• Deaths are lagging indicator of other metrics
• Overall trends for daily average deaths are increasing for most reported races and ethnicities
• Currently, Whites have the highest death rate (6.9 deaths/million)
Note: Death information sourced from MDHHS and reflects date of death of confirmed and probable cases.
Source: MDHHS – Michigan Disease Surveillance System
National Public Health Other Science
Special Populations Spread Severity 48
Comparison Response Indicators RoundupExcess Deaths From All Causes in Michigan
• Excess deaths can occur from COVID-19 illness or indirectly when hospital capacity is overwhelmed
• Each of the COVID-19 case waves has resulted in a surge in excess deaths from all causes
• Non-covid deaths are higher than average expected number of deaths
Source: CDC Excess Deaths Associated with COVID-19: Provisional Death Counts for COVID-19
National Public Health Other Science
Special Populations Spread Severity 49
Comparison Response Indicators Roundup• `
Key Messages: Public Health Response
COVID-19 Vaccination
• 6,735 first doses administered each day (7-day rolling average); administrations declined slightly over Thanksgiving holiday
• Over 5.5 million people (55.3% of the population) in the state are fully vaccinated
COVID-19 Boosters
• Over 1.6 million people have received an additional/booster dose in Michigan
• More than 50% of Michiganders over the age of 65+ have been administered a booster dose
Pediatric Vaccination
• Interactive dashboard now includes pediatrics vaccination doses (live updates effective 11/5)
• 133,320 administrations in 5- to 11-year-olds as of 12/2
National Public Health Other Science
Special Populations Spread Severity
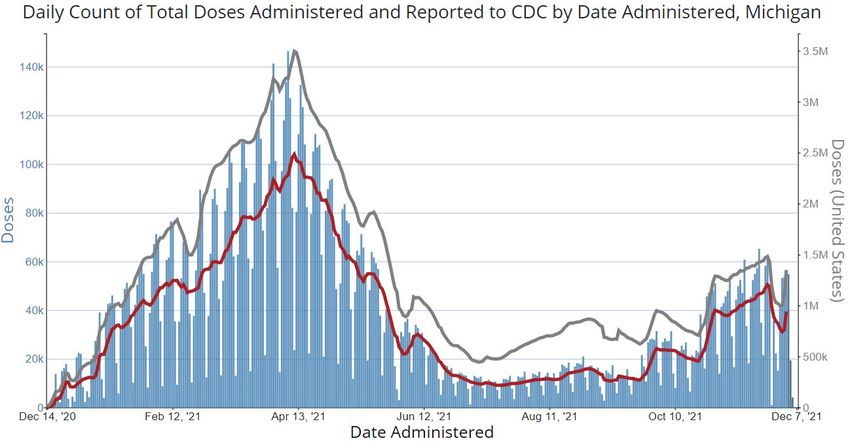
Comparison Response Indicators RoundupAverage daily doses administered increase (data through 12/7/2021)
16,853,470 doses delivered to providers and
13,083,499 doses administered*
MI 7-day rolling average ending December 3
• 42,033 total doses/day on average† (37,231 on 11/26)
• 6,735 first doses/day on average † (8,422 on 11/24)
Total primary series doses in month of November were
most frequently administered¶ by:
Pharmacies (251,478)
LHD (39,665), pediatrics (26,491), and hospitals (14,846)
Family practice (12,243) and FQHCs (9,306)
Third Doses
• 1,603,370 third doses administered as of 12/2
Source: *CDC COVID Data Tracker > Vaccinations in the US, † CDC COVID Data Tracker > Vaccination Trends; ¶ MCIR COVID-19 Vaccine Dashboard
National Public Health Other Science
Special Populations Spread Severity
Comparison Response Indicators RoundupOver 5.5 Million Michiganders fully vaccinated and 55.3% of total population fully
vaccinated
Vaccination Coverage in Michigan as of 12/6/21
Age Group % At Least % Fully Number Fully
5.5 million people in the state are fully
vaccinated* One Dose Vaccinated Vaccinated
85.8% of people aged 65 and older have Total Population 61.8% 55.3% 5,517,866
completed the series*
≥ 5 years 65.5% 58.6% 5,517,822
61.8% of total population initiated*
Race/Ethnicity¶ for those 5 years and older:
≥ 12 years 70.2% 63.7% 5,472,620
• Initiation coverage highest among those of ≥ 18 years 72.4% 65.7% 5,156,537
Non-Hispanic (NH) Asian, Native Hawaiian or
Pacific Islander Race (60.15%), then NH ≥ 65 years 93.4% 85.8% 1,515,455
American Indian (55.53%), NH White
(52.78%), NH Black or African American
Races (40.09%).
• Initiation is at 52.56% for those of Hispanic
ethnicity
• Completion follows the same pattern
• 12.11% data missing or unknown
Source: *CDC COVID Data Tracker > Vaccinations in the US, ¶ MCIR COVID-19 Vaccine Dashboard
National Public Health Other Science
Special Populations Spread Severity
Comparison Response Indicators RoundupSince numbers will be low to start, expect to see some data
suppression rules at first when looking at number vaccinated
for specific counties/demographic combinations
Data are refreshed Tuesdays
and Friday afternoons
133,320 initial dose
administrations in 5- to 11-
year-olds as of 12/02
30,112 second dose
administrations in 5- to 11-
year-olds as of 12/02Booster Administration Update Over 57% of fully vaccinated persons in Michigan
aged 65+ have received a booster dose
https://covid.cdc.gov/covid-data-tracker/#vaccinations
Now over 1.7 million
Michiganders with a
booster dose
Michigan is the 10th biggest state in population, but ranks 7th in terms of total COVID booster administrations
Over 1 in 3 fully vaccinated Michiganders age 18 and up have received a booster dose• `
Key Messages: Science Round Up
Omicron: A new variant identified
• 19 states and territories in the United States have reported identification of the omicron variant
• Vaccines, in combination with other mitigation measures like masking, and avoiding large indoor crowded settings, remain effective
public health measure to protect people from COVID-19, slow transmission, and reduce the likelihood of new variants emerging
• Non-pharmaceutical interventions (e.g., masking, testing, physical distancing, and quarantine and isolation) remain effective against
all variants of SARS-COV-2
• Despite the increased attention of Omicron, Delta continues to be the main variant circulating in the United States
National Public Health Other Science
Special Populations Spread Severity
Comparison Response Indicators RoundupOmicron – Update December 6, 2021
How easily does Omicron spread?
• The Omicron variant likely will spread more easily than the original SARS-
CoV-2 virus but how easily Omicron spreads compared to Delta remains
unknown
Will Omicron cause more severe illness?
• More data are needed to know if Omicron infections, and especially
reinfections and breakthrough infections in people who are fully vaccinated,
cause more severe illness or death than infection with other variants
Will vaccines work against Omicron?
• Current vaccines are expected to protect against severe illness,
hospitalizations, and deaths due to infection with the Omicron variant.
• Breakthrough infections in people who are fully vaccinated are likely to occur
• With other variants, like Delta, vaccines have remained effective at
preventing severe illness, hospitalizations, and death
• The recent emergence of Omicron further emphasizes the importance of
vaccination and boosters
− As of Dec 7, 2021, 19 states have reported identification of the Omicron variant
Will treatments work against Omicron?
• Scientists are working to determine how well existing treatments for COVID-
19 work
• Based on the changed genetic make-up of Omicron, some treatments are
likely to remain effective while others may be less effective
National Public Health Other Science
Special Populations Spread Severity
Comparison Response Indicators RoundupWe have the Tools to Fight Omicron
Vaccines, in combination with other mitigation measures like masking, and avoiding large indoor crowded settings, remain effective
public health measure to protect people from COVID-19, slow transmission, and reduce the likelihood of new variants emerging.
• COVID-19 vaccines are highly effective at preventing severe illness, hospitalizations, and death
• CDC recommends that everyone 5 years and older protect themselves from COVID-19 by getting fully vaccinated
• CDC recommends that everyone ages 18 years and older should get a booster shot
Masks offer protection against all variants
• CDC continues to recommend wearing a mask in public indoor settings in areas of substantial or high community transmission,
regardless of vaccination status
Tests can tell you if you are currently infected with COVID-19.
• Two types of tests are used to test for current infection: nucleic acid amplification tests (NAATs) and antigen tests
• NAAT and antigen tests can only tell you if you have a current infection.
• Additional tests would be needed to determine if your infection was caused by Omicron
• Self-tests can be used at home or anywhere, are easy to use, and produce rapid results. If your self-test has a positive result, stay
home or isolate for 10 days, wear a mask if you have contact with others, and call your healthcare provider. If you have any
questions about your self-test result, call your healthcare provider or public health department.
Until we know more about the risk of Omicron, it is important to use all tools available to protect yourself and others.
National Public Health Other Science
Special Populations Spread Severity
Comparison Response Indicators RoundupWhat can I need to do to protect my community from Omicron?
• Get vaccinated
• Get boosted
• The CDC updated its booster guidance on Monday, now advising that all adults ages 18 and up should get a booster 6
months after their initial mRNA series or 2 months after their Johnson & Johnson shot.
• Wear a mask
• Get Tested
• Stay Home When Sick
• Get prepared mentally to act more cautiously in Omicron proves to be more infectious, immune-evasive, or both.
• Follow the news & science – will be much cleared in 2-4 weeks.
National Public Health Other Science
Special Populations Spread Severity
Comparison Response Indicators Roundup`
Safer Ways to Celebrate Holidays
Holiday traditions are important for families and children.
There are several ways to enjoy holiday traditions and
protect your health. Many generations tend to gather to
celebrate holidays. Here are some ways to celebrate the
holidays more safely:
• The best way to minimize COVID-19 risk and keep your family and friends safer is to get vaccinated if you’re eligible.
• Get a booster shot
• If you are sick or have symptoms, don’t host or attend a gathering.
• Regardless of vaccination status, all those aged 2 or older, you should wear a mask in indoor public places in areas of substantial or high SARS-CoV-2
transmission and in crowded, poorly ventilated outdoor areas.
• Before a multihousehold gathering, consider taking a rapid antigen test, regardless of whether you’ve been in contact with someone with COVID-19;
if you test positive, stay home until you consult your provider and rule out any possibility of infecting others.
• Consider a setting where people can spread out and where there can be good ventilation.
• If you are traveling for a holiday event, follow domestic and international travel guidelines and public health recommendations.
• Practice healthy hygiene – e.g., proper respiratory etiquette, wash your hands frequently, and avoid touching your face.
• People who have a condition or are taking medications that weaken their immune system may not be fully protected even if they are fully vaccinated.
They should continue to take all precautions recommended for unvaccinated people, including wearing a well-fitted mask, until advised otherwise by their
healthcare provider.
• Visit the CDC COVID-19 Safer Ways to Celebrate Holidays and Travel Guidelines for more information on how to keep yourself and your loved ones safe
this holiday season.
Source: CDC Holiday CelebrationsYou can also read