QUEENSLAND AGTRENDS 2020-21 - FORECASTS AND TRENDS IN QUEENSLAND AGRICULTURAL, FISHERIES AND FORESTRY PRODUCTION
←
→
Page content transcription
If your browser does not render page correctly, please read the page content below
Queensland AgTrends 2020–21
Forecasts and trends in Queensland agricultural, fisheries and forestry production
DAF1291 11/20

Acknowledgements

The Department of Agriculture and Fisheries (DAF) acknowledges contributions to this report from:
• DAF researchers and industry experts
• the Queensland Government Statistician's Office
• the Australian Bureau of Agricultural and Resource Economics and Sciences
• the Australian Bureau of Statistics
• Meat & Livestock Australia
• the United States Department of Agriculture
• industry representatives from Avocados Australia, Canegrowers, Cotton Australia, Queensland Dairyfarmers’ Organisation, Growcom, Turf Queensland,
  Nursery & Garden Industry Queensland, the Flower Association of Queensland, the Australian Lot Feeders’ Association, the Australian Wool Production
  Forecasting Committee, Queensland Sugar Limited and the Housing Industry Association
• market commentators and industry media including ABC Rural, Queensland Country Life, Farmonline, Rabobank, IBISWorld, The Land and Beef Central.

Feedback

We welcome your feedback. Please send your comments and suggestions to us at info@daf.qld.gov.au or call 13 25 23.

Visit daf.qld.gov.au to view current and previous editions of AgTrends and AgTrends update or to view interactive data through our dashboard.

Interpreter

          If you need an interpreter to help you understand this document, call 13 25 23 or visit daf.qld.gov.au and search for ‘interpreter’.

© State of Queensland, 2020.

The Queensland Government supports and encourages the dissemination and exchange of its information. The copyright in this publication is licensed
under a Creative Commons Attribution 4.0 International (CC BY 4.0) licence.

Under this licence you are free, without having to seek our permission, to use this publication in accordance with the licence terms.

You must keep intact the copyright notice and attribute the State of Queensland as the source of the publication.

For more information on this licence, visit creativecommons.org/licenses/by/4.0.

The information contained herein is subject to change without notice. The Queensland Government shall not be liable for technical or other errors or
omissions contained herein. The reader/user accepts all risks and responsibility for losses, damages, costs and other consequences resulting directly or
indirectly from using this information.
Contents
      Summary......................................................................................................................................                                                                   1
      Agriculture resilient to disruption from COVID-19..........................................................................                                                                                     5
      Economic outlook......................................................................................................................... 6
          General economic conditions in Australia.......................................................................................                                                                             6
          Australia’s international trade prospects........................................................................................                                                                           6
      Climate outlook............................................................................................................................                                                                     7
      Primary industries estimates and forecasts.................................................................................. 8
      Volume of production index.......................................................................................................... 11
      Livestock disposals...................................................................................................................... 12
          Cattle and calves................................................................................................................................................................................ 12
          Poultry.................................................................................................................................................................................................. 13
          Pigs........................................................................................................................................................................................................ 13
          Sheep and lambs............................................................................................................................................................................... 14
          Goats.................................................................................................................................................................................................... 14
      Livestock products........................................................................................................................ 15
          Milk........................................................................................................................................................................................................ 15
          Eggs...................................................................................................................................................................................................... 15
          Wool...................................................................................................................................................................................................... 16
      Crops............................................................................................................................................ 17
          Horticulture crops......................................................................................................................... 17
          Fruit and nuts...................................................................................................................................................................................... 17
          Vegetables........................................................................................................................................................................................... 18
          Other vegetables ............................................................................................................................................................................... 19
          Lifestyle horticulture..................................................................................................................... 19
          Production nurseries......................................................................................................................................................................... 19
          Turf........................................................................................................................................................................................................ 19
          Cut flowers........................................................................................................................................................................................... 20
          Other crops.......................................................................................................................................................................................... 20
          Sugarcane............................................................................................................................................................................................ 20
          Cotton................................................................................................................................................................................................... 21
          Other major field crops.................................................................................................................. 22
          Peanuts ............................................................................................................................................................................................... 22
          Soybeans............................................................................................................................................................................................. 22
          Grains and pulses......................................................................................................................... 22
          Grain sorghum.................................................................................................................................................................................... 22
          Maize.................................................................................................................................................................................................... 23
          Wheat................................................................................................................................................................................................... 23
          Barley.................................................................................................................................................................................................... 23
          Chickpeas............................................................................................................................................................................................ 23
          Mung beans ........................................................................................................................................................................................ 24
      Fisheries....................................................................................................................................... 25
      Forestry........................................................................................................................................ 27
      Notes............................................................................................................................................ 28
      Definitions.................................................................................................................................... 28
      Acronyms..................................................................................................................................... 28

Queensland AgTrends 2020–21                                                                                                                                                                                                 i
Summary
The Queensland agriculture and food sector is a key foundation of the Queensland economy and the Australian economy.
Supporting it to diversify, add value and grow into the future is critical to our state’s economy and the success of our
regions. This publication provides an authoritative source of statistics, analyses and forecasts for Queensland’s agricultural,
fisheries and forestry production. The total value of Queensland’s primary industry commodities comprises two
components, which are reported separately—gross value of production (GVP) for unprocessed primary commodities,
and value of first-stage processing (value-added production).

2020 has been a year of unparalleled disruption. The various social, economic and labour market restrictions and
government support packages that were designed to limit the spread of COVID-19 and assist recovery have had
wide-ranging effects across the economy. The agriculture sector has seen disruption across supply chains and in labour
markets, and shifts in demand channels. Despite the challenges, the sector overall has been resilient, continuing to supply
consumers in Queensland, wider Australia and our international export destinations with an abundance of healthy,
nutritious and high-quality produce.

For 2020–21, the total value of Queensland’s primary industry commodities is forecast to be $18.4 billion, 1% less than
for 2019–20 and 4% less than the average for the past 5 years. This total comprises $14.5 billion GVP and $3.9 billion
value-added production.

The largest contributors to the total, by estimated GVP, are meat products (45%), horticulture (31%), sugar (8%) and cereal
products (8%), with output volumes growing on average by 5% per annum. However, a range of external factors—such as
exchange rates, commodity prices and weather conditions—may affect the actual values achieved. A summary of forecast
commodity performance is provided in Figure 1.

For the fourth consecutive year, the forecast total value has decreased from the previous year (see Figure 2), after one of
the1291_Fig1_Summary         2020–21
    worst droughts in over 100 years.

        Livestock                  Delivering
                                   Livestock                                      Lifestyle                Other field
                                  quality front             Horticulture         horticulture
      (cattle, poultry, pigs,       products                                                                 crops
     other livestock, sheep       line services              (fruit, nuts and
                                                                                 (nurseries, turf and
                                 (eggs, milk and wool)         vegetables)                                 (sugar, cotton and
           and lambs)                                                                cut flowers)             other crops)

     $6163m                        $480m                    $2982m               $1346m                   $1758m
       estimated GVP              estimated GVP             estimated GVP         estimated GVP            estimated GVP

       Delivering
     Cereal grains                  Fisheries                                                               Delivering
       quality front
                                                                                    Forestry               First-stage
                                                                                                           quality front
      (chickpeas, wheat,
       line  services             (commercial fishing       Aquaculture                                    processing
                                                                                                           line services
        sorghum, barley         and recreational fishing)
          and maize)

      $1119m                       $264m                    $140m                 $251m                   $3896      m
       estimated GVP              estimated GVP             estimated GVP         estimated GVP            estimated
                                                                                                            value added

   Summary of commodity performance (Source: AgTrends: October 2020)
Figure 1 Summary of forecast commodity performance for 2020–21

Queensland AgTrends 2020–21                                                                                                       1
GVP by year and industry
25 000
20 000
15 000
Value ($m)
10 000
5 000
0
08 09 10 11 12 13 14 15 16 17 18 19 20 21
07– 08– 09– 10– 11
–
12– 13– 14– 15– 16– 17– 18– 19– 20–
20 20 20 20 20 20 20 20 20 20 20 20 20 20
First-stage Forestry Fisheries Crops
processing and logging
Vegetables Livestock Livestock
Fruit products disposals
Figure 2 Industry performance, 2007–08 to 2020–21
The agriculture and food sector is diverse and produces a wide variety of high-quality food and fibre products. In 2018–19,
Queensland grew 94% of the nation’s sugarcane, had 50% of the meat cattle herd, and produced 26% of the nation’s cotton,
32% of fruit and nuts and 30% of vegetables.
Queensland’s vibrant and robust produce enjoys a well-earned global reputation as safe and nutritious. We are a
food-secure state, exporting 58% of all agricultural output. Over 50% of meat products, 16% of fruit and vegetables,
83% of sugar, 93% of grains and grain products, 74% of cotton and wool, and 47% of seafood products are exported.
In 2019–20, Queensland exported approximately $10 billion worth of agriculture and food products.1
By value, China is Queensland’s largest agricultural product export destination at 21.7%, followed by Japan at 19.7%,
the United States at 12.4% and South Korea at 12.2% (see Figure 3). Overall, they account for 66% of total exports.
Maintaining existing markets and diversifying into new markets will be key to ensuring resilience and growth in the sector.
1 ABS 2020, Exports from Queensland and Australia to all countries, by commodity, value, 2019–20p; Office of Economic and
Statistical Research 2020, Standard international trade classification 1 digit, food and live animals.
Queensland AgTrends 2020–21 2China
A$2.17b
Japan United States
A$1.97b A$1.24b
South Korea
Vietnam A$1.23b
A$0.58b
Indonesia
A$0.42b
Figure 3 Queensland’s major rural export destinations
Domestically, the agriculture sector supports retail and food service sectors and presents Queenslanders with an abundance
of healthy, nutritious and high-quality produce. Queensland agriculture plays an essential role in the everyday lives of
Queenslanders, who can enjoy ham off the bone from a pig produced in the Darling Downs, sizzling steak from cattle
produced at Taroom, succulent Gulf prawns, Lockyer Valley vegetables, juicy Bowen mangoes, Sunshine Coast pineapples
and watermelons from Chinchilla.
In 2018–19, Queensland’s primary industries directly contributed an estimated $8.52 billion on a value-added basis to the
state economy—this was 2.3% of the gross state product.2
In most rural and regional local government areas, over 25% of businesses are agriculture, fisheries and forestry businesses.
In line with this, the agriculture, forestry and fishing sector is a major regional employer, accounting for up to 25% of total
direct employment. Family and other Australian workers make up the majority of the workforce, with overseas workers used
substantially in the horticulture sector.
In 2018–19, there were approximately 41 000 farm businesses in Queensland (see Figure 4). These included on-farm
production, forestry and timber manufacturing, fisheries and food manufacturing. Most businesses involved in agriculture,
forestry and fishing are small businesses—56% have no employees apart from the business operators, and 40% have fewer
than 20 employees.
The role of this sector extends beyond the primary production of agricultural commodities. Primary industry commodities are
used in a range of manufacturing, retail and service industries. Gross value added for the agriculture and food supply chain in
Queensland for 2017–18 is estimated to be $25.7 billion. This makes up about 7% of the state’s economic output. In 2017–18,
there were approximately 334 000 people employed along the food and agribusiness supply chain, equating to approximately
13% of the total number of jobs in the state.3
2 ABS 2020, Australian national accounts: state accounts, 2018–19, cat. no. 5220.
3 AgTrends update, April 2020.
Queensland AgTrends 2020–21 3Support
Agriculture services Fisheries Forestry Total
Directly employed 74 677 3 717 1 085 621 80 101
Manufacturing jobs* 21 888 174 9 224 31 286
Direct businesses 35 373 3 297 1 139 781 40 590
Manufacturing businesses* 349 48 251 612
* Jobs have been included for first-round manufacturing only
Figure 4 Employment and businesses in agriculture and related industries, 2018–19
Sources:
ABS 2020, Counts of Australian businesses, including entries and exits, June 2015 to June 2019, cat. no. 8165.0.
ABS 2020, Labour force, Australia, detailed, quarterly, cat. no. 6291.0.
Queensland AgTrends 2020–21 4Agriculture resilient to disruption from COVID-19 The Queensland agriculture, fisheries and forestry sector has been resilient throughout the COVID-19 pandemic. Bulk commodity exports have continued largely unhindered, products have been diverted between markets, and the nursery sector has boomed due to an increase in demand for in-home gardening. Despite this, however, the sector has faced and will continue to face challenges arising from measures designed to limit the spread of COVID-19. The net effect of the COVID-19 pandemic on the 2020–21 GVP for Queensland’s primary industries is expected to be a decrease of $87 million at the farm gate. Fruit and vegetables, cut flowers, forestry and fisheries will be the most affected, with a total decrease of $179 million. However, more than half of this is expected to be offset by increased output in production nurseries. While the sector has been less disrupted than others in 2020–21, beyond this the pandemic will continue to affect agricultural supply chains—including international trade and on-farm labour supply—and consumer demand for agricultural products. Demand for most products will remain below pre-pandemic levels, as a result of lower incomes, decreased consumer confidence and higher unemployment. Consumer habits will normalise with more retail expenditure and a preference for staples and long-life products but lower expenditure on high-value products and restaurants. Agricultural trade is forecast to remain stable as bulk commodities are transported via shipping, which has been less disrupted than other forms of transport such as airfreight. The horticulture sector is highly exposed to changes in the labour market structure because of the labour intensity required for harvesting of crops. Labour effects will not be homogenous, with small to medium-sized producers more affected. Estimates from the Department of Agriculture and Fisheries (DAF) suggest that labour shortages may be up to 20% of total labour demand. This is supported by anecdotal evidence of plough-ins and reduced plantings across several key horticultural commodities. The fisheries sector relies heavily on tourism and airfreight, so has been more exposed to the impacts of COVID-19. Because of the loss of international markets and international freight, many commercial fishing businesses stopped fishing and exporting in 2019–20. The loss of international tourists to Queensland led to a significant fall in domestic seafood consumption, exacerbated by local market oversupply from almost all Queensland fisheries. Forestry output has been affected by the downturn in residential construction and a reduction in sales of softwood into domestic markets as well as constraints applied in the building sector for construction materials. Although Queensland’s building approvals have recovered to around the levels of early 2020, any growth is likely to be moderate, with significant uncertainty in the economic outlook for the forestry sector. The cut flower industry has also experienced significant losses. The pandemic led to reduced sales in 2019–20 and this trend is forecast to continue into 2020–21, as large events (including those in the usually profitable spring wedding season) are still in a hiatus. Queensland AgTrends 2020–21 5
Economic outlook
The uncertainty around the progression of the COVID-19 pandemic will continue to hamper economic recovery for many
countries. Trade contracted by close to 3.5% (year over year) in the first quarter of 2020–21, reflecting weak demand,
the collapse in cross-border tourism, and supply dislocations related to shutdowns (exacerbated in some cases by
trade restrictions).

Across the globe, 2020 is forecast to be a year of deep recession. Global growth is projected to be –4.4%. All major
economies, with the exception of China, are forecast to post negative gross domestic product (GDP) growth. There have,
however, been some positives, with the level of the recession downgraded 0.5 percentage points from the June 2020
World economic outlook forecast. This reflects better than anticipated second quarter GDP output in line with activity
improvements following relaxation of restrictions in some nations.

The International Monetary Fund expects that in 2021 global economic growth will recover to 5.2%. Growth is assumed
to be 3.9% in advanced economies and 6.0% in emerging and developing economies. Following contraction in 2020 and
recovery in 2021, the level of global GDP in 2021 is forecast to be 0.6% above that of 2019.

General economic conditions in Australia
In a global context, Australia is faring well through the pandemic. OECD data shows a fall in GDP for the second quarter of
2020 of 7% for Australia. This compares favourably with falls of 9% for the United States, 11% for the European Union and
25% for India. Assuming continued activity restrictions, Australia’s GDP will grow modestly over the second half of 2020.
Expected growth is driven by household consumption, as activity in much of the rest of the economy continues to contract.

Employment is expected to decline further over the second half of the year, as job losses from activity restrictions in Victoria
and the tightening of the JobKeeper program more than offset a continued recovery in jobs elsewhere in the economy.

Household income is expected to decline in late 2020 and the first half of 2021 as government support is gradually withdrawn
and unemployment remains elevated. Consumption is not expected to reach its pre-pandemic level until early 2022.

Australia’s international trade prospects
Global trade started its long recovery as lockdowns were eased and many economies tentatively reopened. However, this may
be set back as the pandemic spreads and some countries reinstate restrictions. This has implications for Australian trade,
which is tied to the reopening of international transport, supply chains and consumer demand.

The value of farm exports in Australia in 2020–21 is forecast to be more resilient than the overall economy and fall by
around $2.7 billion to $44.4 billion. A significant increase in crop export volumes is forecast for 2020–21; however, it will not
fully offset a forecast 12% fall in livestock exports, with lower prices expected across both categories. Slaughter numbers,
and therefore exports, are forecast to fall sharply (by $3.5 billion) because graziers are looking to rebuild herds and flocks.
For 2019–20, exports of livestock and livestock products were valued at $26.6 billion, which included more than $17 billion
for meat and live animals, a record high. Crop exports were valued at just over $20 billion, reflecting constrained production
because of the drought. Export price falls are expected in most grains, oilseeds, pulses, fibres, fodder and milk. Partly
offsetting these falls are modest forecast price rises for red meat, due primarily to increased demand arising from outbreaks
of African swine fever.

An improved terms of trade outlook reflects higher expected prices for bulk commodities and lower import prices as a result
of the appreciation of the exchange rate. The trade surplus is expected to be higher than previously thought over the next year
or so, largely driven by lower import values.

Australia has had a worsening political relationship with China, with tariffs on key agricultural commodities being put in place.
China imposed significant tariffs on Australian barley imports and suspended four major Australian abattoirs from the Chinese
beef market. China's bans on abattoirs are not unprecedented. However, if Chinese policy continues to be unpredictable,
exporters may seek alternative markets, even if that means accepting lower margins.

Queensland AgTrends 2020–21                                                                                                         6
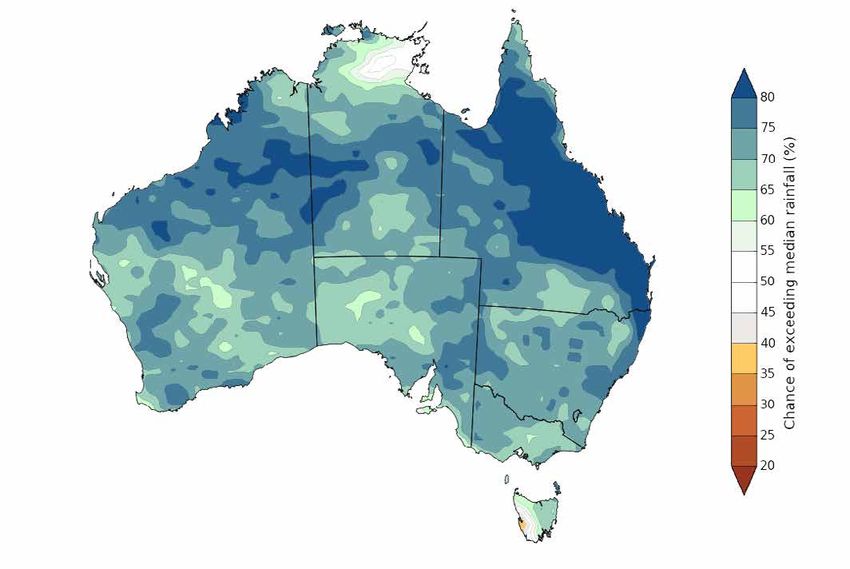
Climate outlook
The probability of exceeding median rainfall for December 2020 to February 2021 is currently greater than 70% for much of
Queensland, and greater than 80% along the Queensland coast (see Figure 5). This is great news for our farmers.

The Bureau of Meteorology forecasts that La Niña will peak around December or January and is likely to persist until at least
the end of February 2021. Warmer sea surface temperatures to the north of Australia are likely to persist and contribute to
the wetter outlook. La Niña and a strong polar vortex favour a positive Southern Annular Mode, with generally positive values
expected over the 2020–21 summer. This typically enhances the wet signal of La Niña in parts of eastern Australia.

As of 1 August 2020, 67.4% of Queensland was officially drought-declared.

Figure 5 Chance of exceeding the median rainfall for December 2020 to February 2021
Source: Australian Bureau of Meteorology.

Queensland AgTrends 2020–21                                                                                                 7
Primary industries estimates and forecasts
Table 1 GVP, first-stage processing and total primary industries estimates and forecasts, 2017–18 to 2020–21
                                               2017–18       2018–19       2019–20       2020–21       Change        Last         Change
                                               estimateb     estimatec     estimated     forecast,     2019–20       5 years      over 5
                                                                                         October       to 2020–21    average      years to
                                                                                         2020d                                    2019–20

 Commodity GVPa                                   $m            $m            $m            $m             %            $m            %

 Livestock
 Livestock disposals
    Cattle and calves                              5 248         5 447         6 126         5 180             –15      5 593              –7
    Poultry                                            561         587           568           555             –2         591             –6
    Pigs                                             248           289           363           361              –1        303                19
    Other livestock                                     41           39            42            40            –5            42            –5
    Sheep and lambs                                     12           23            25            27             9            26              6
 Total livestock disposals                         6 110         6 385         7 124         6 163             –13      6 554             –6
 Livestock products
    Eggs                                             225           244           237           248               5        230                8
    Milk (all purpose)                               230             219           170         170              0         221             –23
    Wool                                               98          108             73            62            –15           83           –26
 Total livestock productse                           553             571        480           480               0         535             –10
 Total livestock                                   6 663         6 956        7 604         6 643              –13      7 089             –6

 Horticulture
 Fruit and nuts
    Bananas                                          580             574         576           576              0         576                0
    Other fruit and nuts                             285           285           267           277              4         270                2
    Avocados                                           211         267             251         245             –2         221                11
    Mandarins                                          143           143           112           159           42         120              33
    Strawberries                                       193           137           145         148               2        160              –7
    Macadamias                                         153           141           125         128               2        136             –6
    Mangoes                                            113           113           90            90             0            97           –8
    Pineapples                                         64            65            77            87             13           69            25
    Table grapes                                       65            84            84            84             0            68            24
    Apples                                             93            93            54             51           –6            82           –38
 Total fruit and nuts                              1 900         1 902         1 781         1 845              4       1 800                2
 Vegetables
    Tomatoes                                         298           280           238           247              4         272             –9
    Other vegetables                                   231         243           209           216              4         224              –3
    Capsicums and chillies                             141         168             145         138             –5         146              –5
    Sweet corn                                         82             55           74          104              41           59              75
    Beans                                              130           83            76            88             16           88              0
    Mushrooms                                          70            63            63            63             0            67           –6
    Sweetpotatoes                                      64            64            59            59             0            63           –6
    Melons (rock and cantaloupe)                       59            66            56            56             0            57            –2
    Zucchini and button squash                          41           47            47            37            –21           43           –14

                                                                                                                                    (continued)

Queensland AgTrends 2020–21                                                                                                                   8
Table 1 continued
2017–18 2018–19 2019–20 2020–21 Change Last Change
estimateb estimatec estimated forecast, 2019–20 5 years over 5
October to 2020–21 average years to
2020d 2019–20
Commodity GVPa $m $m $m $m % $m %
Vegetables (continued)
Pumpkin 40 40 28 26 –7 35 –25
Lettuce 82 50 25 25 0 53 –53
Potatoes 52 40 24 24 0 44 –46
Melons (watermelon) 37 32 24 24 0 31 –24
Carrots 44 24 15 15 0 28 –47
Onions 30 23 15 15 0 24 –38
Total vegetables 1 401 1 278 1 098 1 137 4 1 235 –8
Total fruit and nuts and vegetables 3 301 3 180 2 879 2 982 4 3 035 –2
Lifestyle horticulture production
Nurseriesk 907 921 921 1 013 10 910 11
Turf k
327 327 204 204 0 243 –16
Cut flowers k
161 161 129 129 0 153 –15
Total lifestyle horticulture production 1 395 1 409 1 254 1 346 7 1 305 3
Total horticulture 4 696 4 589 4 133 4 328 5 4 340 0
Other field crops
Sugarcanef 1 234 1 087 1 060 1 043 –2 1 223 –15
Cotton (raw) g
882 279 102 524 414 470 11
Other crops c
134 52 149 191 29 95 101
Total other crops 2 250 1 418 1 311 1 758 34 1 789 –2
Cereal grains
Grain sorghum 302 319 101 395 291 235 68
Wheat 246 179 246 307 25 283 8
Other cereal grains 181 129 97 169 73 171 –2
Chickpeas 377 136 133 135 2 372 –64
Barley 58 54 26 63 142 68 –8
Maize 39 39 43 50 16 44 15
Total cereal grains 1 203 856 646 1 119 73 1 137 –2
Total crops 8 149 6 864 6 090 7 204 18 7 266 –1
Total agriculture 14 812 13 820 13 693 13 847 1 14 355 –4
Fisheriesc,h
Commercial fishing
Crustaceans 154 136 95 84 –12 114 –26
Molluscs 26 30 31 28 –12 19 47
Finfish 82 74 67 59 –12 70 –16
Total commercial fishing 261 240 194 170 –12 203 –16
Recreational fishing 94 94 94 94 0 94 0
Aquaculture 114 118 130 140 8 113 25
Total fisheries 469 452 418 404 –3 410 –1
Forestry and loggingc,i 270 279 283 251 –11 267 –6
Total primary industries (farm gate) 15 552 14 551 14 394 14 502 1 15 032 –4
(continued)
Queensland AgTrends 2020–21 9Table 1 continued
2017–18 2018–19 2019–20 2020–21 Change Last Change
estimateb estimatec estimated forecast, 2019–20 5 years over 5
October to 2020–21 average years to
2020d 2019–20
Commodity GVPa $m $m $m $m % $m %
First-stage processing value addedj
Meat processingc 2 344 2 449 2 732 2 364 –13 2 514 –6
Sugar processingc 635 553 550 557 1 626 –11
Log sawmilling, timber dressing, and 435 472 437 427 –2 436 –2
plywood and veneer manufacturingc
Fruit and vegetables processingc 277 267 242 251 4 255 –2
Milk and cream processing c
121 116 90 90 0 117 –23
Flour mill and feeding processing c
93 66 50 87 73 88 –2
Seafood processingc 71 68 63 61 –3 62 –1
Cotton ginning c
100 32 12 60 414 54 11
Total primary industries 4 077 4 023 4 176 3 896 –7 4 152 –6
(first-stage processing)
Total primary industries 19 628 18 574 18 570 18 398 –1 19 184 –4
a GVP (gross value of production) is defined as the gross value of commodities produced. It is a measure of economic output. In this publication, GVP relates
to the output of primary industry commercial operations only. The GVP is the value of recorded production at wholesale prices realised in the marketplace
(e.g. cattle sold at saleyards, sugarcane at the mill door, fruit and vegetables at the wholesale market). It is derived by multiplying the output from each
primary industry by the average wholesale price paid to producers.
b ABS final estimates for 2017–18 unless otherwise indicated.
c ABS final estimates for 2018–19 unless otherwise indicated.
d DAF estimates/forecasts.
e Excludes minor commodities such as honey, beeswax and mohair.
f Gross value of sugarcane at the mill door.
g Includes value of cottonseed and lint.
h Includes catches from state-managed fisheries.
i Australian Bureau of Agricultural and Resource Economics and Sciences (ABARES) estimates.
j See page 28 for the definition of value added. The forecasts for the value of first-stage processing in 2009–10 and beyond should not be compared with
the previous years due to the change in value-added ratios.
k The value of the lifestyle horticulture sector has been calculated on a gross-turnover basis rather than a value-added basis and therefore will contain
some double counting.
Queensland AgTrends 2020–21 10Volume of production index
A volume of production index describes the movement in production over a period of time relative to a base period. The volume
of production index for each of Queensland’s major agricultural commodities from 2010–11 to 2020–21 is detailed in Table 2.
Total Queensland agriculture production is forecast to increase by 5% from 2019–20 to 2020–21, with an index of 107.
This reflects the improved seasonal conditions expected for 2020–21 as the sector recovers from consecutive years of drought.
Volume increases are expected across grains, cotton and other field crops while decreases are expected in
livestock production.
Table 2 Volume of production index for Queensland’s major agricultural commoditiesa
2019 2020
2010 2011 2012 2013 2014 2015 2016 2017 2018 –20 –21
Commodity –11 –12 –13 –14 –15 –16 –17 –18 –19 (forecast) (forecast)
Wheat 77 95 82 52 50 66 76 39 21 28 57
Grain sorghum 118 141 147 86 161 117 60 97 92 106 152
Barley 34 45 40 42 59 87 102 44 31 17 64
Major cereal grains 84 104 96 62 83 84 76 56 42 50 85
Sugarcane 65 67 72 80 85 89 95 87 85 82 86
Cotton lint 211 187 189 190 98 114 172 201 58 52 129
Major other field crops 100 97 100 106 87 94 113 114 77 73 96
Major fruit 125 166 178 164 215 215 223 239 246 242 235
Major vegetables 111 137 103 75 78 81 89 86 84 83 82
Major fruit and vegetables 118 152 142 121 123 150 158 164 167 161 160
Crops 100 110 108 98 93 103 108 36 87 86 106
Beef 132 130 136 149 134 152 117 127 148 147 119
Pigs 108 109 110 108 109 130 114 110 118 109 110
Poultry (chicken meat) 170 174 174 208 212 221 225 214 211 216 216
Sheep and lambs 34 39 46 56 44 40 5 7 13 10 9
Major livestock disposals 130 129 137 148 136 153 124 130 147 146 125
Milk (all purposes) 61 61 57 54 52 49 51 52 44 38 39
Wool 34 38 34 25 18 12 12 19 16 15 15
Eggs 340 385 395 588 603 413 472 450 643 660 666
Major livestock products 68 72 69 75 72 57 62 63 69 66 67
Livestock 113 113 118 127 118 127 106 112 125 123 108
Total agricultureb 105 111 112 111 104 113 110 110 104 102 107
a Base of each index is 1996–97 = 100.
b Excludes lifestyle horticulture due to insufficient data.
Source: Compiled by DAF using ABS and DAF data.
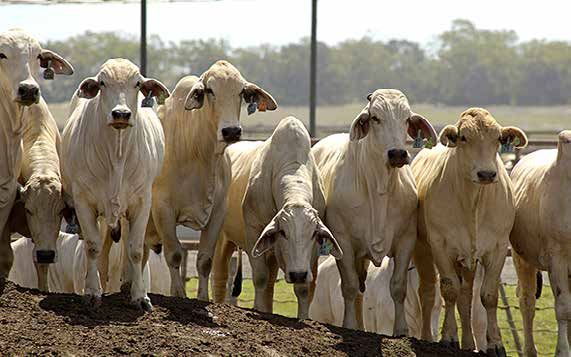
Queensland AgTrends 2020–21 11Livestock disposals Cattle and calves Forecast The 2020–21 GVP for Queensland’s cattle and calf industry (including cattle and calves sold for slaughter plus live exports) is forecast to be $5.18 billion. This is 15% lower than the final estimate for 2019–20 and 7% lower than the average for the past 5 years. The overall sector value comprises $4.85 billion from cattle and calves sold for slaughter and $327 million from live exports. Analysis and discussion Cattle and calves sold for slaughter The 2020–21 GVP forecast of $4.85 billion is 15% below the final estimate for 2019–20. The impacts from COVID-19 on the sector have been minimal compared to the effects of seasonal conditions and herd rebuilding. Meat & Livestock Australia (MLA) forecasts that seasonal conditions during spring 2020 will play a significant role in market performance in the second half of the year, with any improvement to pasture conditions likely to see grazier demand for young cattle and females increase. In the meantime, a weak Australian dollar continues to assist exporters of Australian beef, as domestic processors continue to rely on overseas markets to absorb increased supply. Over 3.79 million cattle and calves were slaughtered in Queensland in 2019–20, about the same as the previous financial year. If drought conditions continue throughout spring and summer, more producers could turn off high numbers of stock over the last quarter of 2020. Record numbers of cattle at feedlots will assist beef processors during this period. Queensland beef and veal production for the year to June 2020 was just under 1.11 million tonnes carcase weight, in line with 2018–19 production. The AussieGRASS pasture growth model is predicting mixed news, with above-average pasture growth in southern and central Queensland over winter but ongoing drought in the north. This will most likely result in production for 2020–21 similar to that in the previous year, as some graziers will hold on to their cattle longer and rebuild the herd while those in the north will have no choice but to slaughter earlier than expected. According to ABARES, in 2020–21 Australian saleyard prices of beef cattle are expected to rise by 4%, reflecting strong demand for beef in global markets and a lower supply of cattle in the saleyards. It appears likely that red meat prices on export markets will continue to be well below domestic prices, severely reducing processing margins. This, together with the shortage of cattle, is likely to put pressure on some processors to rationalise their operations further. A sound wet season across northern Australia will maintain Queensland prices, with northern beef producers rebuilding breeder numbers and holding steers and cull females to heavier sale weights. Exports In 2019–20, Queensland exported 632 414 tonnes of beef and veal, accounting for 52% of Australia’s beef and veal exports. This was an increase of approximately 10 824 tonnes from the previous year. ‘Other Asian markets’ (including China) was Queensland’s largest export market, accounting for 32% of exports, and was followed by Japan (28%) and South Korea (17%). Preliminary estimates for 2019–20 indicate that Queensland exported $6.22 billion worth of beef, up 16% from the previous year. Fresh and chilled beef exports increased by 11% to nearly $2.58 billion, while frozen beef exports increased by nearly 19% to just over $3.64 billion. Beef exported by airfreight from Queensland makes up 32% of the loadings. The year-on-year export volumes for the fourth quarter of 2019–20 have fallen by 43% (the equivalent of $22.1 million), predominantly due to COVID-19. Over 2019 and 2020, China imposed import bans on several Australian abattoirs. Presently this is not affecting exports, as they can be redirected to other markets, but if the bans continue, the threat of an oversupply domestically could become a reality. Queensland AgTrends 2020–21 12
Feedlots
The number of cattle on feed in Australia decreased by approximately 137 000 head (12%) from the June 2019 quarter to
the June 2020 quarter. A decrease in numbers on feed was recorded in all states. Queensland had the lowest percentage
decline, dropping by 6% to 611 683 head of cattle on feed. Western Australia had the greatest percentage decrease (31%),
down 16 385 head from the previous year, followed by Victoria (25%), New South Wales (17%) and South Australia (15%).

Live cattle exports
The GVP for Queensland’s live cattle exports in 2020–21 is forecast to be $327 million. This is 25% less than the final estimate
for 2019–20 but greater than the average for the last 5 years. The main reason for this forecast drop is a tighter domestic
supply due to the continuing drought in northern Queensland and falling demand as responses to COVID-19 reduce household
incomes in importing countries such as Indonesia. The main export destinations for live cattle from Queensland in 2019–20
were Vietnam (68%) and Indonesia (27%), with Indonesia significantly reducing its intake over the last quarter of the period.

According to ABARES, Indonesian consumers are preferring to purchase imported boxed beef from Australia through
supermarkets or online platforms. This trend has dampened the outlook for feedlotters importing live cattle from Australia.
However, the fall in live cattle exports to Indonesia in the first 9 months of 2019–20 was more than offset by growth in our
second most important market, Vietnam—a country that has had considerable success in managing the spread of COVID-19.

Poultry
Forecast
The GVP for poultry for 2020–21 is forecast to be $555 million, 2% lower than the ABS estimate for 2019–20 and 6% lower
than the average for the past 5 years.

Analysis and discussion
The drop in GVP reflects decreased production as the industry adjusts to COVID-19 demand and supply changes. On the
demand side, there has been a drop in orders from hotels and the full-service restaurant sector. However, the quick-service
restaurant demand has been fairly resilient as the sector readily transitioned to takeaway options and online delivery services
in many states. As restrictions ease, demand is expected to slowly recover across 2020–21.

Offsetting some of this decline in demand was an increase in demand from the retail sector. Demand for poultry meat
(particularly chicken, which is the most consumed meat in Australia) increased in March and April 2020 in response to
COVID-19 restrictions and panic buying from consumers. Demand from this sector is expected to move back to trend over
2020–21 as consumer behaviour normalises and consumers’ frozen stocks are used up.

On the supply side, businesses have responded to COVID-19 by implementing workforce measures to ensure business
continuity and continued product supply. Measures include changes or extensions to operating hours, reducing the number
of staff present at any one time, reconfiguration of processing lines, spacing of people and equipment to maximise physical
distancing and the use of personal protective equipment. These measures are expected to impact labour productivity and
enterprise profitability and are not reflected in the GVP, with prices forecast to be constant from 2019–20 to 2020–21.

Pigs
Forecast
The GVP for pigs for 2020–21 is forecast to be $361 million, 1% lower than the ABS estimate for 2019–20 and 19% higher
than the average for the past 5 years.

Analysis and discussion
The GVP for pigs is forecast to decrease only marginally from 2019–20 despite the COVID-19 outbreak. Prices are forecast
to decrease by 1% in 2020–21, remaining at historically high levels in response to the outbreak of African swine fever that
reduced China's pig herd by one-half.

Queensland AgTrends 2020–21                                                                                                   13
While the high prices are likely to trigger a production response in countries that have capacity, strong demand is likely
to support high prices over the medium term. In Queensland, production is expected to increase by 3% to over 1.1 million
slaughterings in 2020–21.

The disruption from COVID-19 is expected to limit sector growth and profits in 2020–21. On the demand side, orders from
the food service sector are expected to recover slowly across 2020–21 as restrictions are eased. On the supply side, the
pork industry has absorbed significant costs associated with planning for COVID-19 and mitigating the risks it poses to
their employees, their businesses, animal welfare and the supply of pork products to the community. Farms and processing
facilities have restructured work teams, applied personal protective equipment and adopted additional hygiene procedures,
costing abattoirs up to $27 000 per week. Offsetting some of the supply side costs associated with COVID-19 are forecast
reductions in feed costs.

Sheep and lambs
Forecast
The GVP for sheep and lamb production for 2020–21 is forecast to be $27 million, 9% above DAF’s revised estimate for
2019–20 and 6% above the average for the past 5 years.

Analysis and discussion
The Queensland sheep slaughter is forecast to decline by 9% from 2019–20 to 2020–21, to 86 million head. The lamb
slaughter is expected to increase 7% over the same period, to 85 million head. This is in line with an increased national lamb
slaughter of 4% and an increased share of the national slaughter by Queensland. In response to national slaughter changes,
lamb prices are expected to decline by 1% in 2020–21, while sheep prices are forecast to increase by 1%.

MLA is predicting that the substantial decline in sheep slaughter will cause mutton production to fall sharply, by 29%, in
2020. Global market conditions have been particularly volatile in the past few months, as the spread of COVID-19 has fostered
instability. This year, exports of lamb are forecast to fall slightly on 2019 volumes, to 282 000 tonnes shipped weight, while
mutton exports are expected to reach 129 000 tonnes shipped weight, down 31% from 2019.

MLA expects that growing retail demand and the protein deficit induced by outbreaks of African swine fever will continue
to drive export prices for sheep meat, particularly as key markets such as China and the United States compete for shorter
supplies. However, many key export markets now face economic recession as a result of the COVID-19 pandemic, which could
lead to tighter disposable incomes and switching of consumption to lower priced alternatives.

For a discussion on wool, see page 16.

Goats
Goat meat is widely consumed around the world but remains a largely niche product in Australia, with demand mostly from
certain cultural groups. Compared to other proteins, it has the advantage of no religious taboos. In some cultures, it has a
unique role in religious and traditional family events.

The majority of goat meat across Queensland has been harvested from semi-wild rangeland goats. This is changing due to
consistently better prices, exclusion fences and producers learning how to better manage goats under extensive rangeland
conditions. Goat over-the-hook prices reached record levels in 2019, peaking in late June at 940 cents per kilogram carcase
weight, and averaging 790 cents per kilogram for 2019. Prices have declined recently but have averaged 771 cents per
kilogram carcase weight for 2020 to date.

At these prices, a rangeland goat enterprise will significantly outperform wool production from a self-replacing flock of
Merinos and will be no less profitable than a specialist meat sheep operation producing lambs. It is expected that more
specialist wool producers will mate Merino ewes to meat breeds over time and shift away from wool production, with some
diversifying into meat goats as better management skills are developed and herd performance is improved.

Queensland AgTrends 2020–21                                                                                                    14
Livestock products
Milk
Forecast
The GVP for milk for 2020–21 is forecast to be $170 million, the same as DAF’s final estimate for 2019–20 and 23% lower than
the average for the past 5 years.

Analysis and discussion
Production is expected to remain around the same in 2020–21 as for the previous year, at about 310 megalitres, falling
slightly in the first half of the year before rebounding in the second half. There has been some rain this year, which should
enable a small winter crop. The forecast higher rainfall for the remainder of 2020 should help farmers grow a substantial
summer crop. In addition, grain, fodder and hay prices have fallen, and further falls are expected. This should return prices
to close to long-term averages after being double and triple these in recent years. The expected rainfall and fall in feed prices
should stabilise production after many years of decline due to drought.

COVID-19 had a very significant impact on milk sales, but this lasted only a few months. There has been a change in
purchasing patterns with reduced cafe milk sales, reduced flavoured milk sales and higher retailer sales. Farmgate prices
have fallen due to uncertainty and changed sales patterns from March to June 2020. It is unclear whether prices will
increase during 2020–21.

Factors that will influence the Queensland dairy industry over the year ahead are:
• whether the predicted higher rainfall eventuates
• whether grain, fodder and hay prices return to average levels and stay there
• whether farmgate milk prices increase after falling in July 2020
• the impact of the dairy code, its enforcement by the Australian Competition and Consumer Commission and changes to
  the code due in early 2021
• the review of the national dairy industry, which recommends transformational change to industry structures.

Eggs
Forecast
The GVP for eggs for 2020–21 is forecast to be $248 million, 5% higher than DAF’s revised forecast for 2019–20 and
8% higher than the average for the past 5 years.

Analysis and discussion
The egg industry has performed well in the disruption from the COVID-19 pandemic. Eggs were diverted from the food service
sector to meet increased retail demand arising from more in-home cooking. Strong demand from the retail sector is forecast to
sustain prices over 2020–21, with farmgate egg prices expected to increase by 2% from 2019–20.

Substantial preparation by the industry to protect their teams and maintain business continuity has ensured steady supply
since March 2020. In line with this, egg volumes are forecast to grow marginally in 2020–21, with national egg production
forecast to be 520 million dozen, according to Australian Eggs Limited. Queensland volumes will continue to reflect population
share at 27–30% of national production.

While farmgate prices are forecast to increase, industry margins will continue to be squeezed, with growers absorbing costs
associated with meeting COVID-19 measures. Industry estimates suggest that the restructuring of work teams, the application
of personal protective equipment and additional hygiene procedures have typically cost a large egg farm with packing rooms
between $15 000 and $18 000 per week.

Queensland AgTrends 2020–21                                                                                                    15
With egg supply forecast to remain slightly short of demand, there will be only limited ability to pass through the costs
associated with COVID-19 to customers. Price increases to date have been generally inadequate, with farmers absorbing a
significant proportion of input cost increases. Forecast lower feed costs in 2020–21 should, however, provide some relief.

The industry has also faced ongoing regulatory and market uncertainty in relation to production systems. As regulatory
processes move slowly, retailers have indicated phase-out timelines for cage eggs without providing the pricing and
specification certainty to drive investment. This has impacted confidence in replacing capacity in all production systems.

Wool
Forecast
The GVP for wool for 2020–21 is forecast to be $62 million, 15% lower than DAF’s final forecast for 2019–20 and 26% lower
than the average for the past 5 years.

Analysis and discussion
The outlook for the wool industry for 2020–21 is subdued, with reduced volumes, reduced prices and weak demand.

The Australian Wool Production Forecasting Committee expects a total greasy wool production in Queensland in 2020–21
of 6.7 million kilograms, 6% lower than their final estimate for 2019–20. This reflects declines in Queensland sheep numbers
as producers take advantage of demand for stock in other regions because, at a national level, herd rebuilding is underway.
The national flock estimate for June 2020 of 63.5 million head is the lowest in more than a century.

The largest factor in the decreased GVP for the wool sector is the price freefall, in response to demand competition. The
Eastern Market Indicator has fallen 680 cents since the first sale of this calendar year, a drop of 42%. The AWEX auction
statistics for the 2019–20 season show a 22.9% decrease in firsthand wool offering volumes in Queensland since the
same period in 2018–19. This trend is expected to continue in 2020–21 as growers hold on to their clip in response to
price decreases.

A lack of orders in the current global pandemic is creating a despondent outlook across the trade. The supply chain has
become clogged and the cash flow of millers has been decimated. Very few early-stage processors are currently running at
more than 50% capacity, and some of the smaller operations have been forced to close their doors (at least temporarily).
Local wool producers report the prices of quality wool garments in capital city shops as being well above those of equivalent
products produced with alternative fibres and their summation is that wool will become more of a niche market with specific
production requirements to maintain profitability.

Queensland AgTrends 2020–21                                                                                                  16
Crops
Horticulture crops

Fruit and nuts
Forecast
The total GVP for fruit and nuts in Queensland for 2020–21 is forecast to be $1.85 billion. This is 4% higher than DAF’s final
estimate for 2019–20 and 2% greater than the average for the past 5 years.

Analysis and discussion
Bananas: The GVP for 2020–21 is forecast to be $576 million, the same as DAF’s final estimate for 2019–20 and the average
for the past 5 years.

Queensland banana production is on track to be similar to last year, and prices are expected to be around average levels.

Strawberries: The GVP for 2020–21 is forecast to be $148 million, 2% greater than DAF’s final estimate for 2019–20 and
7% lower than the average for the past 5 years.

Strawberry volumes have improved this season and the cool weather has been favourable, producing good-quality fruit at
harvest. There has also been an improvement in the availability of runners from the Granite Belt. However, several growers
have concerns about labour shortages and consequently are reducing their plantings. Strawberry prices were around
average levels at the start of the season but have fallen during the peak season due to greater supply coming from the
southern states.

Avocados: The GVP for 2020–21 is forecast to be $245 million, 2% lower than DAF’s final estimate for 2019–20 and 11%
greater than the average for the past 5 years.

Queensland avocado production is forecast to be low this year. Prices are expected to be marginally higher than last year’s
average, which was low because of the reduction in food services demand arising from COVID-19 restrictions during the
peak Queensland avocado season.

Macadamias: The GVP for 2020–21 is forecast to be $128 million, 2% greater than DAF’s final estimate for 2019–20 and
6% lower than the average for the past 5 years.

The macadamia crop is forecast to be marginally higher than for last year. Growers are maintaining their investment in new
plantings and there has been expansion in the growing regions and in new varieties.

Mandarins: The GVP for 2020–21 is forecast to be $159 million, 42% greater than DAF’s final estimate for 2019–20 and
33% greater than the average for the past 5 years.

Citrus Australia has commented that this season there will be strong volumes of Afourers due to more plantings coming into
bearing age, while Murcott volumes are expected to be similar to those for last season. National mandarin export volumes
are forecast to be lower in 2020–21 following a large increase in 2019–20. To June 2020, the top export destinations for
mandarins were Japan (25%) and China (14 %).

Mangoes: The GVP for 2020–21 is forecast to be $90 million, the same as DAF’s final estimate for 2019–20 and 8% lower
than the average for the past 5 years.

The Queensland seasonal harvest commences in the dry tropical regions in mid-November, then Mareeba–Dimbulah in early
December, Central Queensland in late December, and South East Queensland into the new year.

Queensland AgTrends 2020–21                                                                                                      17
You can also read