Proposed District Plan Economic Assessment - Prepared for: Invercargill City Council - Invercargill ...
←
→
Page content transcription
If your browser does not render page correctly, please read the page content below
Proposed District Plan
Economic Assessment

Prepared for: Invercargill City Council

Date: May 2015
Status: Final
Proposed District Plan Economic
   Assessment

  Invercargill City Council

  Document reference: ICC001.15
  Date of this version: May 2015
  Report author(s): Derek Foy

  Disclaimer
  Although every effort has been made to ensure accuracy and reliability of the information contained in this report,
  neither Market Economics Limited nor any of its employees shall be held liable for the information, opinions and
  forecasts expressed in this report.

                                                                                              Market Economics Limited
                                                                                                 Level 5, 507 Lake Road
www.me.co.nz                                                                                  PO Box 331 297, Takapuna
                                                                                                     Auckland 0740, NZ
                                                                                                          P 09 915 5510
Contents
EXECUTIVE SUMMARY ...........................................................................................................4

1           INTRODUCTION .......................................................................................................8

           BACKGROUND .................................................................................................................................. 8

           OBJECTIVE AND SCOPE ...................................................................................................................... 9

2           METHODOLOGY .................................................................................................... 11

           POPULATION AND HOUSEHOLD PROJECTIONS ..................................................................................... 11

           EMPLOYMENT PROJECTIONS............................................................................................................. 12

           RETAIL DEMAND PROJECTIONS ......................................................................................................... 12

           FLOORSPACE DEMAND PROJECTIONS ................................................................................................. 12

3           PDP OBJECTIVES .................................................................................................... 14

           BUSINESS ZONES ............................................................................................................................ 14

           INDUSTRIAL ZONES ......................................................................................................................... 16

4           RMA AND IMPORTANCE OF CENTRES..................................................................... 19

           RMA PURPOSE .............................................................................................................................. 19

           ROLE OF TOWN CENTRES ................................................................................................................. 19

           BENEFITS FROM CENTRES................................................................................................................. 19

           BENEFITS AND CENTRE SIZE .............................................................................................................. 20

           SUSTAINABILITY .............................................................................................................................. 21

           PROVIDING FOR COMMUNITY NEEDS ................................................................................................. 21

5           CURRENT AND PROJECTED DEMAND ..................................................................... 22

           POPULATION AND HOUSEHOLDS ....................................................................................................... 22

           ISEM DATA ................................................................................................................................... 23

           EMPLOYMENT PROJECTIONS............................................................................................................. 25

           DEMAND PROJECTIONS ................................................................................................................... 25
6 DISTRIBUTIONAL EFFECTS ASSESSMENT ................................................................. 28
RATIONALE .................................................................................................................................... 28
SCENARIO DEFINITION ..................................................................................................................... 28
RESULTS ........................................................................................................................................ 32
DISTRIBUTIONAL EFFECTS CONCLUSIONS ............................................................................................ 37
7 OTHER COSTS AND BENEFITS ................................................................................. 38
COSTS/OPPORTUNITIES REDUCED ..................................................................................................... 38
BENEFITS/OPPORTUNITIES CREATED .................................................................................................. 39
COST-BENEFIT SUMMARY ................................................................................................................ 40
8 OTHER EXAMPLES FROM AROUND NZ ................................................................... 41
AUCKLAND .................................................................................................................................... 41
CHRISTCHURCH .............................................................................................................................. 42
HAMILTON .................................................................................................................................... 42
WELLINGTON ................................................................................................................................. 43
OTHER TOWNS............................................................................................................................... 43
SUMMARY ..................................................................................................................................... 43
9 CONCLUSIONS ....................................................................................................... 44
APPENDIX 1: SUMMARY OF SUBMISSIONS........................................................................... 45
A1.1 PROPOSED BUSINESS ZONES............................................................................................................. 45
A1.2 PROPOSED INDUSTRIAL ZONES .......................................................................................................... 47
APPENDIX 2: M.E MODELS USED .......................................................................................... 49
A2.1 ECONOMIC FUTURES MODEL............................................................................................................ 49
A2.2 SPATIAL ECONOMY MODEL .............................................................................................................. 49
A2.3 MARKET METER ............................................................................................................................. 51
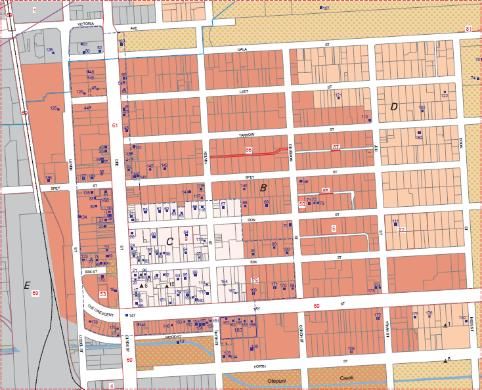
APPENDIX 3: CENTRAL INVERCARGILL ZONING OVERVIEW ................................................... 52
APPENDIX 4: ODP ZONE SUMMARY ..................................................................................... 54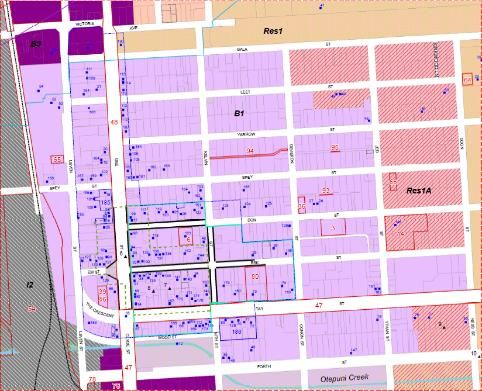
A4.1          AREAS .......................................................................................................................................... 54

A4.2          OBJECTIVES ................................................................................................................................... 54

A4.3          CITY CENTRE SUB-AREA................................................................................................................... 54

A4.4          BUSINESS SUB-AREA ....................................................................................................................... 54

A4.5          BUSINESS A SUB-AREA .................................................................................................................... 55

A4.6          ENTERPRISE SUB-AREA .................................................................................................................... 55

A4.7          SUBURBAN SERVICE SUB-AREA ......................................................................................................... 55

Figures
FIGURE 5.1: INVERCARGILL CITY DISTRICT DEMOGRAPHIC PROJECTIONS ................................................................. 22

FIGURE 5.2: INVERCARGILL FLOORSPACE DISTRIBUTION (GFA, M2) ........................................................................ 23

FIGURE 5.3: INVERCARGILL CITY EMPLOYMENT TIME SERIES (CENTRE-DOMINANT SECTORS) ..................................... 24

FIGURE 5.4: INVERCARGILL CITY EMPLOYMENT PROJECTIONS (MECS) .................................................................... 25

FIGURE 5.5: INVERCARGILL CITY RETAIL DEMAND PROJECTIONS ($M)..................................................................... 26

FIGURE 5.6: INVERCARGILL CITY FLOORSPACE DEMAND PROJECTIONS (GFA, M2)..................................................... 27

FIGURE 5.7: INVERCARGILL CBD FLOORSPACE DEMAND PROJECTIONS (GFA, M2) .................................................... 27

FIGURE 6.1: SCENARIO DEFINITION ................................................................................................................... 29

FIGURE 6.2: ASSUMED SHOWGROUNDS TENANCY BY EACH POTENTIAL ZONING (GFA, M2) ....................................... 31

FIGURE 6.3: DEE AND CLYDE ST B3 AREA SCENARIO DEFINITIONS .......................................................................... 32

FIGURE 6.4: MODELLED GFA CONVERTED FROM OTHER USES TO RETAIL OR OFFICE (M2) ......................................... 33

FIGURE 6.5: FLOORSPACE IMPACTS, NO MARKET GROWTH STIMULATED ................................................................ 34

FIGURE 6.6: DISTRIBUTION OF FLOORSPACE, NO MARKET GROWTH STIMULATED .................................................... 35

FIGURE 6.7: FLOORSPACE IMPACTS ON CBD, SOME MARKET GROWTH STIMULATED ................................................ 36

FIGURE 6.8: CBD SHARE OF INVERCARGILL GFA, SOME MARKET GROWTH STIMULATED ........................................... 36
Executive Summary
Background

Invercargill City Council is currently preparing its next generation District Plan to replace the
Operative District Plan. A key issue identified in submissions to the Proposed District Plan
(PDP) relates to changes to some of the City’s business and industrial zones, and in particular
as those changes relate to ICC’s desire to manage the future effects on the Invercargill City
Centre and suburban shopping centres.

To manage these effects the PDP would, in broad terms, apply more restrictive rules about
where in Invercargill some activities can locate than exist in the Operative Plan (ODP). The
ODP has a relatively permissive approach to retail and commercial development in some non-
CBD zones, especially the ‘Enterprise Sub-Area’ zone. The underlying objectives of this change
are to ensure that the CBD maintains its primacy as a shopping and commercial destination
within Invercargill, and the vitality and vibrancy of suburban centres is maintained, by
restricting the amount of retail and commercial development that can locate in places in other
areas.

Market Growth

Invercargill is projected to experience relatively slow growth over the next two decades, with
the current population expected to increase by just 4.5% out to 2031. That equates to average
annual growth of less than 100 people, including a projected post-2031 population decline.
Household growth will be somewhat faster, at 14% out to 2036, given the projected declining
average household size. The growth in demand for all retail goods and services is projected to
be similarly modest (+20% out to 2036), given the dominance of household demand in the
retail market.

There is currently an estimated 150,000m2 of retail and commercial gross floor area (GFA) in
the Invercargill CBD, 54% of Invercargill total. That is expected to increase to nearly 180,000m2
to support the demands of market growth, assuming no structural change in where within
Invercargill demand is served. Total City floorspace growth over the same time would equate
to 52,000m2.

Zoning Change Scenarios

To assess the appropriateness of the zoning changes proposed by submitters and compare
those against the PDP and ODP, we have modelled the expected distribution of retail and
commercial activity within Invercargill under several scenarios for the areas (the
Showgrounds, Dee St and Clyde St) which have been the subject of submissions. The change
to that distribution is a proxy for changes in the vitality and vibrancy in each location, and CBD
primacy. The relativity of changes under each scenario is important to establish which scenario
is the most appropriate to meet the objectives of the PDP.

                                                                                              4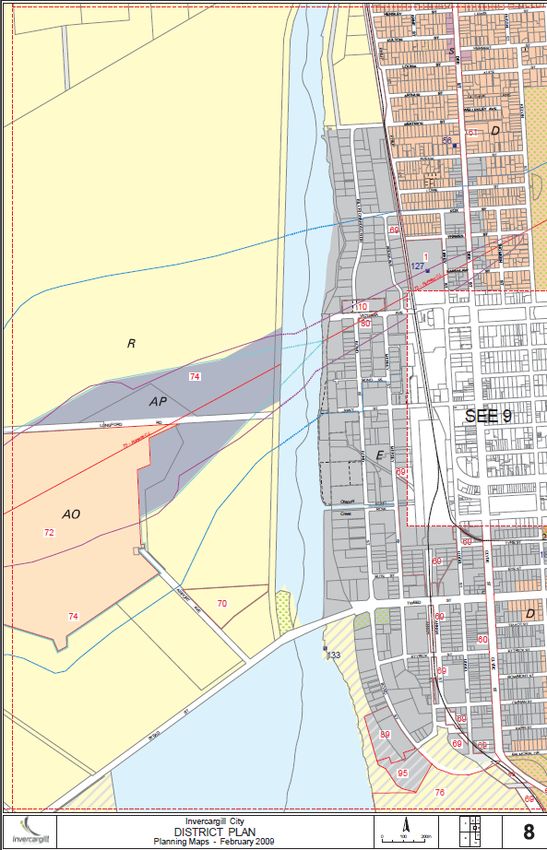
The assessment indicates that total retail GFA in the Showgrounds would increase by 14,100-
16,100m2 under the more permissive zoning types (Business 3, Business 6 or Enterprise), or
some 2,400m2 under an Industrial 1 zoning, and office GFA would increase by less than
1,000m2. Retail GFA in the Dee St B3 zone would increase by much less (500-2,400m2) while
in the Clyde St B3 zone the increase would be less still. Office growth in both the Dee St and
Clyde St zones would be expected to increase by less than 1,000m2.

In total under the assumptions applied, the least permissive zoning for these three areas
(Scenario 8, PDP) would result in some 5,700m2 being repurposed from existing uses to retail
or office space, and under the most permissive (Scenario 1, ODP) this figure would be nearly
28,000m2. Assuming the new space developed does not stimulate any new growth, but merely
results in a redistribution of existing activity, that amount of floorspace would be diverted
away from existing business areas, predominantly the CBD.

Effects of Zoning Changes: No Market Growth Stimulated

Assuming the new space developed does not increase the size of the Invercargill market, the
scenarios would result in a decrease in occupied space in the CBD of 23-27% under the more
permissive scenarios, 9% under scenario 2 and 4% under scenario 8 (PDP). The impact on CBD
office space would be much lower in percentage terms, at 9-11% under the more permissive
scenarios and 4-6% under other scenarios.

Impacts on Invercargill’s suburban shopping centres would be lower than on the CBD, at 12-
15% (more permissive), 5% under scenario 2, 6% under scenario 9 and 2% under scenario 8.
The CBD would be expected to experience larger impacts as it has a higher proportion of retail
activities that would more directly compete with new space in new developments. Impacts on
office space in the suburban centres is expected to be very small.

The scenarios with the largest impacts would represent significant effects on retail activity in
the CBD, and indicate that the permissiveness of the more laissez faire zoning combinations
would potentially result in a large amount of retail space developing outside the CBD and
existing suburban centres. The consequence of that would be a decrease in the primacy of the
CBD, and the depth and breadth of the retail offered in the CBD and suburban centres.
Population growth would do little to mitigate those impacts.

Another way of expressing those impacts is to examine the share of Invercargill GFA in each
centre. Currently 52% of Invercargill retail space is in the CBD, but this would decrease under
a more laissez faire zoning than is proposed in the PDP. The CBD’s share of future retail space
would fall to under 40% under some scenarios, and 40-50% under others – a significant erosion
of the primacy of the CBD, except for scenarios 2, 8 and 9 which represent smaller declines.
Similar patterns apply to the distribution of office space.

Effects of Zoning Changes: Some Market Growth Stimulated

There is likely to be some increase in the size of the market due to the point of differentiation
able to be offered in new developments, especially in the greenfields Showgrounds area, and

                                                                                             5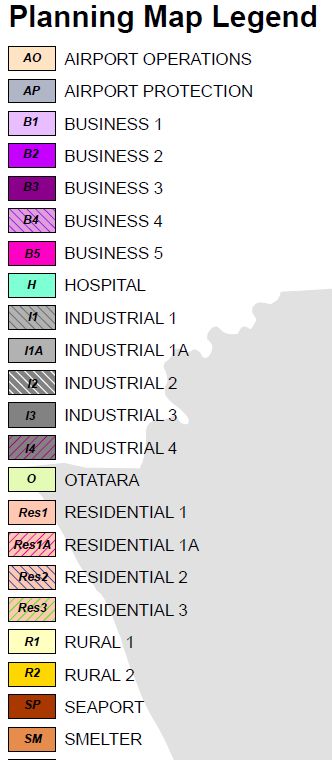
that larger market size would mitigate the adverse effects on the CBD and suburban centres
to some extent.

There is significant uncertainty as to the magnitude of this effect, so we have modelled
different market size assumptions, however the important consideration for this assessment
is the relativity of the scenarios. That relativity shows that the PDP zoning (Scenario 8) would
have the lowest impacts irrespective of how much market growth is stimulated, while
maintaining the existing Enterprise zoning would have the largest impacts.

Similar observations can be made regarding the distribution of floorspace within Invercargill.
The more laissez faire zoning scenarios would result in a more significant erosion of the CBD’s
primacy, both for retail and office floorspace. The scenario that would result in the largest
proportion of retail and office activity in the CBD is scenario 8, which is the zonings proposed
in the PDP.

Other Costs and Benefits

The RMA requires consideration of benefits and costs for this type of assessment so as to take
into account the potential effects of alternatives. Many costs and benefits will arise indirectly,
be widely dispersed, and be difficult to quantify. The extent to each alternative contributes to
net benefits or costs depends on how much economic growth each might stimulate, where
activity might be located, and the implications for the community in providing for their needs.

Potential net costs of the zoning changes include: decreases in employment, GDP, wages and
investment in areas impacted by zoning changes; reduced accessibility to goods and services;
consequent reduced amenity; an opportunity cost of non-industrial activities occupying
industrial land.

The net benefits in areas subject to zoning changes include: increase in employment, GDP,
wages; increased private investment; increased range and choice of goods and services. Net
benefits for the wider Invercargill community include: potential increased public investment
in existing areas (e.g. CBD) to counter adverse effects; new businesses establishing in the City
and improved access to some goods and services.

We have not attempted to measure these costs and benefits, however in most instances a net
cost somewhere in Invercargill (decreased accessibility to goods in the CBD) is likely to be
balanced by a net benefit somewhere else in Invercargill (increased accessibility to goods in
the Showgrounds). Most of the net benefits and costs will be small in terms of their effect on
economic and social wellbeing in Invercargill, and will be similar across all scenarios. However,
at a location-specific level (e.g. in the CBD) the costs and benefits would be less likely to
balance out, resulting from a change in the distribution of business in Invercargill.

Overall the objectives of the PDP will be influenced to a much greater degree by the potential
retail and office distributional effects of zoning changes than by other costs and benefits, so
these other costs and benefits, are much less important in assessing the degree to which each
scenario will meet the objectives of the PDP.

                                                                                              6
Conclusions
The objectives of the PDP are appropriate to meet the overarching purpose of the Resource
Management Act (RMA), and the rules and policies of the PDP are the most appropriate rules
and policies to meet the objectives of the PDP.
71 Introduction
Market Economics Ltd (M.E) has been commissioned by Invercargill City Council (ICC) to
provide an economic assessment of the effects of the Proposed Invercargill City District Plan
(PDP).
Background
ICC has previously published its Spatial Plan “The Big Picture” (2012). That Plan introduced a
hierarchy of “Community Nodes and Community Precincts” to form the base structure to be
applied in managing the structure of the Invercargill urban area. That structure was arrived at
through a consultative process, and reflects Council’s and the community’s vision of
Invercargill, and how it might be encouraged to develop and redevelop.
ICC is currently involved in the preparation of its next generation District Plan, the PDP, which
will implement the hierarchy established in the Spatial Plan. The PDP will replace the Operative
District Plan (ODP). One key issue that has been identified in the submissions process for the
PDP is the proposed changes to some of the City’s business and industrial zones, and in
particular as those changes relate to ICC’s desire to manage the future effects on the
Invercargill City Centre (‘CBD’) and suburban shopping centres to best meet the requirements
of Part 2 of the RMA.
To manage these effects the PDP would, in broad terms, apply somewhat more restrictive
rules about where in Invercargill some activities can locate than exist in the ODP. The ODP has
a relatively permissive approach to retail and commercial development in some non-CBD
zones, especially the ‘Enterprise Sub-Area’ zone. The underlying objectives of this change are
to ensure that the CBD maintains its primacy as a shopping and commercial destination within
Invercargill, and the vitality and vibrancy of suburban centres is maintained, by restricting the
amount of retail and commercial development that can locate in places in other areas.
The scope of this assessment has been shaped by the submissions made, the key themes of
which include:
Economic growth: The importance of permitting economic growth and providing
opportunity for new businesses to enter the Invercargill market.
Existing uses and property rights: Some submitters are concerned that the PDP fails
to recognise the range of existing activities in the Enterprise zone, especially in the
Showgrounds area, and that proposed zoning changes in the Showgrounds area will
adversely affect existing property rights by reducing the types of permitted activities
in some areas. Opposing views suggest that the existence of certain consented
activities in areas is not justification for allowing further developments, which may be
to the detriment of the CBD.
Changes in zoning of Showgrounds land: Some submissions tend to favour retaining
the current Enterprise zoning, or creating a new Business 6 zoning which would be
8similar in scope to the Enterprise zoning. Opposing submissions oppose retention of
the Enterprise Sub-Area or creating a Business 6 zone and state that many businesses
locating in that area now are more suited to a CBD or fringe CBD location.
CBD capacity: Some submissions suggest that the Showgrounds area provides for
businesses that would have difficulties locating in the City centre (e.g. for reasons of
tenancy size and car parking requirements, etc.), and that there are difficulties in
expanding existing assets in the current zones due to land ownership fragmentation
issues. Opposing submissions state that there is significant capacity for new
development in and on the fringe of the CBD.
Business 3 zoning: The proposed Business 3 zoning should not be unduly restrictive in
terms of the types of commercial land use activities permitted.
Activities in Industrial zones: Non-industrial activities, including retail, should be
discouraged from locating in the Industrial zone. This will reduce reverse sensitivity
issues in industrial zones and limit retail spread throughout Invercargill.
The key submissions are summarised in Appendix 1.
Objective and Scope
This report assesses the economic effects of certain zoning changes that would be created by
the PDP. The scope of the assessment has been guided by the key issues identified during the
submissions process to the PDP, as discussed above.
Those key issues focus on the proposed zoning change in three areas: the Showgrounds (west
of the CBD) and the areas along Dee and Clyde Streets (north and south of the CBD) which are
currently zoned Enterprise Sub-Area, and in which a broad range of retail and commercial
activities are currently Permitted. The PDP would change:
zoning for the Showgrounds to Industrial 1, and change the activity status of many
retail and commercial activities in that area from Permitted to Discretionary, and;
zoning along Dee and Clyde Streets to Business 3, which would result in slightly more
restrictive rules about which retail and commercial activities are Permitted in the area.
Within this scope, the objective of this report is to answer two key questions:
Are the objectives of the PDP appropriate to meet the overarching purpose of the
Resource Management Act (RMA)?
Are the rules and policies of the PDP appropriate to meet the objectives of the PDP?
Of particular interest is the degree to which the zoning provisions as notified would support
the CBD, and in particular, whether those notified provisions would better satisfy the
objectives of the District Plan than either the Operative provisions or the proposed
alternatives put forward by submitters. The relativity of the economic outcomes under each
9scenario (ODP vs PDP vs submitter proposed alternatives) is important in the RMA context,
where the most appropriate option is to be preferred.
This assessment is not a full cost-benefit assessment taking into account all of the social and
economic costs and benefits of each scenario, although these factors are addressed in
qualitative terms in section 7.
102 Methodology
The key to assessing the economic effects of the proposed zone changes is understanding the
current and future demand for and supply of retail and commercial space in Invercargill, and
presenting different scenarios relating to where that demand might locate. Those scenarios
will provide a basis for assessing the effects of the different zoning options on various locations
in Invercargill:
the relative economic effects of more or less restrictive retail and commercial rules in
the Showgrounds;
the consequent effect of those alternative (Showground) rules on the CBD;
the effect of retaining the Enterprise Sub-Area on the CBD and broader City.
This section outlines the methodology used in this assessment, including assumptions,
scenario definitions and data origins.
Population and Household Projections
ICC have provided to M.E the population projections used in their planning. Those projections
are the Statistics NZ (SNZ) Medium growth scenario projections, published in October 2012.
Recently (February 2015) Statistics NZ have published population projections that have been
re-based to take into account the findings of the 2013 Census. We have used those 2015
projections as the basis for this assessment, as they are the most recent and up-to-date
projections available. We describe below how those projections have been applied in this
study.
SNZ periodically update their population and household projections, with updates for the two
variables released at different times, and updates for different levels of geography released at
still other times. For the purposes of this assessment we have:
Taken the ICC-level population estimates and projections as to be those published by
SNZ in February 2015 (2013-base).
Applied the population per household estimates for each future year from the
previous SNZ releases (pre-2013 Census) to the 2013-base population projections to
get ICC-level 2013-base household projections.
Spatially distributed (to meshblock level) the TA-level population and household
projections in line with the distribution described in pre-2013 Census projections.
2013-base sub-TA level projections will not be available until late in 2015.
The household projections are used as the driver of the demand projections, as discussed
below.
11Employment Projections
Employment projections for this assessment have been sourced from M.E’s Economic Futures
Model (EFM, see Appendix 2). The employment projections are used as the core driver of
future floorspace requirements in Invercargill. Projections in the model are presented for 48
economic sectors, and for every five years from 2016 to 2031. For the purposes of this
assessment a 2036 projection has been extrapolated based on (EFM) modelled trends and
population projections. The unit of employment used in this assessment is a Modified
Employment Count (MEC), which counts all paid employees and all working proprietors, and
is calculated using Statistics NZ Business Frame and Linked Employer-Employee Data (LEED).
Retail Demand Projections
Retail demand projections (in dollar terms) for this assessment have been sourced from M.E’s
Market Meter projections model (see Appendix 2), and are based on the household
projections discussed above in section 2.1. Projections are made for 42 retail categories, which
for the purposes of this assessment are grouped to storetypes, as follows:
Food and Liquor: supermarkets, fresh produce, meat and fish, other food and liquor.
Comparison Retail: apparel, furniture, appliances, sporting goods, department stores,
jewellery, books, toys and games, second-hand stores, pharmacies, housewares.
Hospitality: takeaways, cafes, restaurants, bars and clubs.
Automotive: retailing of cars and other motor vehicles and parts, fuel and tyres.
Other Retail: hardware, garden centres, marine equipment.
Floorspace Demand Projections
The retail demand projections (in dollar terms) and the employment projections have been
converted into floorspace equivalents for this assessment. That process applies regional
floorspace productivity factors (as described in Appendix 2) to the estimates of economic
growth (employment per section 2.2, and retail per section 2.3) generated within Invercargill
to quantify the total sustainable floorspace the future population of Invercargill will support.
For this assessment we present floorspace projections grouped to aggregate sectors. These
groupings are:
Core retail and services: All household services, hospitality (cafes, bars, restaurants
etc.), and most types of retail (excluding Automotive and Out of Centre (OOC) retail).
These estimates come from the retail demand projections.
Community and recreation services: Includes libraries, local government, social
assistance services, accommodation, museums gyms etc.
12 Automotive and Out of Centre (OOC) retail: car and other vehicle retail, service
stations, automotive parts, hardware and building supplies, garden centres and
marine equipment.
Offices: Office floorspace is calculated as a proportion of the total space occupied by
other industries not listed above, using data from the EFM (Appendix 2). Office space
therefore reflects a land use, rather than a particular economic sector, although
accounts for most or all of the space occupied by certain industries (e.g. finance,
accounting and insurance), and very little by others (e.g. agriculture, manufacturing).
Industry: Industry floorspace is calculated similarly to office floorspace, although
includes space-extensive warehouses and yard space rather than just internal built
space. As with offices, this category includes most or all of the space in some sectors
(manufacturing, transport, storage).
Other sectors such as rural and mining operate predominantly outside. The floorspace
projections applied make some allowance for these sectors to occupy built space in
the offices or industrial categories.
Of these groups we have categorised three (core retail and services, office and community and
recreation services) as ‘Centre-Dominant Sectors’ based on their distribution inside or outside
Invercargill’s centres. The other sectors are more commonly found outside centres,
notwithstanding that there is a significant amount of industrial space in the Business 1 zone
(CBD). These data exclude residential land uses, although make allowance for home-based
employment given the location of employment in residential zones.
Given the slow growth projected in Invercargill household numbers, and the consequent
stability in the distribution of households throughout Invercargill (section 5.1), we have
assumed for the Status Quo scenario that any growth in floorspace will be evenly distributed
across existing centres pro rata to their current market share (within each of the 42 retail
categories). That is, in the absence of any new quantum of supply, the floorspace sustainable
within each retail destination will increase at the same rate.
133 PDP Objectives
The PDP would apply somewhat more restrictive rules about where in Invercargill some
activities can locate than exist in the ODP. This section summarises the proposed objectives,
policies and rules that are intended to give effect to that objective.
Business Zones
3.1.1 Business 1 (Central Business District) Zone
The Business 1 zone is designed to enable a wide range of activities in the CBD. The ICC has
identified that the primacy of the CBD is under threat from non-CBD development, and the
PDP aims to maintain and enhance the CBD as the primary centre for retailing, business,
culture and entertainment services, as well as accommodating inner city residential, while
avoiding adverse effects from non-complementary activities such as heavy industry. Permitted
activities in the Business 1 Zone include commercial recreation, professional and personal
services, retail and hospitality. Non complying activities include heavy industry and any activity
that is not a permitted activity and is over 5,000m2 total floorspace.
The objectives relating to this zone are:
Objective 1: Maintenance and enhancement of the primacy of the Invercargill Central
Business District as the primary centre for retailing, business, culture and
entertainment services for Invercargill city and the wider Southland region.
Objective 2: Inner city living is part of the land use mix within the Invercargill Central
Business District other than in the Entertainment Precinct.
Objective 3: Identification, maintenance and enhancement of the amenity values of
the Business 1 Zone.
Objective 4: Protection of the heritage values of the Central Business District.
Objective 5: An holistic approach to economic, social and geographical issues in the
Central Business District is complemented through the District Plan.
The key policy relevant to this assessment is:
Policy 1 Business 1 CBD Zone: To establish and implement a Business 1 Zone to retain
existing and encourage new commercial/retail activities in the Central Business
District.
Explanation: Maintaining and reinforcing the viability and vibrancy of
Invercargill’s city centre is of widespread concern to the Invercargill people
and is a key priority for the Council. Specific provisions in the District Plan
are one method of many that the Council has chosen to address this issue.
143.1.2 Business 2 (Suburban Shopping and Business) Zone
The Business 2 zone is intended to accommodate a similar range of activities to the CBD, but
at a smaller scale to service suburban community catchments. There are five Business 2
centres in the City, at Waikiwi, Windsor, Glengarry, South City and Bluff, and most parts of the
urban area are within 10 minutes’ walk or easy driving distance from them. They are seen as
focal points for businesses such as supermarkets and cafes which have a local clientele. As
with the CBD, the PDP identifies as an issue that suburban centres are at risk from the dispersal
of commercial activity.
The objectives relating to this zone are:
Objective 1: A range of business, commercial, cultural and social activities serving
communities within the catchments of the Waikiwi, Windsor, Glengarry, and South
City suburban centres, and Bluff town centre.
Objective 2: To identify, maintain and enhance the amenity values of the Business 2
Zone.
3.1.3 Business 3 (Specialist Commercial) Zone
The Business 3 zone provides for commercial activities and service-oriented industrial
activities which require a central or convenient location but not necessarily the amenities
offered by the Business 1 Zone. The zones are intended for destination retailing and services,
and will reflect existing commercial uses on access routes to the CBD and enable greenfield
development close to the CBD. Business 3 zones are easily accessible by car but not intended
to be pedestrian-friendly. Permitted activities include: community services, supermarkets,
retail from premises of up to 400m2, childcare, light industry, takeaway food and service
stations. Heavy industry activities, shopping malls and noise sensitive activities are all non-
complying.
The objectives relating to this zone are:
Objective 1: The maintenance and ongoing improvement and development of the
zoned areas for “destination” specialist retailing, wholesaling and other service
oriented activities, conveniently located adjacent or near to the city centre and easy
to access by motor vehicle.
Objective 2: Provision for a range of “destination” commercial activities and service
oriented industrial activities which require a central or convenient location but are not
necessarily appropriate within the compact Business 1 Zone.
Objective 3: Maintenance of the primacy of the Business 1 Zone by making a clear
distinction between the activities that can locate as of right in a pedestrian friendly
environment conducive to gathering, socialising and comparison shopping, and those
that locate as of right in the Business 3 Zone which is vehicle oriented and
“destination” in character.
15 Objective 4: The identification, maintenance and enhancement of the amenity values
of the Business 3 Zone.
3.1.4 Business 4 (Neighbourhood Shop) Zone
The Business 4 zone recognises the groups of shops that have established historically
throughout the City in response to demand for local convenience shops and services. Changes
in transport and retailing patterns mean that these small groups of shops remain with a wide
variety of uses, including convenience retailing, community services and nursery enterprises
with low levels of effects. The PDP aims to maintain and develop convenience retailing and
services businesses in these existing groups of shops for the ongoing benefit of the local
community. Permitted activities include community services, healthcare, small-scale light
industry (no more than three employees), professional and personal services, retail (excluding
supermarkets and shopping malls), all with limited hours of opening and size (less than 300m2
premises).
The objectives relating to this zone are:
Objective 1: The maintenance and ongoing development of the zoned areas for
“convenience” retailing and other businesses offering day to day services to the
neighbourhood.
Objective 2: Groupings of small retail enterprises and other businesses serving a local
community and located in existing groups of shop type buildings in the residential area
of Invercargill.
Objective 3: Identification, maintenance and enhancement of the amenity values of
the Business 4 Zone.
3.1.5 Business 5 (Rural Service) Zone
This zone provides for services for the rural sector, enabling such activities to be situated
nearby the built up areas of the city. These rural services businesses require large amounts of
storage and display space and do not normally attract large numbers of clients at any one
time, and need to be easily accessed by trucks and vehicles with trailers.
Industrial Zones
Four Industrial zones (Light Industry; Light Industry (Marine); Urban Industry; Large Industry;
Awarua) have been identified to reflect the varying nature of industrial activity within
Invercargill.
3.2.1 Industrial 1 (Light) and Industrial 1A (Marine) Zones
The PDP aims to encourage light industry (which includes, warehousing, storage, wholesaling
and service activities) to group in specified areas, rather than having it disperse throughout
the City, so as to avoid the nuisance that this type of activity can create. Permitted activities
within this zone are essential services, light industry, motor vehicle sales, takeaway food
16premises (no larger than 150m2) and land transport facilities, with limited operating hours.
Heavy industry activities are non-complying, and other activities are discretionary. The 1A
(Marine) zone specially relates to areas within Bluff Harbour.
The objectives relating to this zone are:
Objective 1: The ongoing maintenance and development of the zoned areas for light
industry within the built up area of the Invercargill city district is provided for and
encouraged.
Objective 2: A range of light industrial activities including depots, wholesaling,
warehousing, service activities and ancillary retailing are enabled to locate near or
adjacent to, but not scattered throughout residential areas.
Objective 3: The amenity values of the Industrial 1 Zone are identified, maintained and
enhanced.
The key policy relevant to this assessment is:
Policy 1 Industrial 1 (Light) Zone: To provide for a range of light industrial, wholesaling,
warehousing and service activities of a nature, size and scale appropriate near
residential areas, operating within the normal working day (7.00 am – 10.00 pm) and
requiring sites of less than one hectare.
Explanation: The Industrial 1 Zones have been identified as areas of the
district that can sustain industrial activities that are good neighbours to
adjoining residential areas in terms of environmental effects.
The hours which an activity operates can determine the level of adverse
effects likely for neighbours as a result of vehicle and pedestrian
movements, noise levels, loss of privacy and security and general
disturbance.
The activities carried out within the Industrial 1 Zones are to be of a scale
appropriate to the urban environment.
3.2.2 Industrial 2 (Urban) Zone
This zone provides for the range of industrial, wholesaling, warehousing and service activities,
including limited ancillary retailing, associated with Invercargill’s role as a provincial servicing
city. This zone provides for larger buildings than in Zone 1, and allows for 24 hour operation.
Heavy industry is permitted in this zone.
3.2.3 Industrial 3 (Large) Zone
This zone is an important part of ensuring Invercargill’s ongoing economic growth. Industrial
3 Zones provide land use for large industrial, processing, warehousing, service and transport
activities, which may need to operate 24 hours a day. These large industries add value to
primary produce and are therefore important to the regional economy, but may not be
17compatible with amenity in surrounding zones. Permitted activities include: agriculture,
essential services, freight depot, land transport facility, light and heavy industry, facilities for
animal husbandry, takeaway food premises and sale and storage of fuel. The minimum site
area is one hectare (other than takeaway food premises).
3.2.4 Industrial 4 (Awarua) Zone
Land adjacent to an existing Industrial 3 Zone at Awarua has been zoned for large industry in
anticipation of development. Permitted activities are similar to the Industrial 3 zone.
184 RMA and Importance of Centres
RMA Purpose
The first key question addressed in this assessment is to establish whether the objectives of
the PDP are appropriate to meet the overarching purpose of the Resource Management Act.
That purpose is to promote the sustainable management of natural and physical resources
by1:
managing the use, development, and protection of natural and physical
resources in a way, or at a rate, which enables people and communities to
provide for their social, economic, and cultural well-being
The management of urban form, especially with respect to the function and location of retail
and commercial centres is key to this purpose, as explained in this section.
Role of Town Centres
The location of retail and office activity in Invercargill is a significant issue in RMA terms. The
purposes of the Act are directly and indirectly affected by the location of retail and associated
household service activity and office space. This is because the location patterns of these
activities are a major influence on urban form and function, travel efficiency, and on how the
urban environment delivers amenity. RMA case law has frequently recognised the role of
centres as providers of social and functional amenity and enablers of communities’ wellbeing.
Amenity arises from the functional and social roles of centres, and is directly affected by
patterns of retail and commercial activity.
To understand how these benefits of centres arise, it is important to understand the roles of
centres, and how they meet economic and community needs. Almost all towns and cities have
one main centre (the CBD), where businesses and community services have aggregated to
access and serve both the community and the business/government sector. This urban form
is common to western and other economies, in new towns and old and emerged well before
statutory planning existed. It is a core feature of urban economies, and persists because this
urban form best meets the needs of both the business sector and the community.
Benefits from Centres
The benefits from centres stem from the co-location and concentration of similar or related
activities, and so are largely common to all centres and business areas, although the level of
benefit is generally higher in larger centres. The business sector benefits from co-location of
activities, because of the ability to access customers and suppliers, share facilities and
infrastructure, and achieve economies of scope and scale. This applies to commercial
1 Section 5
19activities, retail, service and hospitality businesses, and enhances transactional efficiency,
since the costs of doing business with other firms is lower than if activities are spatially
dispersed.
Further, there are gains to business from interaction with other businesses and people, which
is generally easiest (most efficient) when activities are spatially grouped. There are also
efficiency gains to businesses from economies of scale and scope, achieved in larger
businesses which can draw on wider catchments. These arise especially from the opportunities
for specialisation of activities and people, and means that larger centres are generally
associated with higher levels of business efficiency and a greater range and depth of goods
and services available.
There are related advantages for the business sector from co-location with other activities,
which are not necessarily directly related to the business activity but are benefits to the
workforce (including owners). Thus, convenient access to shops, services and hospitality
outlets close to the work place, and from opportunities for social interaction with others
working nearby, act together to enhance the attractiveness of businesses as places to work.
These are agglomeration benefits, and relate to the benefits which firms gain from co-location,
from economies of scale and network effects, and the effects of clustering to attract more
customers and suppliers. They are a key driver in urban growth, as towns and cities form and
grow to take advantage of these economies of agglomeration.
The community also derives benefit from centres. In addition to the functional amenity of
convenient access to goods and services in one location, and having greater choice and ability
to compare among providers, town centres provide less tangible benefits such as
opportunities for social interaction, a sense of place and community belonging (social
amenity). Both aspects of amenity contribute to community social and economic well-being,
in terms of the RMA.
Benefits and Centre Size
Larger centres generally provide larger benefits. The typical pattern is for the first established
centre to remain the largest and maintain its pre-eminent role, even though new local centres
will attract shares of local growth as a town increases in size. The critical point is that as centres
grow in size, they are able to sustain an increasingly wide range of activities, and increasing
specialisation of goods and services, so expanding the opportunity available to businesses and
consumers in their catchment. As a consequence, the town or city centre is a major source of
amenity in the urban environment.
If the same scale of people activity is shared between two or more centres, there is not the
same opportunity for specialisation. That is because retailers (and service, hospitality and
other outlets) in both centres need to capture a larger share of the available market to be
viable, and so tend to focus on the middle of the market. This is the reason that centres of
similar size tend to have similar retail and service offers – there is less potential there for
specialised outlets which would need to access the total urban market to be viable.
20As a consequence, the range, depth and variety of goods and services available to a
community depends not just on the total level of people activity from all centres within the
town or city, but also on the size of the largest centre within the town. In Invercargill, the CBD
accommodates almost a majority of the retail and commercial activity, and has an important
role in providing the 'centres-based' amenity to the urban and rural community.
Sustainability
The pattern of retail activity in a town or city also has a material effect on travel and transport
efficiency, and therefore on sustainability. Generally, concentration of retail and service
activities into relatively few locations results in more efficient travel, as there is greater
opportunity for one-stop, multi-purpose vehicle trips. Where shops are dispersed or split
between centres, multi-stop or multiple trips are more likely.
The economics of the retail sector means only a finite number of outlets can be sustained, so
that consumers have limited choice among shopping destinations available. The location
decisions of developers and retailers are the key determinant of consumer travel patterns,
especially decisions to locate in edge-of-town or 'out-of-centre' locations which affect
destination choice and the ability of consumers to make multi-purpose shopping trips.
Providing for Community Needs
A key objective of the PDP is to maintain the primacy of the Invercargill CBD as a shopping and
commercial destination within the City. Further objectives relate to maintaining and
enhancing the amenity provided to the community in Invercargill’s other centres, in the
Business 2 zones.
These objectives relate to the principles contained in section 5 of the RMA, given the role
centres play in providing for their community, as described above. They reflect the key aspects
of town centre roles and recognise the benefits and amenity which town centres in general
provide, and seek to have the Invercargill CBD continue to provide such benefit to the
community in the future. The Plan is explicit that the existing town centres will have this role.
The PDP is the appropriate starting point. In this case, the objectives, policies and explanations
contained in the PDP indicate that location options for retail and related development have
been considered, and taking into account knowledge of the underlying economic processes
and the likely effects. The direction adopted in the Plan, explicitly, is to concentrate retail and
related activity in the Business 1, Business 2 and Business 3 zones in order to achieve
community and economic benefits, and to avoid adverse effects. In our opinion the provisions
and explanations contained in the PDP are consistent with both the literature and practical
experience, and the PDP’s objectives relating to the location of retail and commercial activity
in Invercargill are appropriate to meet the purpose of the RMA.
215 Current and Projected Demand
The second key question addressed in this assessment is to establish which zoning scenario is
most appropriate to meet the objectives of the PDP. The remainder of this report addresses
that question.
To understand the potential effects of the zoning proposed in the PDP, and the alternative
zoning put forward in submissions, it is first necessary to understand the demand environment
for the types of economic activity that will be affected by that zoning. This section summarises
the current and projected quantum of demand in terms of household counts and spending,
employment and floorspace.
Population and Households
The most recent population projections published by SNZ indicate that just over 53,000 people
live in Invercargill City District, in an estimated 22,700 households. Slow population growth is
expected in the future, with a peak population in the next three decades of 55,600 in 2031.
Average annual growth out to 2036 is projected to be under 100 people, although much of
this will occur between 2016 and 2021, with a post-2031 decline expected (Figure 5.1).
Figure 5.1: Invercargill City District Demographic Projections
Growth 2013-2036
2013 2016 2021 2026 2031 2036
n %
Population 53,200 54,000 55,000 55,400 55,600 55,400 2,200 4%
Households 22,700 23,200 24,000 24,700 25,400 25,900 3,200 14%
Pop/household 2.3 2.3 2.3 2.2 2.2 2.1 - 0.2 -9%
Household numbers are expected to increase at a somewhat faster rate given the projected
aging population in Invercargill, as in the rest of the country. This aging population will be one
of the core drivers of a declining average household size, which is projected to require more
households to accommodate the same number of people in the future due to the changing
housing demands of the population. This will mean that while population is projected to
increase by 4% out to 2036, household numbers are projected to grow by 14%, from 22,700
to 25,900.
Our assessment of the projected distribution of growth concluded that there is not expected
to be any substantive change in any single area’s population or household numbers, and rather
that growth is expected to be relatively evenly distributed around the City.
The population of surrounding districts (Gore and Southland) is projected by SNZ to be
relatively static, and under low projections scenarios to decline. This is static population would
not support any noticeable change in the amount of commercial floorspace supported in those
areas, and Invercargill will therefore remain the Region’s largest commercial centre.
22ISEM Data
This assessment uses the PDP zoning to describe the spatial location of activity in Invercargill
as a base against which to assess potential changes in floorspace location and consequent
impacts on centres.
5.2.1 Current
The Invercargill CBD is the dominant business location within the City, and is the location of
over half (55%) of total City floorspace in core retail, hospitality, services and office space
(151,000m2 out of 276,000m2) (Figure 5.2). The next largest amounts of floorspace in the
centre-dominant sectors are located in the PDP Business 3 zone (20,000m2), Business 2 zone
(18,000m2 across five centres), and the Industrial 2 zone (16,000m2 across eight locations).
Figure 5.2: Invercargill Floorspace Distribution (GFA, m2)
Core Retail Community Centre- Automotive Other
Total All
and Office and rec. Dominant and OOC** (industrial
Land Uses
Services* services Sectors retail etc)
CBD 63,900 70,000 16,900 150,800 10,500 127,700 289,000
Business 2 16,000 1,600 200 17,800 1,400 20,300 39,500
Business 3 10,700 6,700 2,700 20,100 19,900 64,500 104,500
Business 4 4,700 1,200 1,900 7,800 2,000 11,100 20,900
Business 5 400 200 - 600 - 2,100 2,700
Industrial 1 1,500 4,800 600 6,900 3,500 45,500 55,900
Industrial 1A - 100 100 200 - 11,900 12,100
Industrial 2 5,200 8,800 1,700 15,700 16,200 154,800 186,700
Industrial 3 - 400 - 400 - 49,700 50,100
Industrial 4 - 300 - 300 - 100 400
Special Areas 1,800 8,100 - 9,900 300 108,800 119,000
Other Areas 18,800 15,500 11,900 46,200 6,800 206,300 259,300
Total 123,000 117,700 36,000 276,700 60,600 802,800 1,140,100
* All household services, hospitality (cafes, bars, restaurants etc.), and retail (excluding Automotive and OOC retail)
** Out of Centre retail
The largest amounts of non-centre-type space are located in the Industrial 2 zone (171,000m2),
CBD (Business 1 zone, 138,000m2), and Business 3 zone (85,000m2).
5.2.2 Historic
This distribution of economic activity has changed over time. Below is a time series of
employment in Invercargill City, by location. The data shows that employment in centre-
dominant sectors:
23You can also read