Proposed City of Lost Mountain - Fiscal Feasibility Study October, 2021
←
→
Page content transcription
If your browser does not render page correctly, please read the page content below
Proposed City of Lost
       Mountain
 Fiscal Feasibility Study

         October, 2021

               0
Table of Contents
Executive Summary....................................................................................................................................... 1
Introduction .................................................................................................................................................. 2
Revenues ....................................................................................................................................................... 3
Special Considerations and Assumptions ............................................................................................. 4
A. Revenues Related to Various Commercial Activities ........................................................................ 5
Occupation Taxes .................................................................................................................................. 6
Alcoholic Beverage Excise Taxes ........................................................................................................... 6
Development Fund Zoning and Variance Fees and Permits ................................................................. 6
B. Methodologies Utilizing Ratios of the Population in the Study Area to the Unincorporated Area ..... 6
Parks and Recreational Fees ................................................................................................................. 8
C. Franchise Fees ....................................................................................................................................... 8
Franchise Fees – Cable .......................................................................................................................... 8
Franchise Fees – Electric ....................................................................................................................... 8
Franchise Fees – Natural Gas ................................................................................................................ 9
Franchise Fees – Phone......................................................................................................................... 9
D. Typical Municipal Revenues Not Estimated ......................................................................................... 9
Local Option Sales Taxes ....................................................................................................................... 9
Local Excise Tax on Energy Used in Manufacturing .............................................................................. 9
Hotel/Motel Taxes ................................................................................................................................ 9
Bank Shares Taxes ............................................................................................................................... 10
Intangible and Real Estate Transfer Taxes .......................................................................................... 10
Real Property Taxes ............................................................................................................................ 10
Personal Property Taxes ..................................................................................................................... 10
Community Development Block Grant ............................................................................................... 10
Special Purpose Local Option Sales Taxes........................................................................................... 11
Service Delivery Strategy Payments.................................................................................................... 12
Expenditures ............................................................................................................................................... 12
Direct and Indirect Services .................................................................................................................... 14
Direct Expenditures............................................................................................................................. 15
Contingency Fund ............................................................................................................................... 20
Indirect Services and Cost Calculation .................................................................................................... 20
1Estimating a Ratio of Direct-to-Indirect Costs .................................................................................... 21
Capital Costs............................................................................................................................................ 22
Annual Capital ..................................................................................................................................... 22
Start-up Capital ................................................................................................................................... 24
Capital for Park Acquisition ................................................................................................................. 25
Summary of Capital Costs ................................................................................................................... 25
Facility Costs............................................................................................................................................ 25
Enterprise Services: Sanitation ............................................................................................................... 27
Solid Waste ......................................................................................................................................... 28
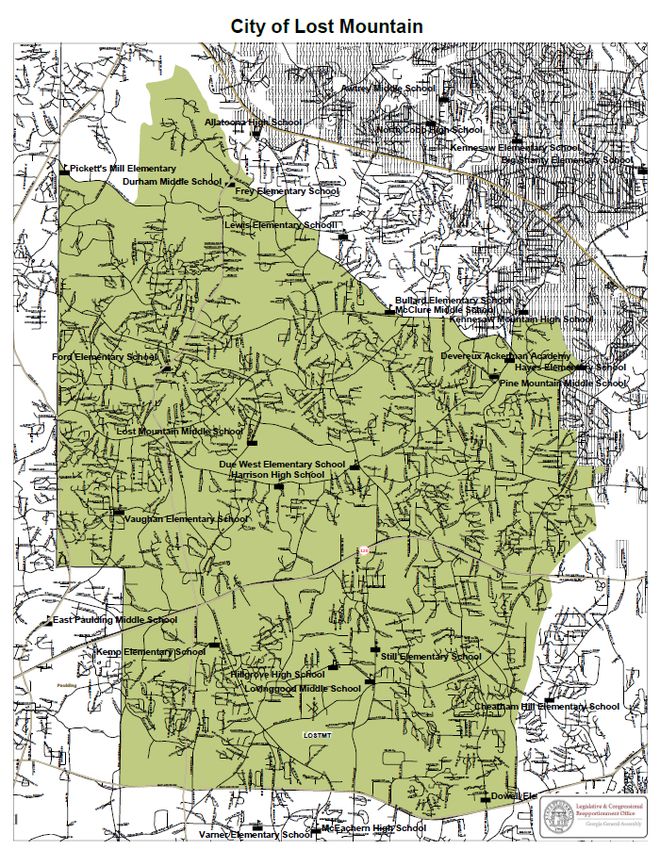
Appendix A. Map of the Study Area............................................................................................................ 29
Appendix B. Regression Output .................................................................................................................. 30
2Executive Summary
Over the last several years, the University of Georgia’s Carl Vinson Institute of Government has
conducted a number of feasibility studies for proposed incorporations. Those studies, like this
one, have been designed to provide the groups and legislators that have commissioned them an
opportunity to investigate the potential fiscal feasibility of an area being considered for
municipal incorporation. Essentially, the studies seek to determine whether the services sought
to be provided by a hypothetical city, along with the necessary administrative apparatus, can be
adequately funded by the revenues that would be available. The House of Representatives’
Governmental Affairs Committee of the Georgia General Assembly has required by committee
rule that bills proposing incorporation have a feasibility study conducted before they can be
finally considered. The committee has named the Institute of Government as one of the
university institutions qualified to conduct such studies.
To determine available revenues, the Institute of Government research team looked at the
amounts of revenue being paid to the county government currently providing services to the
area under study and any revenue streams uniquely available to municipalities such as
franchise fees. To determine the likely operational expenses associated with providing planning
and zoning, code enforcement, solid waste, parks and recreation, and basic administrative costs,
as well as capital costs associated with those services and administration, the research team
looked at three comparison governments in the metro Atlanta area, the City of Smyrna, the City
of Marietta, and the City of Peachtree Corners.
It is important to note the limitations of these types of studies. They cannot predict every
possible variable that may occur in the future that could potentially impact the costs of
government. Additionally, the study is not intended to provide a model budget for a new city.
A newly elected city council will endeavor to represent its constituencies with a set of priorities
that may impact both taxing and spending patterns.
The Institute of Government is confident, however, that looking at currently available revenues
and analyzing comparable municipal government spending, the methodology used in this
study, reflects a realistic assessment of likely fiscal feasibility. Table 1 shows a summary of
estimated revenues and expenditures for the study area in question. Based on this analysis, the
Institute of Government research team finds that likely available revenues exceed likely
expenditures for the services identified to be provided, and therefore conclude that a city
comprising the Lost Mountain study area is fiscally feasible.
1Table 1. Summary of Estimated Revenues and Expenditures
Item Study Area
Annual Expenses $8,541,440
Annualized Capital Expenses $619,634
Total Annual Operating Expenses $9,161,074
Total Annual Revenues $12,535,215
Total Annual Revenues Less Expenses
$3,374,141
(Surplus)
Introduction
Preserve West Cobb, Inc. and State Representative Ginny Ehrhart engaged the University of
Georgia’s Carl Vinson Institute of Government to study an area within unincorporated Cobb
County to aid their consideration of the area’s possible incorporation. Lost Mountain, referred
to as the “study area” in this report, is situated in the western part of Cobb County. The study
area comprises the central western portion of Cobb County. The western boundary is the border
between Cobb County and Paulding County. The southern boundary of the study area tracks
the northern side of Macland Road. The northern and eastern boundaries for the most part track
Old Stilesboro Road, the city limits of the City of Kennesaw, and Barrett Parkway. See
Appendix A for a map of the study area. The 2020 census population of the area is 74,619.
This report provides estimates of revenues and expenditures that a potential City of Lost
Mountain, if incorporated, could anticipate in providing certain municipal services for a single
fiscal year. The revenue estimates are primarily based upon actual revenues collected for the
unincorporated area by Cobb County in fiscal year (FY) 2020 as well as projections for franchise
fees and other revenues. Expenditure estimates are primarily based on costs for services in the
cities of Marietta, Smyrna, and Peachtree Corners. For each city that was used to establish cost
estimates, the Institute of Government faculty examined its budget documents and
communicated with city staff about the proper allocation of certain costs and to clarify figures
and line items reported in their budgets.
The cities of Marietta and Smyrna were selected at the outset of the study to be used as the
primary comparisons for expenditure purposes. These cities are the most similar in size to the
study area of all cities located in Cobb County. The most recent budget documents from each
city were used to estimate costs (typically budget documents for FYs 19 and 20). Because the
proposed new city is projected to only provide a limited set of municipal services, for some
expenditure estimates, the City of Peachtree Corners was used as a comparison because it is a
new city of comparable size in the metro Atlanta area that provides a limited set of services. The
2research team believes these were the best available data during the time the study was
conducted.
Estimates given in this report are based on tax levies and service levels for a city not yet created;
thus, they should not be viewed as certainties. Also note that the research team took a
purposely conservative approach to assessing fiscal viability. This conservative approach
involves providing lower estimates of revenues and higher estimates of expenditures in cases
where an alternative approach might provide higher revenue estimates and lower expenditure
estimates. While the research team hopes that this report assists with the public consideration of
a potential municipal incorporation, it should not be construed to constitute a position either for
or against the establishment of a City of Lost Mountain by the Carl Vinson Institute of
Government.
Revenues
The revenue estimates outlined below include all major revenue sources a city representing the
study area would have collected had it existed in 2020 and assessed taxes and fees at rates
similar to Cobb County in that same period. Most of the revenue analysis is based on revenue
collections by Cobb County in FY 2020. The analysis uses the most recent available data to
capture the most current revenue climate in the area under study. Note, however, that the
amount of revenue generated from different sources can vary from year to year due to a variety
of factors. In calculating these estimates, the Institute of Government researchers applied
metrics used in prior research that were accepted by stakeholders in some of the most recent
incorporation studies. Thus, to the extent possible, this report uses similar revenue estimation
methodologies as those provided in both Georgia State University’s 2007 report, The Fiscal
Impact on DeKalb County with Possible Incorporation of Dunwoody, Georgia and the Carl Vinson
Institute of Government’s 2008 report, Revenue and Expenditure Analysis of a Proposed City of
Dunwoody. The method for determining how much revenue was assigned as coming from the
study area is described in Table 2.
3Special Considerations and Assumptions
For the purposes of this analysis, the proposed City of Lost Mountain is assumed to provide
only the following limited set of services: planning and zoning, code enforcement, parks and
recreation, and sanitation/solid waste (to be provided through either an enterprise fund or
franchise arrangement). Because the proposed city would not be providing some of the more
expensive services such as fire protection or law enforcement, and because some of the services
to be provided (e.g., building permitting and recreation programs) involve service charges that
can generate revenue, it is assumed that the proposed new city would not levy a property tax.
Also, because the proposed new city is not assumed to levy a property tax, it would also not be
eligible to receive revenue from real estate transfer taxes or intangible taxes.
Another special consideration is the potential for the new city to receive revenue from the
county to address the issue of double taxation. Counties in Georgia are required by law to not
“double tax” municipal taxpayers, i.e., tax municipal tax payers for municipal-type services that
these taxpayers only receive from the city government. That is, because city taxpayers pay a
municipal tax for these same services, they should not also have to pay the county for service
they receive from the city. To address this prohibition of double taxation, many counties in
Georgia have created a special tax district comprising the unincorporated area. By applying a
property tax in this unincorporated area but not in the incorporated parts of the county, the
county government ensures that the municipal taxpayers are not taxed for municipal-type
services they do not receive from the county government. Cobb County has not addressed the
double taxation prohibition through the creation of a special tax district. Instead, the county
agreed to make yearly payments to the cities in Cobb County based on their respective property
tax digests. Whether the proposed new city can participate in this payment agreement is an
open question. Following the conservative fiscal analysis approach taken in this report, the
research team did not allocate any revenue from this potential revenue source.
4Table 2. Summary of Study Area Revenue Estimates
Revenue Source Data Source Amount
Occupation Taxes Actual amounts provided by Cobb County $1,101,487
Finance Department
Alcoholic Beverage Excise Taxes Actual amounts provided by Cobb County $31,672
Finance Department
Building and other Development Actual amounts provided by Cobb County $109,117
Permits Finance Department
Insurance Premiums Ratio of population in study area to $4,606,369
unincorporated area
Fines (Municipal Court) Estimated based on comparison with $14,303
Peachtree Corners' revenue
Motor Vehicle Tax Estimated based on shares of vehicle $2,090,010
values combined with population and
property value proportions
Parks and Recreation Fees Actual amounts as reported by Cobb $325,623
County Parks and Recreation Department
Franchise Fees Regression with data set of over 300 cities $4,257,176
Total Revenue Estimate $12,535,757
A. REVENUES RELATED TO VARIOUS COMMERCIAL ACTIVITIES
A number of taxes currently collected in the unincorporated area of Cobb County are generated
solely by commercial activity. Cobb County provided much of this data using geographic
information system (GIS) mapping. Table 3 illustrates the ratios of residential, commercial,
industrial, utility, and total assessed property value of the study area to the unincorporated area
in Cobb County.
5Table 3. 2020 Property Values in Study Area and Unincorporated Cobb
Unincorporated Percent Study Area
Study Area Cobb County to Unincorporated
AV Residential Property $3,866,550,947 $21,283,352,031 18%
AV Commercial Property $245,342,507 $9,249,599,683 2.7%
AV Commercial & Residential $4,111,893,454 $30,532,951,714 13.5%
AV Industrial Property $0 $146,896,313 0%
AV Utility Property* – $802,928,066 0.000%
AV Conservation Property $27,075,935 $84,459,078 32%
Total Assessed Value $4,138,969,389 $30,764,307,105* 13.5%
Note: AV=assess value.
*The Cobb County Tax Commissioner’s Office was not able to estimate the value of utility property in the study area.
Consequently, in developing percentages of assessed value of study area properties to the unincorporated area
properties, utility property and some other minor land-use classes were excluded.
Occupation Taxes
Occupation taxes are levied on persons and entities engaged in occupations or trades for profit-
making purposes. Cobb County levies an occupation tax in the unincorporated area.
Alcoholic Beverage Excise Taxes
Alcoholic beverage excise taxes are collected on individual retail sales of alcoholic beverages.
Development Fund Zoning and Variance Fees and Permits
Development fees are fees charged for permits related to development, such as plumbing,
electrical, HVAC, and building inspections. This figure also represents revenue collected from
applicants for zoning changes and variances.
B. METHODOLOGIES UTILIZING RATIOS OF THE POPULATION IN THE STUDY AREA TO
THE UNINCORPORATED AREA
A number of revenue sources depend more directly on the number of individuals engaging in
certain behaviors such as the purchase of insurance, watching cable television, and owning a
car. For these revenue sources, the research team assumed that these behaviors are fairly
constant across the unincorporated population of Cobb County; thus, the ratio of the population
of the study area to the entire unincorporated area was applied to the actual revenues. Table 4
gives the population figures for the study area and unincorporated Cobb County.
6Table 4. Demographic Figures for Study Area and Cobb County
Percent Study
Unincorporated Area to
Study Area Cobb County Unincorporated
Population (based on 2020 Census) 74,619 569,564 13.1%
Cobb County (entire)
Median Household Income $118,919 $77,932
Poverty Rate 3.8% 8.3%
Numbers other than population are from 2019 American Community Survey data.
Insurance Premiums Tax
Insurance premiums taxes are collected on policies written for both property and casualty and
life insurance policies purchased by those insured within the jurisdiction of a city or
unincorporated areas of a county.
Fines
Because the proposed new city does not currently plan to operate a police department, the
amount of fine revenue expected would be minimal as it would only include fines for building,
zoning, and code violations. The Institute research team utilized a comparison of data from
Peachtree Corners to estimate this revenue.
Motor Vehicles
Under the local title ad valorem tax (TAVT) fee, cities receive a 23% share of the local share of
TAVT revenues for vehicles registered in the city jurisdiction. The local share represents 65% of
the total TAVT revenue collected. The remaining 35% of the revenue is distributed to the state.
The estimation method involves the following steps:
• Identify the total TAVT revenue collected in the county in 2020: $137,201,696.
• Calculate the total local share of this revenue: $89,181,102.
• Reduce this share by 1% to account for administrative costs. Adjusted local share:
$88,289,291.
• Calculate the municipal share (assuming all areas of the county were incorporated):
$20,306,537.
• Using 2020 motor vehicle data (which includes assessed values of motor vehicles in each
jurisdiction), calculate the share of total county motor vehicle values that are attributed
to the unincorporated area. This share is: 77.76%.
• Estimate the value of the municipal share of the TAVT in the unincorporated area and
estimate the study area share of this unincorporated share using a per capita basis.
• Estimate the study area share of this unincorporated share using a property value basis.
• Take the average of these last two calculations.
7Table 5 shows the results.
Table 5. TAVT Collection for the Study Area
Estimated Value of Municipal
Share of TAVT in the $15,790,363
Unincorporated Area
Estimated Study Area Share $2,048,320
Based on Pop. Share
Estimated Study Area Share $2,131,699
Based on Property Values
Average of Methods $2,090,010
Parks and Recreational Fees
Because the proposed new city will provide recreation services, users of these services are
expected to partially pay for their provision. While the exact fee rates and user charges that the
new city would implement are not known, the research team could roughly estimate revenues
by assuming that the new city would implement fees and charges that are similar in scope to
those currently in place. Thus, the Institute research team requested and received fee revenue
data from the Cobb County Parks and Recreation Department for the programs and services
offered in the study area.
C. FRANCHISE FEES
Some revenue sources are unique to municipal corporations in Georgia. Franchise fees are
essentially rental compensation by a private utility company for use of a city’s public rights-of-
way. For estimating the electric, natural gas, cable, and telephone franchise fees, the Institute of
Government researchers used a regression model with franchise fees paid to over 300 cities in
Georgia in 2019, the latest data available. The data were only available as a total number for
franchise fees and were not broken down by type. The regression output is shown in Appendix
B.
Franchise Fees – Cable
Federal and state law allows cities and counties to enter into franchise agreements with cable
companies to compensate the local government for their use of public rights-of-way. These fees
are usually 5% of the revenue derived from cable television services.
Franchise Fees – Electric
Franchise fees for electric utilities are the result of contracts between municipal corporations
and electric utility providers that occupy a city’s rights-of-way. These agreements typically
provide that 4% of the gross sales of electric power within a city’s limits less sales taxes and fuel
8costs be paid annually to the city to compensate it for use and occupancy of public property.
The sole electric utility provider in the study area is Georgia Power. Pursuant to recent rulings
by the Georgia Public Service Commission, half of the annual franchise fee paid by Georgia
Power to municipal corporations is collected from the rate base of all Georgia Power customers
statewide (as a cost of doing business), and the other half is collected as a fee solely on the
electric bills of customers within the municipality collecting that fee. Thus, collection of the
electric franchise fee would result in an increase of approximately 2% in the electric bills of city
customers.
Franchise Fees – Natural Gas
Natural gas distribution utilities occupying public rights-of-way in the study area would be
subject to franchise fees for the use of these rights-of-way were the study area to become a
municipal corporation. Such franchise fees to cities are typically paid out of the rate base of all
natural gas customers as a cost of doing business.
Franchise Fees – Phone
Because only landline telephone service requires occupancy of municipal rights-of-way,
movement away from landline service to internet-based and cellphone services is making this a
diminishing revenue source for municipal corporations.
D. TYPICAL MUNICIPAL REVENUES NOT ESTIMATED
Local Option Sales Taxes
To receive a share of the local-option sales tax (LOST) revenue, a city must be qualified and the
county must choose to levy the tax. As Cobb County has not chosen to levy this tax, the
proposed new city would not receive any revenue of this type. Moreover, the currently
proposed list of services to be provided by the new city would not make it eligible to receive
LOST revenue were the county to choose to levy the tax.
Local Excise Tax on Energy Used in Manufacturing
The local excise tax on energy used in manufacturing is an optional local tax. The local excise
tax is levied at the same rate as local county/city sales taxes. The revenues from this tax are
shared between the county and the cities based upon the same proportional share each receives
from local sales taxes. Because Cobb County does not levy a sales tax, the proposed new city
would also not receive revenue from the local excise tax on energy.
Hotel/Motel Taxes
Hotel/motel taxes are collected based on a percentage of the nightly room rate charged by hotels
within the jurisdiction of a city or county that levies the tax. Cobb County levies a tax of 8% of
the nightly room rate (O.C.G.A. § 48-13-51 (a) 5.1). Because the research team did not locate any
hotels in the study area, no revenue was estimated for this tax.
9Bank Shares Taxes
Cities and counties are permitted to levy a tax on depository financial institutions that have
offices located in their respective jurisdictions. Currently, Cobb County does not levy a financial
institutions tax. While the proposed new city could levy such a tax, the research team did not
allocate revenue from this source to the new city based on an assumption that the new city
would have the same level of taxation as is currently the case in the unincorporated area.
Intangible and Real Estate Transfer Taxes
Real estate transfer and intangible taxes are levied on the transfer of real estate and on the
value of notes to secure debt backed by real estate. Revenue from these taxes is typically
divided among all taxing jurisdictions based on the proportion that the millage rate levied by
the jurisdiction bears to the total millage rate levied on that property. The research team
assumed that the proposed new city would not impose a property tax and as such would also
not receive any revenue from intangible and real estate transfer taxes.
Real Property Taxes
Cobb County does not levy a property tax that is exclusively used to provide for municipal-type
services to the unincorporated area, i.e., a tax that the study area taxpayers would no longer
have to pay once they were part of a municipality. Consequently, there is no basis on which to
allocate to the proposed new city a tax revenue amount that would be equivalent to the relief
from county property taxes these taxpayers would receive upon incorporation.
Personal Property Taxes
Personal property taxes are levied on personal property owned by commercial businesses. The
analysis assumes that the proposed new city would not impose a property tax and as such
would also not receive any revenue from personal property taxes.
Community Development Block Grant
Community development block grants (CDBG) are awarded by the federal and state
governments to local governments meeting certain criteria. According to the Georgia
Department of Community Affairs, “Eligible applicants selected for funding will be those
having the greatest need as evidenced by poverty and per capita income and whose
applications most adequately address the needs of low- and moderate-income persons and have
the greatest impact.” Cobb County has in recent years received some CDBG funding.
Based on the relatively low poverty rate and relatively high household income in the study
area, it is unlikely that the proposed new city would receive substantial and sustained CDBG
funding. As such, and in keeping with a conservative fiscal estimate, no CDBG funding is
included in the accounting of the study area’s fiscal viability.
10Special Purpose Local Option Sales Taxes
The special-purpose local-option sales tax (SPLOST) is a potential revenue source for local
governments; the use of the funds is restricted to capital projects. Cities and counties can
potentially both participate in SPLOST, but there is no guarantee that cities or any particular
city will receive either revenue or capital projects from this tax. Georgia law specifies the
following:
“Prior to the issuance of the call for the referendum and prior to the vote of a
county governing authority within a special district to impose the tax under this
part, such governing authority may enter into an intergovernmental agreement
with any or all of the qualified municipalities within the special district.” 1
For the purposes of the SPLOST tax, a "qualified municipality" means only those incorporated
municipalities that provide at least three of the following services, either directly or by contract:
law enforcement; fire protection (which may be furnished by a volunteer fire force) and fire
safety; road and street construction or maintenance; solid waste management; water supply or
distribution or both; waste-water treatment; storm-water collection and disposal; electric or gas
utility services; enforcement of building, housing, plumbing, and electrical codes and other
similar codes; planning and zoning; recreational facilities; or library. 2
Two distribution methods could potentially leave a city without a share of the SPLOST revenue
benefits:
1. If the county board of commissioners proposes to fund one or more Level One county
projects using SPLOST, and the Level One projects would consume 100% of the
estimated SPLOST revenues, no qualified municipality would receive SPLOST funds. 3
2. If the board of commissioners negotiates an intergovernmental contract to determine
the distribution of SPLOST funds, the agreement is effective so long as it is between the
county and one or more qualified municipalities representing 50% or more of the
municipal population in the county. 4
In the first case, no city would receive a SPLOST benefit. In the second case, cities that are not
included in the negotiation/agreement could potentially be excluded from the benefit. In the
case of Cobb County, for example, even after the incorporation of the new city, the existing
1 O.C.G.A. § 48-8-111.
2 O.C.G.A. § 48-8-110.
3 Level One projects are capital projects for the use and benefit of the citizens of the entire county that are
needed to implement state-mandated county responsibilities. See ACCG. 2016. Special Purpose Local
Option Sales Tax: A Guide for County Officials, 6th edition. Retrieved from
www.accg.org/library/legal/SPLOST%202016.pdf.
4 O.C.G.A. § 48-8-115.
11cities would together comprise more than 50% of the municipal population and could
potentially approve a revenue distribution that excluded the new city. Moreover, there is no
provision in Georgia law for newly incorporated cities to get a share of currently negotiated
SPLOST revenue. As such and because this analysis provides a conservative revenue estimate,
no revenue for the proposed new city is estimated from this source.
Service Delivery Strategy Payments
In 2017, Cobb County and its cities extended their Service Delivery Strategy (SDS) Agreement.
As part of this agreement and as part of an effort to resolve any remaining tax equity issues
between the county and its cities, the Cobb County government agreed to make a series of
payments to the cities. These payments increase incrementally from 2014 to 2023, at which point
the agreement will be renegotiated. The payments are to be allocated to the cities based on each
city’s respective share of the aggregate tax digests of municipal governments in the county. The
creation of a new municipality in the county could potentially trigger a renegotiation of the SDS
Agreement, but for the purpose of this fiscal viability analysis, the research team assumed that
the proposed new city would not be included under the existing agreement.
This potential source of revenue is not included in this analysis because the county and the
existing cities may view the new city as not being a full-service city and therefore not deserving
of a full share of the tax equity payments that the county has agreed to make. That is, the
payments that the county has agreed to make represent a means of achieving equity between
municipal and county taxpayers such that municipal taxpayers are not paying for county
services that they do not receive. For cities that provide the full range of services, particularly
expensive services such as law enforcement, the payment from the county is designed to
compensate municipal taxpayers who are paying county taxes for county services that are only
being provided to the unincorporated area (since the cities provide these services in the
incorporated area). Because the proposed new city will not be providing law enforcement
services, it can be argued that these new city taxpayers do not deserve the same level of
compensation for the county taxes they will be paying because, unlike taxpayers in the other
cities, they will be receiving some of the municipal-type services for which they have paid
county taxes.
Expenditures
The expenditure estimates below are based primarily on expenditures incurred by comparable
governments that provide services similar to those contemplated to be provided by a city
comprising the study area. In calculating these estimates, the Institute research team first
established two primary comparable governments, the cities of Marietta and Smyrna. These
cities were selected based on several factors. Both cities are located in Cobb County, part of the
metropolitan Atlanta area labor market. While the comparison cities are not quite as large as the
12study area, they are the largest cities in Cobb County that provide the services contemplated to
be provided by the proposed city. Both of these comparison cities provide the full range of
services. This is not ideal from a comparison point of view in that the proposed new City of Lost
Mountain is currently slated to only provide the following direct services: planning and zoning,
code enforcement, parks and recreation, sanitation, and a limited municipal court to manage
code violations. Because the cities of comparable size in Cobb County provide police services,
the research team relied on city council, legal, and court costs from Peachtree Corners, a large
city in metro Atlanta that like the proposed city, only uses municipal court for code violations.
Table 6 provides demographic profile data for the study area and the comparison cities.
Table 6. Demographic Profile of Study Area and Primary Comparison Cities
Peachtree
Study Area Marietta Smyrna Corners
Population* 74,619 60,972 55,663 42,243
Race–White 70.1% 42% 43.4% 44.9%
Race–Black 14.7% 28.8% 30.6% 22.6%
Race–Asian 3.5% 3% 6.7% 9.4%
Race-2 or more 4.5% 4.3% 4.1% 4.1%
Race–Other .8% 1.4% .9% .8%
Ethnicity– 6.5% 20.5% 13.8% 18.1%
Hispanic**
Median Income $118,919 $57,452 $76,444 $71,149
Poverty % 3.8% 14% 9.4% 9%
* Population figures and racial makeup for the study area were determined based on 2020 Census block data using
GIS mapping. **Hispanic is recognized as an ethnicity rather than a race in Census data.
For most of the cost estimates given, the figures were derived by averaging the per capita costs
of expenditures made by the two comparison cities for both FY 2019 and FY 2020. 5 Some
expenditure costs were not easily allocated to specific departments. In these instances, Institute
faculty interpreted the budget and other financial documents based on local government
finance and accounting knowledge and expertise. The explanation for how each estimate was
derived is included below. Table 7 summarizes the expenditures.
5 When available, actual expenditures numbers for both cities were used.
13Table 7. Summary of Expenditure Estimates
Direct Services Operational Costs
City Council $137,165
Legal Services $570,960
Municipal Court $4,752
Community Development $1,658,904
Parks and Recreation $3,771,440
Subtotal $6,143,221
Indirect Services & Other Operational Costs
Indirect/Admin. & Support Services $2,258195
Contingency Fund $140,024
Total Operating Costs $8,541,440
Annualized Routine, Start-Up, & Park
$309,134
Acquisition Capital
Annual Lease Expenditure for Facilities $310,500
Total Annual Capital Costs $619,634
Total Annual Expenditures (Operating +
$9,161,074
Capital)
Surplus Based on Total Revenue
$3,374,683
Estimates
The capital amount represents costs for equipment, as well as furniture and financial software
purchased for general government purposes. These costs are amortized over five years.
DIRECT AND INDIRECT SERVICES
The following sections attempt to identify the cost of providing an array of both direct and
indirect (or support) services. Indirect or support services include such functions as accounting,
purchasing, human resources, risk management, and the like. Typically, for a full-service city
the research team would be able to delineate the specific expected expenditures for both types
of services using the comparative city methodology. However, for cities that only provide a
limited set of direct services (as is the case for the proposed City of Lost Mountain), the
comparison city methodology is likely to grossly overestimate expenditures on indirect
services. 6 That is, total expenditures on support services in a city that provides an extensive
array of direct services will be much higher than expenditures for support services in cities that
provide only a few direct services. Consequently, the research team used a different approach
to estimating the cost of indirect or support services. This approach involved identifying a
general relationship (or ratio) between direct and indirect service expenditures. A disadvantage
6Indirect services include all the back-office support functions, including executive administrative
services, elections, finance, general human resources, information technology, risk management, records
management, public information and marketing, and general customer service.
14of this approach is that it does not allow one to specify exactly where indirect service
expenditures will be made, e.g., what the expected expenditures would be on a City Manager’s
Office versus those made on a Human Resources Office. Because of the method used to estimate
indirect service costs, no detailed breakdown of these individual service or departmental units
is provided. Experience suggests that governments that provide few direct services tend to
differ substantially in how they organize the individual support services under different
government units. That is, often they will combine several administrative functions into just a
single or a couple of offices.
Direct Expenditures
Expenditures by Function
Estimates for direct service expenditures are broken out by functional area. In most cases, these
costs were estimated by averaging FYs 2019 and 2020 expenditures of the comparison cities
(Smyrna and Marietta). However, in a few cases, Institute faculty based the estimates on
departmental expenditures of the City of Peachtree Corners because it is the only city of
substantial size that provides a limited set of services like the proposed new city.
In the following expenditure estimation methodology, we first calculate a per capita cost and
then multiply this per capita cost by the study area population to arrive at an estimate for the
proposed new city. Note that not all of the comparison city expenditure figures used in the
calculation are directly drawn from department budget documents. This is the case because
different local governments allocate costs to different departments in different ways. Hence,
based on examination of the documents and communication with the city staffs, the research
team adjusted how certain expenditures are properly allocated to specific functions. Also, note
that same the base expenditure figures represent departmental expenditures minus capital
expenditures that are sometimes included in departmental budgets.
City Council
The cities of Marietta, Smyrna and Peachtree Corners all have six council members and one
mayor. Given the size and complexity of Marietta and Smyrna, these cities assign some portion
of staff to the council function. Because the workload of elected officials in the proposed city is
more likely to reflect those from Peachtree Corners, the research team utilized those costs for
comparison purposes. In addition to salaries and benefits, these costs also include items such as
education and training, travel, dues, and fees.
15Table 8. Comparison Government Council Expenses
City and Fiscal Year
Budget Dept. Budget Per Capita
Peachtree Corners – FY 19 $84,418 $2.00
Peachtree Corners – FY 20 $70,884 $1.68
Average Per Capita Expenditure $1.84
Study Area Estimate $137,165
Legal Services
Estimating the cost of legal services is particularly difficult as the degree to which cities depend
on legal advice varies substantially. The demand for legal services for the proposed City of Lost
Mountain is likely to be somewhat less than for cities that provide more services and have more
departments (e.g., police) that are subject to legal suits and issues. Consequently, the research
team used Peachtree Corners as the comparison city for legal services and for municipal court
as this city’s main legal issues relate to planning and zoning and code enforcement as would be
the case for the proposed new City of Lost Mountain.
Table 9. Comparison Government Legal Expenses
City and Fiscal Year
Budget Dept. Budget Per Capita
Peachtree Corners,
$328,531 $7.78
FY 2019
Peachtree Corners,
$317,928 $7.53
FY 2020
Average Per Capita Expenditure $7.65
Study Area Estimate $570,960
Community Development
The Community Development expenditure estimate includes costs for planning and zoning,
building inspections, code enforcement, and, where applicable, economic development. In the
City of Smyrna, the Community Development Department also manages business licenses. In
many cities, managing business licensing is a function of the finance department or other
administrative departments, but the research team did not attempt to extract this cost, in
keeping with its conservative approach.
16Table 10. Comparison Government Community Development Expenses
City and Fiscal Year Budget Dept. Budget Per Capita
Marietta, FY 2019 $1,648,400 $27.04
Marietta, FY 2020 $1,728,170 $28.34
Smyrna, FY 2019 $989,576 $17.78
Smyrna, FY 2020 $877,785 $15.77
Average Per Capita Expenditure $22.23
Study Area Estimate $1,658,904
Municipal Court
Municipal courts for small cities typically involve hiring a part-time judge and one or more
clerks to handle the paperwork. However, because the proposed new city would not provide
law enforcement services, the actual amount of municipal court work is expected to be quite
minimal. Only code violations would be heard in such a municipal court. The closest
comparison in terms of workload and expected cost to the workload and cost of the proposed
new city’s municipal court is that operated by the City of Peachtree Corners. Because this city
tries to work with code violators before issuing citations to appear in court, the Peachtree
Corners’ Municipal Court only meets occasionally and incurs little cost. Additionally, because
the city attorney handles most of the work of the court, most of these costs are already
accounted for above in the legal expenses estimate.
Table 11. Comparison Government Municipal Court Expenses
City and Fiscal Year Budget Dept. Budget Per Capita
Peachtree Corners, FY 2017 $2,140 $0.05
Peachtree Corners, FY 2018 $3,240 $0.08
Average Per Capita Expenditure $0.06
Study Area Estimate $4,752
Parks and Recreation
The study area currently contains all or portions of eight different parks.7 Two parks, only
partially located within the study area, are on land owned by the United States Corps of Engineers
that is leased by the county. These areas are mostly comprised of passive greenspace, although
7Information on county parks is from the Cobb County website, correspondence with county personnel,
and in-person inspection by the research team.
17one does contain a dog park. 8 For purposes of this study, we have assumed that the county would
continue to operate and maintain the areas leased from the federal government. Among the
remaining county parks (these are all completely contained within the study area), two appear to
be completely undeveloped9, two are slightly developed, but are mainly passive walking areas,
and two are well developed. The four developed parks, together making up a little over 579 acres,
would require some maintenance from the proposed city. The two slightly developed parks,
Green Meadows Preserve and Leone Hall Price Park, each have restrooms, picnic tables, and
benches as well as many acres of meadow that require mowing once a year. The Green Meadows
Preserve houses a community garden and a Cherokee garden each with attendant storage and a
historic civil war era home. The two well developed parks, Lost Mountain Park and Oregon Park,
include various types of ball fields and courts, playgrounds, paved and unpaved trails, picnic
shelters, parking lots, batting cages, restrooms, and some undeveloped land. Within these two
parks, there is also a recreation center, four concessions buildings, an escape room and two fishing
ponds. The table below details some of the amenities found in these parks. 10 Because a good
portion of the slightly developed parks include acreage that is passive, we have only included the
developed areas and the meadows which require annual mowing in calculating our estimate of
maintenance costs.
Table 12: Developed Parks
Ball/Soccer/ Tennis Playground Restrooms Buildings
Park Acres Misc. Fields Courts
Lost Mountain 166 11 12 2 1 Recreation Center
3 Concessions
Oregon 44.17 8 4 1 1 Escape Room
Concession
Total 210.17
8 These are Allatoona Creek Park, located at 5690 Old Stilesboro Road, and Pitner Road Park, located at
2320 & 2450 Pitner Road.
9 These are the Kemp Park Property, located at 4331 Burnt Hickory Road and the Schmidt Family Park
Property, located at 451 Anderson Road.
10 There is also a senior center located in Lost Mountain Park. As senior centers are typically a county
service, the research team has assumed the county will continue to maintain and operate this facility.
18Table 13: Slightly Developed Parks
Total Approximate Restrooms Unpaved Gardens Buildings
Park
Acres Passive Space Trails
Green 70 1 2.7 mi. 2 Historic
126.21
Meadows House
Leone Hall 230 1 1.8 mi. Pavilion
242.63
Price
Total 368.84 300 Net Developed 68.84
Total Developed Park Acreage = 279.01
Parks - Maintenance Costs
Park and recreation maintenance budget data from the Cities of Marietta and Smyrna was used
to estimate costs. The City of Smyrna operates thirty-six recreation sites on 321 acres. Marietta
operates thirty-six sites on approximately 388 acres. As the types of facilities operated by both
comparison cities is fairly similar to the those identified as being developed in the study area,
using a per acre maintenance cost serves as a reasonable means of determining a cost estimate.
The table below shows the comparison city maintenance costs and their application to the study
area.
Table 14: Park Maintenance Costs
City and Fiscal Year Budget Dept. Budget Park Acreage Per Acre Cost
Marietta – FY 19 $1,540,370 387.7 $3,973
Marietta – FY 20 $1,616,199 387.7 $4,169
Smyrna – FY 19 $965,253 321 $3,007
Smyrna – FY 20 $908,209 321 $2,829
Average Per Acre Expenditure $3,495
Study Area Estimate 279.01 $975,008
Parks - Operational Costs
Most of the youth recreation programs offered in Cobb County parks are conducted by
volunteer organizations that utilize the county facilities. Both comparison cities appear to
function in a similar manner. There are operational costs outside of maintenance, however, that
require personnel and annual operating funds. Parks require administrators to manage park
agreements with volunteer organizations, to oversee programs and activities not run by outside
organizations, and to ensure capital improvements are made in a safe and timely manner.
Assuming that the new city would continue to operate similarly, we examined operational cost
19data from the comparison cities. Because programming and operational costs for parks are tied
closely to the amount of use these services enjoy, we used a per capita cost as the means of
estimating expenses. The table below shows the data used to make this calculation.
Table 15: Parks and Recreation Operational Costs
City and Fiscal Year Budget Dept. Budget Per Capita Cost
Marietta – FY 19 $2,571,756 $42.18
Marietta – FY 20 $2,873,421 $47.13
Smyrna – FY 19 $1,708,330 $30.69
Smyrna – FY 20 $1,664,756 $29.91
Average Per Capita Expenditure $37.48
Study Area Estimate $2,796,432
Combining maintenance and operational cost estimates for parks results in a figure of
$3,771,440.
Contingency Fund
Contingency funds are used by cities to cover unforeseen expenditures. The Government
Finance Officers Association (GFOA) recommends that governments establish a formal policy
for the level of the unrestricted fund balance that should be maintained in the general fund.
GFOA recommends that the adequacy of the unrestricted fund balance in the general fund
should be determined based on each government’s unique circumstances. Nevertheless, GFOA
recommends, at a minimum, that general-purpose governments, regardless of size, maintain an
unrestricted budgetary fund balance in their general fund of no less than two months of regular
general fund operating revenues or regular general fund operating expenditures. 11 Because this
amount typically remains in reserve and is only rarely spent, it is not an expenditure that needs
to be offset by revenue generated each year. Rather, it can typically be addressed through a
multiyear allocation. The estimate given here of a needed fund amount is based on a 10-year
cycle of having to use the contingency fund.
INDIRECT SERVICES AND COST CALCULATION
As outlined in the introduction to this section, the research team determined that using a ratio
(of direct to indirect service costs) is the most appropriate method for estimating indirect
services costs. The following sections first discuss the potential issues involved in this method
and then identify two approaches to estimating an appropriate ratio for use in the estimation of
indirect service costs.
11 See www.gfoa.org/fund-balance-guidelines-general-fund.
20Estimating a Ratio of Direct-to-Indirect Costs
One way in which the relationship between direct and indirect expenditures can fail to be
proportional is due to the existence of some fairly significant economies of scale in the delivery
of support services. Take the example of a single accounts payable finance clerk who is able to
manage the accounts of 10 departments that provide direct services, with each department
taking about a 10th of the staff member’s time. A government that only has two departments
would therefore be expected to only require a .2 full-time equivalent finance clerk.
Unfortunately, it is typically not possible to employ staff with these skills on this basis, even on
a contractual basis. Moreover, certain tasks require the fairly constant on-site presence of a staff
member. As such, there is a certain minimum quantity of support staff who need to be
employed if the direct services are to be delivered in a timely and effective manner. The
proposed new city would be large enough to likely need support staff that will surpass the
“minimum quantity” needed to provide the support service in question.
The second way that the relationship between direct and indirect expenditures can fail to be
proportional is related to the potential for some services to be much more demanding of
support services than others. This is more likely when a service has higher HR or purchasing
demands (e.g., police and fire) than other services. In the proposed new City of Lost Mountain,
the direct services that are proposed for the city tend to be quite similar in terms of the likely
demand for support services. In other words, the indirect service requirements per direct-
service staff are not likely to differ dramatically between, say, community development and
parks and recreation.
While the foregoing discussion suggests that using the ratio of direct to indirect expenditures as
a basis for estimating support service costs in the study area would be appropriate, the data
available do not allow us to address one possible way that the resulting estimate of support
service cost could be skewed, i.e., the data do not allow us to make adjustments for the fact that
some services may be more intensive users of support services than others. In the case of the
study area, the direct services being proposed are ones that are likely to be somewhat less
demanding of support services. In addition, because the proposed new city will not be
providing road services or maintaining its own buildings (other than park and recreation
facilities), some expenditures for indirect services for engineering and building maintenance
may not be incurred, suggesting a lower ratio of indirect to direct service costs. Consequently,
the Institute research team believes that the indirect services cost estimate produced based on
the general ratio of direct to indirect expenditures should provide a conservative estimate of
these costs.
In order to determine these costs, we compared the ratio of indirect to direct costs reported by
the cities of Marietta and Smyrna. This method assumes that the ratio of expenditures on
support services to direct services in the study area will tend to follow the overall ratio of
support services to direct services expenditures in the comparison cities. The rationale for this
21method is that the proposed new city will be in a labor market that will be most similar to the
comparison cities.
Table 16. Ratio of Indirect-to-Direct Expenditures
Marietta 0.25
Smyrna 0.485
Average 0.368
Applying this ratio of indirect-to-direct costs results in a figure of $2,258,195. 12
CAPITAL COSTS
New cities typically incur some general start-up costs as well as ongoing capital replacement.
Peachtree Corners was used as it is a new city providing a limited set of services for which data
on start-up capital costs are available. The Institute research team examined the Peachtree
Corners FY 2013 start-up costs and inflated this amount to 2020 dollars. After creating a start-up
equipment list, we then consulted with city staff to make sure we had included the essential
start up equipment and software for the proposed new city. Although certain IT costs are
incurred at start-up, the estimates below treat the annualized cost as an annual ongoing capital
expense to finance replacement, repair, and upgrade costs.
Annual Capital
Information Technology
Table 17 shows the annual capital cost estimate for information technology (IT). The analysis
assumes all computer hardware will have a five‐year replacement schedule and will be financed
over a similar period.
12In order to confirm the reasonableness of this estimate, the research team communication with the
finance staff in the City of Peachtree Corners and determined that their annual expenses for indirect
services are approximately $2,066,599. In keeping with the conservative approach, we used the larger
estimate derived by applying the average of the ratios from Marietta and Smyrna.
22You can also read