PRESENTATION TO THE MINTEK @ 75 CONFERENCE - QUEST FOR A HIGH PERFORMING FREIGHT LOGISTICS SYSTEM
←
→
Page content transcription
If your browser does not render page correctly, please read the page content below

PRESENTATION TO THE MINTEK @ 75
                                  CONFERENCE

          QUEST FOR A HIGH PERFORMING FREIGHT LOGISTICS SYSTEM

Mmete Petrus Fusi
Public Policy and Economic Regulation
05 June 2009

                                                                 0
CONTENTS

           Agenda
           INTRODUCTION

           CONTEXT

           TRANSNET’S STRATEGY

           GLOBAL ECONOMIC CRISES

           CHALLENGES GOING FORWARD

           CONCLUSION

                                      1
INTRODUCTION

                  Transnet’s key role is to assist in lowering the cost of doing business in
                  South Africa and enabling economic growth through providing appropriate
Shareholder       ports, rail and pipeline infrastructure and operations in a cost effective and
 Mandate          efficient manner and within acceptable benchmark standards.

                  Transnet is self-funded and does not receive subsidies from the State.

                  Transnet is a focused freight transport company, delivering integrated,
                  efficient, safe, reliable and cost-effective services to promote economic
                  growth in South Africa.
Vision and
 Mission
                  This is to be achieved through increasing our market share, improving
                  productivity and profitability and by providing appropriate capacity to our
                  customers ahead of demand.
              We would like our customers:

              •   to prefer us because we are reliable, trustworthy, responsive and safe;
  Values
              and because:

              •   our employees are committed, safety conscious, accountable, ethical,
                  disciplined and results orientated                                          2
TRANSNET’S MANDATE

                                                                        Skills
          BEE                      Economic growth
                                                                     development

                                National objectives

                                Transnet:: Custodian of
                                ports; rail and
                                             ,  pipelines

                                Network responsibility

                                                              Network
            Network capacity        Network utility
                                                            connectivity

                                     Function of

             Financial health            Funding            Asset utilisation

                                    Dependent on

          Regulatory                                              Supplier industry
                                    Capital markets
         environment                                                   health
                                                                                      3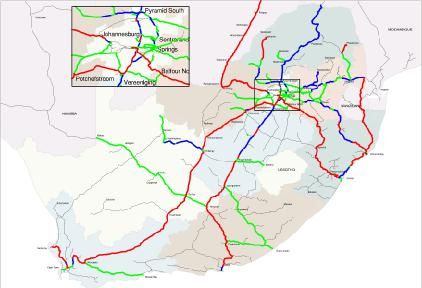
TRANSNET STRUCTURE

      Transnet   Transnet   Corporate    Transnet
      Property    Capital    Centre     Foundation
                 Projects

                                                     4
THE GLOBAL LOGISTICS INDUSTRY IS EXPERIENCING
GREAT CHANGES

                            Rapid expansion of international trade in most
    Markets                 regions, and particularly in Asia: many supply chains
                            are now truly global

                            Global competition in product and service markets is
   Expectations             driving higher standards and lower costs in logistics
                            supplier markets

                            Despite some industry concentration, the freeing of
   Competition              transport markets is creating greater contestability in
                            logistics services and sub-markets

                            All modes of transport are investing to obtain more
                            efficiencies, usually larger vessels/vehicles and
    Technology
                            improved traffic dispatching, monitoring and control
                            capability

   “By 2025, 80% of goods traded will be produced in countries different than
   where they are consumed.” (McKinsey and Company)
                                                                                      5
THE STRATEGIC IMPORTANCE OF NATIONAL FREIGHT
SYSTEMS IS GROWING
The increase in global production sharing, the shortening of product lifecycles and
the intensification of global production all highlight logistics as a strategic source of
competitive advantage.
With effective logistics, new global markets can be accessed for economic growth;
decent job creation and poverty reduction.
Improving logistics performance has become an important development policy
objective.
Being able to connect to what is referred to as the “Physical Internet” is a key
determinant of a country’s economic competitiveness.
For those countries able to connect, the physical internet creates access to vast
new markets; but for those whose links to the global logistics web are weak, the
costs of exclusion are large and growing. (World Bank)
6CONNECTIVITY NEEDED FOR SUCCESS IN GLOBAL
ECONOMY
Africa’s share of global trade has been declining for decades:
from nearly 4% in 1960s to under 2% today.
7LOGISTICS CHALLENGE FOR SOUTH AFRICA
South Africa is distant from its key trading partners
Maritime transport costs is a significant component of total transport costs
South Africa is strategically placed to service Southern African, Asian and South American trade routes
8
SA can establish itself as a global transhipment hub focused on certain trade routesOCEAN FREIGHT COST IS THE LARGEST
DETERMINANT OF SOUTH AFRICAN SUPPLY CHAIN
COMPETITIVENESS
Note: Based on case studies
Sources: Industry interviews, Moving South Africa Analysis
9LOW VOLUMES AND INEFFICIENT SHIPPING
MARKETS LEAD TO HIGH FREIGHT RATES FOR
SOUTH AFRICA AND THE REGION
8000
EXPORT RATES - FROM A NORTH-EUROPEAN HUB
Total price (base rate + BAF/CAF+congestion surcharge) for FEU (in US$) -
Luanda - Angola Lobito - Angola
7000
= Africa
Bissau -Guinea Reunion/Mauritius and Madagascar
= Far East
= India/Pakistan
6000
Cape Verde = Middle East
Antofagasta - Chile = Australia - New Zealand
Mauretania = Mediterranean
5000 = Baltic/Iberian peninsula
Costa Rica = South and Latin America
Tanga - Tanzania
without THC
Honduras
Dar Es Salaam - Tanzania
4000 Colombia
Iquique - Chile
Mombasa
Douala
3000
South African ports
AUSTRALIA - NEW ZEALAND
2000
FAR EAST
1000
0
0 2000 4000 6000 8000 10000 12000 14000
Distance from North-European hub (in nautical miles)
10THE REGIONAL PORT SYSTEM IS FRAGMENTED
TPT
Million TEUs
Uganda
Ngqura 0
Dar-es-Saalam Equatorial Zaire Kenya
53
Guinea Gabon
Rwanda
Maputo 60 Congo Burundi
Dar-es-Saalam
Walvis Bay 76 Tanzania (HPH)
Luanda
Tomasina 102 (APM)
Angola Malawi Mozambique
Luanda 360 Tomasina
Zambia
(ICTSI)
Tema 420
Zimbabwe
Namibia
Port Elizabeth 429 Botswana
Maputo Madagascar
Walvis Bay
Lagos 460 (DPW
(APM & Swaziland &Grindrod)
Namport)
Abijan 750 Lesotho
South Africa Durban (TPT)
Cape Town 783
Cape Town Ngqura Port Elizabeth
Durban 2 200 (TPT) (TPT) (TPT)
11
Source: Dynamar 11
1A REGIONAL APPROACH IS REQUIRED TO BUILD
ECONOMIES OF SCALE AND DRIVE TRANSPORT
SYSTEM EFFICIENCIES
Monrovia Lome
(Liberia) Takoradi (Togo) Lagos
(Ghana)
Cotonou (Nigeria)
Tema(Benin) Onne
San Pedro Abidjan(Ghana) (Nigeria)
(Côte d'Ivoire) (Côte Douala
d'Ivoire) (Cameroon)
Libreville
(Gabon)
Volumes are critical to Dar es Salaam
increasing connectivity. Pointe Noire
(Congo)
(Tanzania)
Tanga
(Tanzania)
SA’s market too small to Mombasa
compete successfully. (Kenya)
Nacala
(Mozambique)
Toamasina
Regional growth prospects Beira (Madagascar)
(Mozambique)
are stronger than ever. Walvis
Port Louis
(Mauritius)
Bay
(Namibia) Maputo
(Mozambique)
Regional freight systems
Richards Bay (SA)
need to consolidate to drive Durban (SA)
down costs and increase East London (SA)
connectivity. Cape Town
(SA)
Port Elizabeth
(SA)
Feeder system opportunities
for BEE 12SOUTH AFRICA FREIGHT SYSTEM PERFORMING
RELATIVELY WELL (World Bank, 2007)
Top Quintile, Highest Performance 4th Quintile, Low Performance
High income countries are generally top 2nd Quintile, High Performance Bottom Quintile,
Lowest Performance
3rd Quintile, Average Performance
performers but there are big differences
Distribution of countries by income groups across LPI Quintiles (%)
between countries at other income levels. 100%
South Africa placed 24th out of 150 countries
75%
and is the highest ranked middle income
country in a list which includes Malaysia (27),
Chile (32), Turkey (34) and Hungary (35). 50%
Singapore, Netherlands and Germany are the 25%
top 3 ranked countries respectively.
0%
China (30) is the top performer amongst High High Upper Lower Low
High High Upper
Middle Low er
Middle Low
lower middle income countries. Income
OECD
Income
Non- Income Income
Income
Income Income Middle Middle Income
OECD
OECD Non-OECD Income Income
India (39) is the top performer amongst low
income countries.
Source: World Bank, Connecting to Compete: Trade Logistics in the Global Economy, October 2007
LPI = Logistics Performance Index 13KEY CHALLENGES THAT NEED TO BE
ADDRESSED
High ocean freight costs.
Poor regional connectivity.
Investment backlog in the national network.
Traffic demand likely to double (or triple) in the next 20 years.
Rail’s market share in General Freight is declining.
Limited intermodal solutions in inland distribution.
Skills shortage throughout the sector.
Limited black private sector participation.
14TRANSNET’S STRATEGY IS DESIGNED TO
MEET THESE CHALLENGES BY:
Operating the ports in a complementary manner to make the port system more
efficient, increase maritime connectivity and reduce ocean freight rates.
Implementing a high performance corridor backbone for the country that will alleviate
cargo congestion and provide the capacity to meet long- term demand for freight in
the economy.
Integrating physical, financial and information flows along the supply chain to ease the
administrative burden of trade and create greater visibility and responsiveness within
industry supply chains.
Formulating and implementing integrated service strategies for key customer
segments to realise the synergies of the port, rail and pipeline systems.
Enhancing the connectivity of the South African freight system with the regional
freight system.
Growing the skills base and supplier base for the broader industry.
Identifying opportunities for black economic empowerment.
15GROWTH STRATEGY: THE NEXT HORIZON OF THE
TRANSFORMATION PROCESS
Transformation horizon
Three turnaround horizons
Grow
Integration:
Optimise
• Accelerated rollout of
operational improvements
Stabilise
Interactions: • Integrated business model
• Leveraging benefits of an – End-to-end corridor view
intermodal business – Integrated customer view
Individual programme focus: • Effective commercial • Achieve world class
• Getting the basics right management of the network performance
• Stabilising operations business
• Operational and functional teams
jointly optimise their interaction
areas
We are here
Four-point turnaround strategy Four-point growth strategy
2005 2007/2008 2010
Corporate Balance sheet Growth through :
governance restructuring
1 2
and risk Reengi-
neering –
Capital
Safety,
optimisa-
integratio risk and Human
tion and
Redirect and 4 3 Human capital
n,
productivi
financial
effective
governanc
capital
execution
manage-
ty and e
re-engineer development efficiency
ment
Positioning the Company for growth in the future 16TRANSNET HAS EFFECTED A SUCCESSFUL FINANCIAL
AND OPERATIONAL TURNAROUND OVER THE PAST FOUR
YEARS (1/2)
Achievement Performance trend R million
30,091
• Continuous increase in revenue showing results of 26,034
26,899
initiatives to grow the business, with revenue 25,260
Revenue
increasing from R25.3bn in 2004/05 to R30.1bn in
2007/08 (19% increase)
04/05 05/06 06/07 07/08
13,185
• Improvements through: 11,149
10,301
Operational efficiency improvements, effective cost-
7,333
cutting initiatives mainly due to reengineering projects
EBITDA Discontinuing non-core businesses
• Improvement from R7.3bn in 2004/05 to R13.2bn
during 2007/08 (80% improvement)
2004/05 2005/06 2006/07 2007/08
61
• Balance sheet restructuring and cost effective debt
structures yielding positive results with consistent 46
39
below target gearing from 61% in 2004/05 to 29% in
29
Gearing (%) 2007/08 (53% improvement)
• This enables Transnet to fund capital investments
more cost effectively and without government
guarantees
04/05 05/06 06/07 07/08
17TRANSNET HAS EFFECTED A SUCCESSFUL FINANCIAL AND
OPERATIONAL TURNAROUND OVER THE PAST FOUR
YEARS (2/2)
2003/04 2005/06 2007/08
Growth in key commodities Key Performance Indicators
Total freight (billion vol.km) 106 * Net ton km per wagon (GFB)
105 105 105 *
103 9.9%
Rail 100 * Declining coal volumes 06/07 & 07/08 620,204 681,684
2002/03 03/04 04/05 05/06 06/07 2007/08
2003/04 2007/08
Containers (Thousand TEUs) Container moves per crane hour – Container
3,717 Terminals
3,400
3,010 25.0 22.6 25.6
2,864 18.2
Ports 2,528 15.8 14.7
2003/04 04/05 05/06 06/07 2007/08
Durban Cape Town Port Elizabeth
Refined (million Ml/km) Percent capacity utilization
3.4
3.1 95.7 104.9
2.8 2.8 70.0 76.7 68.4
Pipe- 2.5 51.4
lines
2003/04 04/05 05/06 06/07 2007/08 Crude Gas
Refined
18THE GROWTH STRATEGY IS BASED ON FOUR
PILLARS
Growth through
Reengi-
Capital
neering – Safety, risk Human
optimisation
integration, and effective capital
and financial
productivity governance execution
management
and efficiency
• Integration in • Integrated • Delivery on • Accelerate
priority capital, safety implementation
corridors operations, and performance of HC strategy
financial
• Efficient asset customer
• Complying to • Strengthen
utilisation the highest values and
planning
standards of culture
• Planned • Strategic corporate
maintenance
asset/liability governance
in all divisions
management
• Cost effective • Enterprise risk
procurement
• Funding management
strategy
• Shared services • Enterprise
performance
management
19TRANSNET MANAGES AN EXTENSIVE INTEGRATED
NETWORK
Port Infrastructure Rail Infrastructure Pipeline Infrastructure
30 000 km of track
9 Commercial Ports Crude line: 580 km
22 300 route km
19 container berths Network Electrification: • Design Cap = 6,8 bill. l/a
3 automotive terminals – 50kV AC (861km), • Current Cap = 5,8 bill.l/a
26 dry bulk berths – 25 kV AC (2309km)
39 break bulk berths – 3kV DC (4935km) Refined line:725 km
13 liquid bulk berths • Design cap = 3,5 bill. l/a
Axle loading: • Current cap = 4,3 bill. l/a
Current Volumes – – Main lines at 22t / axle
• Containers: 3.82 m TEUs – Coal and ore lines 30t / axle Avtur: 94 km
• Dry bulk: 129 mtpa (coal line operates at 26 ton) • Design cap = 1,2 bill. l/a
• Auto: 540 000 units • Current cap = 1,1 bill. l/a
Current Volumes –
• Liquid: 40 mtpa
– Containers: 400 000 TEUs
• Break Bulk: 13 mtpa
– Dry bulk: 149 mtpa
– Auto: 192 000 units
– Liquid: 4.2 mtpa
– Break Bulk: 20.9 mtpa 20NATIONAL RAIL AND PORT INFRASTRUCTURE
Musina
Lephalale
Komatiepoort
Pretoria
Maputo
Johannesburg
Ermelo
SW AZILAND
Hotazel
Kimberley
Richards
Port Nolloth
LESOTHO Bay
Durban
De Aar
Saldanha
East London
Cape Town Ngqura
Mossel bay Port Elizabeth
21TRANSNET PIPELINES’ NETWORK
22FREIGHT DEMAND IS LIKELY TO DOUBLE WITHIN THE
NEXT TWENTY YEARS
3500
3000
2500
Tonnes (Millions)
2000
1500
1000
500
0
1977 1982 1987 1992 1997 2002 2007 2012 2017 2022 2027 2032 2037
Likely growth Low growth High growth
Freight will concentrate on a limited number of corridors centred on
Gauteng. Even a low growth scenario means that continued modal
balance is impossible
23
Source: Centre for Supply Chain Management, University of StellenboschSTRATEGY IMPLEMENTATION THROUGH CORRIDOR
APPROACH
Benefits of corridor approach
Transnet as a network business needs to operate in
an integrated manner throughout the logistics
NOC Procurement corridor
Maintenance Provide a common transformation and long-term
Functions
planning backbone
Yards
Projects
Maximise growth opportunities across all operating
Sentrarand divisions (rail, port, pipeline)
Kaserne Yard
Depot
Capture operational and functional synergies across
Example
Newcastle Port Corridors
operating divisions through integrated solutions
Danskraal
Durban
Improve efficiency and effectiveness of logistics
DCT
Messina
B
e
i
t
supply chain
B
r
L i
d
o
gSoekmekaa r
u
E e
i
l
s
l
Ti P
hs Vaalwa ter Drum mondlea Chroo
i mvalleiT Phalaborwa
Zebediela r
ar e Hoedspruit
Naboomsprui t i
ba t
c
Provide optimal capital base for network
Middelwit as e
Nylstroo m h
z r Steelpoo rt
iNortha m s a
Graskop
Marble Hall
r
m b
Roossenekald
Ruste nburg b u
t
i r
g Plaston
C Koma tipoo rt
Witbank Belfas t
Mafikeng u
Preto ria
l R
Ogies Machadodorp
Kruge
Lichtenbu rg rsdo rp
O/ fontein l Sa Baber ton
Welgedag
Welverdiend i y
Coligny J’burg et Hawerklip
B Brey ten
Ver maas nn
at o
Bethal/ Lothai r
Potches troo m
Ottos dal nr n p
l
Orkney K a a
infrastructure evolution
Wolwehoek
Hotazel Schweizer -Re neke r Stande rton
l Vier fon tein a
a
e s
Makwassie n
Pudimoe r
Ancona d Charle stown
Newcastle
k Vrede
E Westleigh G
s
K Utrech t
r d Warden Hlobane o
Naroegas tS Manganore Warren ton r l
o Vryhei d
si Whites
o A e
N Glen H r
Palingpan Postm asburg p o a
Virgini r Glencoe
Harris mith l
a Upington s Bult fon tein Bethle hem
n l a
k h Theunisen s i
o e
Kimbe rley t Marqua rdn Ladysmi th
p Kaka mas n Winburg Bergvi lle
a g
Empangeni
Nkwalini
Douglas d t
Bloem fon tein
o Krans kop Eshowe Richar ds Bay
Ladybrand Moorleigh
Kof fie fontein Sannaspos n Greytown
Belmo nt Maseru
Prieska H Stange r
oHilton
Network
Coppe rton w
Underberg i
Donnybrook
c Richm ond
Mid I lovo
Spring fontein Durban
k
Mandonela
Bethul ie Matati ele Franklin
De Aa r Kelso
Aliwal North Kokst ad
Harding Simu ma
Sakrivie r
Bit ter fon tein Dreunberg Barkle y Eas t Port Sheps tone
Kootji eskolk Noupoort Jamestown Maclear
Calvinia Rosm ead
Schoombee
Hutchinson
Focus on key commodities and aligning capital
Hofmeye r Umtat a
Queenstown
Tarka stad Qama ta
Beauf or t Wes t
K Seymou r
l Somer set Eas t Amab ele
a Cookhouse Blaney
Klipplaa t Fort
w Porte rville
S ald an h a Beauf or t
e East L ondon
Prins Al fred
r Hamle t Touws rivier Kirkw ood
Ladysmi th
Atlan tis C Alexand ria
Worceste r Oudtshoo rn Uitenhage
a Patensie Port A lf red
George Avont uur
Franschhoek l
investment to high-growth potential corridors
Cape Town Stellenbosch Riversi dale Port Elizabe th
t Knysna
M osselb a ai
Simons tad Strand Prote m z
24
d
Breda sdorp o
r
pINTERMODAL SOLUTIONS: THE ONLY SUSTAINABLE
WAY TO MEET FUTURE DEMAND FOR FREIGHT
TRANSPORT
Compounded Annual
Transnet's Freight Gauteng-Beitbridge (incl. Polokwane) Growth Rate
Forecast model: 2006
Rail 2011
Likely
13.3
High
13.8
1.9 2016 15.7 16.9
3.6%
Million tons 2006,
Road 2021 18.8 21.2 Gauteng-Nelspruit (incl. Witbank)
9.5 2026 23.1 27.0
2006 Likely High
2011, 2016, 2021, 2026 Rail 2011 22.0 23.2
4.7% 5.3%
4.2 2016 28.0 30.9
Gauteng-Lobatse Road 2021 36.1 42.0
Likely and high 2006 Likely High 12.2 2026 46.1 56.6
scenarios Rail 2011 13.1 13.5
3.8 2016 16.2 17.5
Road 2021 20.5 23.1 Gauteng-Richards Bay
6.8 2026 26.4 31.1 4.7%
4.3% 2006 Likely High
Rail 2011 17.1 17.8
9.2 2016 21.0 22.9
Gauteng-Cape Town Road 2021 26.2 30.2
2006 Likely High 5.1 2026 33.4 40.6
Rail 2011 43.2 45.1
2.6 2016 51.9 56.6 Gauteng-Durban
Road 2021 63.0 72.1 3.9% 2006 Likely High
33.3 2026 77.8 93.5 4.7%
4.4% Rail 2011 54.1 56.8
8.3 2016 67.3 74.6
Road 2021 84.9 99.4
35.0 2026 109.3 134.2
Coastal Gauteng-East London
2006 Likely High
2006 Likely High 4.8%
Rail 2011 45.8 48.0 Gauteng-PE Rail 2011 8.6 9.0
1.5 2016 57.2 62.9 2006 Likely High 0.4 2016 10.7 11.7
Road 2021 72.3 83.7 Rail 2011 6.2 6.4 Road 2021 13.4 15.5
35.3 2026 93.7 113.1 0.5 2016 7.6 8.3 6.5 2026 17.3 21.1
Road 2021 9.5 11.0
4.6 2026 12.1 15.0
25SOUTH AFRICA IS A TRANSPORT INTENSIVE
ECONOMY
2.5
2.4
2.2
2
SA as % of world figure 2004
2
1.5
1
0.7
0.5
0.5
0.4
0
GDP Logistics costs Transport costs Rail freight Surface freight Road freight
tonkm tonkm tonkm
Our long transport corridors is the key reason behind this abnormal
demand. Transport needs to be especially efficient to overcome this
challenge
Source: Supply Chain Management Centre, University of Stellenbosch
26THE SOUTH AFRICAN FREIGHT SYSTEM MUST
NEVERTHELESS CONFRONT MANY CHALLENGES
Large infrastructure backlogs across all modes.
An overall deterioration in the quality of transport infrastructure.
A skills shortage.
A lack of integrated planning.
As a very transport intensive economy, South Africa contributes less than 0.5%
to the world GDP but more than 2% of surface freight ton.kilometres.
Transnet is focused on delivering a world class integrated freight
logistics system that will provide local firms with a competitive
advantage
Source: Centre for Supply Chain Management, University of Stellenbosch 27SIGNIFICANT SUSTAINED INVESTMENT IS
REQUIRED
Operational capacity limit
Rail network demand vs installed capacity
Physical capacity limit
2006 2010
2020 2030 28SIGNIFICANT INVESTMENT ACROSS ALL
DIVISIONS TO REPLACE ASSETS AND
CREATE CAPACITY
Investment Transnet historic
Key projects
consolidated Capex (excl SAA)
R bn
5yr
• Cape Town container expansion NPA Plan Growth strategy 80
16
• Port of Ngqura construction
Ports • Port of Ngqura container terminal
2008 16
development including rail link TPT 10
• Durban entrance channel widening
2007 12
• Coal export /iron ore line expansion Investing 4
TFR 38 2006 5
Rail • Acquisition of 405 locomotives for times more
GFB, iron ore and the coal line than 3
• Maintenance/upgrade of rolling stock TRE 2 2005 4 years ago
and infrastructure
2004 4
Pipelines • New Multi-Product Pipeline 12
2003 4
2002 3
Specialist • Business intelligence and building 2
Units upgrades
2001 2
Total investment =
2009-2013
80
29OVERVIEW OF 5 YEAR INVESTMENT PLAN
The 5 year capital investment plan approved in 2008/09 amounted to R80.3bn and,
including additional projects and increases in ETC during 2008, amounts to R89bn.
Latest 5-Year Investment Plan amounts to R80.5bn.
Projects in plan have been reviewed and re-prioritised and cash flows have been
rescheduled over 5 years to remain within the financial parameters
Of the planned Capital Investment of R80.5bn, spending will be as follows:
32% in rolling stock (R25.8bn)
59% in Infrastructure related projects (R47.5bn)
9% in Acquisition of machinery & equipment and floating craft (R7.2bn)
The capital expenditure over the next three years of R57.7bn will be funded by
borrowings and cash from operations maintaining the targeted gearing ratio
30Expansion
CAPITAL INVESTMENT: 5-YEAR PLAN R80.5bn
Sustaining
Annual Capex (Rbn) Sustaining vs Expansion
21,912 (3 year view)
19,442
9,071 16,336
8,121
13,331
7,180 42%
9,480
9,439 58%
12,841
11,321 7,718
9,156
3,892
1,762
09/10 10/11 11/12 12/13 13/14
Capex per Division
Other
TPL R1.2bn
R11.1bn Capital spending is being
14%
closely monitored and
TPT 1% aligned with capacity
R6.3bn 8% TFR
54% R43.5bn requirements.
20%
TNPA
3%
R16.3bn
TRE
R2.1bn 31RAIL CAPITAL INVESTMENT
10,000
9,000
8,000
Context of National Freight
Transnet: “turnaround to growth”
7,000 Logistics Strategy
6,000 Freight Rail Capex
Rand Million
5,000
4,000 Investment of R38b
planned over next
five years (2008/09
3,000 – 2012/13)
2,000
1,000
-
1999/2000 2000/01 2001/02 2002/03 2003/04 2004/05 2005/06 2006/07 2007/08
Capital expenditure was extremely low since 1999 – a situation which persisted until 2005
resulting in ageing assets and a maintenance backlog legacy
The majority of capital has been spent on sustaining the system with growth in allocations
for expansions in recent years only
Based on American benchmarks, railways should invest 18% of turnover in capital. Freight
Rail has historically invested +10% per annum and only in the last three years exceeded
these thresholds to rectify the legacy of under-investment 32CHANGES IN ECONOMIC ENVIRONMENT
The financial crisis • Expectations of a quick resolution to the credit crisis have not been
could spark the worst realised
worldwide recession since • The IMF has revised its global GDP 2009 forecast to 0.5%, from 2.2% in
the Great Depression. November 2008
The global recession is • Commodity prices have fallen sharply since September 2008.
projected to cause both • Oil has fallen more than 60% from its peak and is forecast to average
commodity prices and $50/barrel in 2009.
inflation to ease further on • Iron Ore had declined by almost 70% before recovering slightly.
the back of weak demand • Thermal coal has fallen by more than 50% since July
International trade is • The BDI has fallen over 90% in the past 6 months
projected to decelerate • Drewry forecasts container growth of only 2.8% in 2009
sharply, with global trade • Container volumes through US ports have been negative for 17
volumes falling by 2.8% in consecutive months
2009. • Lower ocean freight rates benefit SA
• Transnet is well equipped to weather the storm
Transnet’s short term focus • The growth strategy will continue to provide the strategic framework
will shift towards sustaining • The timing of the implementation of the growth strategy will be delayed
the business as a result of revisions to volume forecasts
• The short term focus is on protecting volumes and preserving cash
33A MORE CHALLENGING ENVIRONMENT LIES AHEAD
Global growth South African growth Inflation
to -1.3% to - to 6.8%
0.8%
• Synchronised global • Mining, manufacturing, • Reweighting of the index
recession
retail in recession • Oil price decline
• Pronounced slowdown in
developing economies • Exports decline by 9.1% • Declining investment and
consumption
• World trade to decline • Imports decline by 5.7%%
Oil/commodity prices Interest rates Current account deficit
To 11.92%
to 50$/barrel
• Many sectors in recession • Significant outflow of
• Declines of more than • Sharp decline in inflation portfolio funds since
60% from peak September 2008
• Extent of decline limited
• Risks are to the downside by CAD • Currency will weaken
further
* Transnet estimate
Source: IMF, World Economic Outlook, Stellenbosch University Bureau of Economic Research
34GLOBAL ECONOMIC CRISES
United States cumulative spending to date $4.28 trillion
Cost of crises: Final estimates $10 trillion (18% of global GDP)A skills shortage.
Stimulus
packages The cost to date ($4.2 trillion) equals the total cost of World war II
(inflationary adjusted)
First quarter GDP -6.4% q/q worst since 1984 q3 (-6.5%)
Impact on Manufacturing value add decline by 22%
South Africa
Mining sector decline by 33%
Recovery will be slow and could take significantly
longer than expected
35
Source: BER/KPMGTHANK YOU
37You can also read


